
[vc_row][vc_column][vc_separator border_width=”5″][/vc_column][/vc_row]
[vc_row][vc_column][vc_column_text]
Hi everyone.
[/vc_column_text][/vc_column][/vc_row]
[vc_row][vc_column][vc_separator border_width=”5″][/vc_column][/vc_row]
[vc_row][vc_column][vc_column_text]
EURUSD
[/vc_column_text][/vc_column][/vc_row]
[vc_row][vc_column][vc_separator border_width=”5″][/vc_column][/vc_row][vc_row][vc_column width=”2/3″][vc_custom_heading text=”1 hr” use_theme_fonts=”yes”][vc_column_text]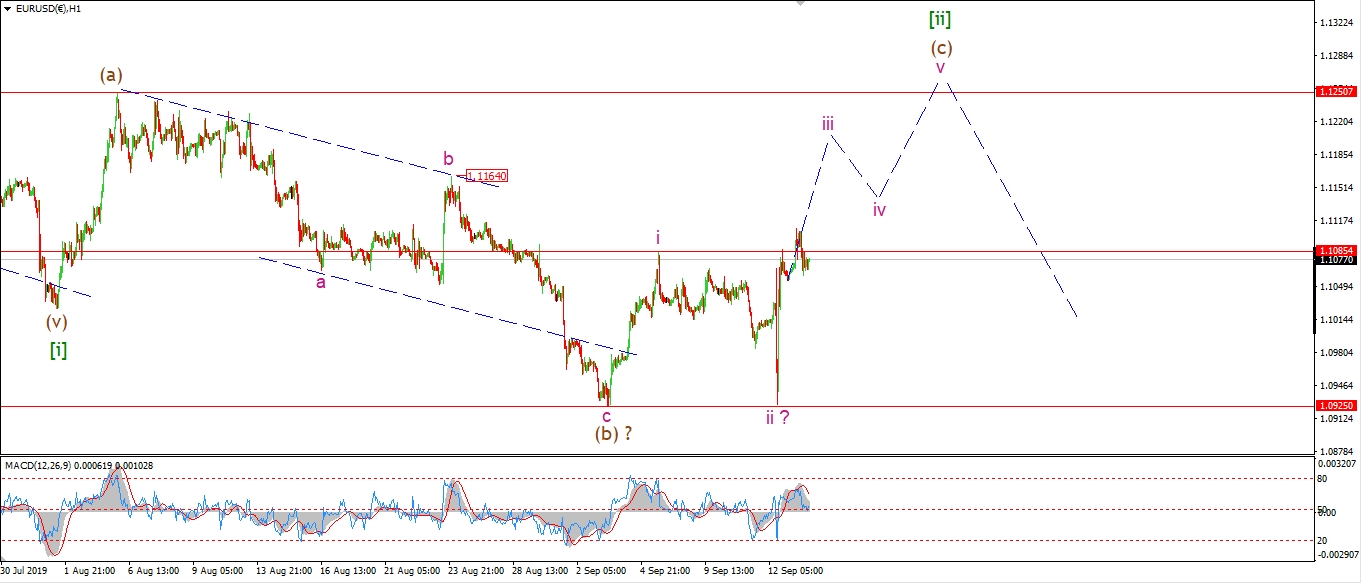 [/vc_column_text][/vc_column][vc_column width=”1/3″][vc_custom_heading text=”4 Hours” use_theme_fonts=”yes”][vc_column_text]
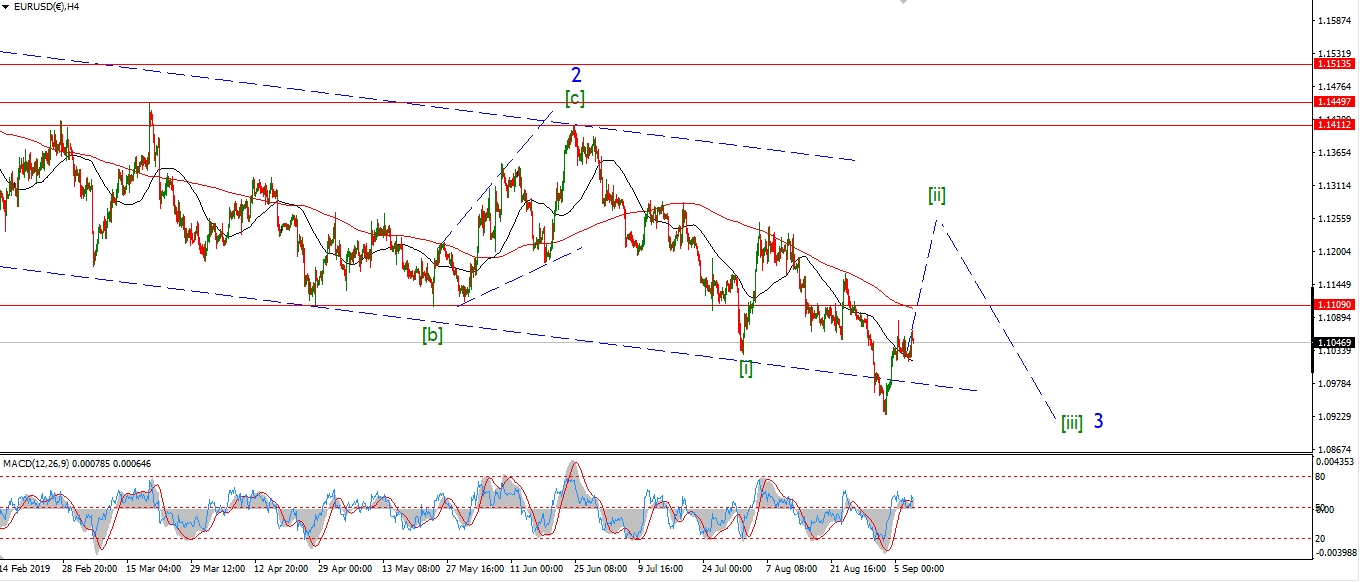 [/vc_column_text][vc_custom_heading text=”Daily” use_theme_fonts=”yes”][vc_column_text]
 [/vc_column_text][/vc_column][/vc_row]
[vc_row][vc_column][vc_column_text]
EURUSD is hanging onto the recovery off yesterdays reactionary sell off.
So the wave count for wave (c) is still valid as we close out the week.
Wave ‘iii’ of (c) should carry the price back up to 1.1200
by the time it completes.
And the target remains at 1.1250 overall for wave (c).
I described one scenario in the weekend video
where the action off the low labelled wave (b)
is a flat correction higher in a much smaller wave [ii].
this is now the alternate count.
Monday;
Watch for wave (c) to continue higher and hold above 1.1085 for much of the week.
1.0925 must hold.
[/vc_column_text][/vc_column][/vc_row]
[vc_row][vc_column][vc_separator border_width=”5″][/vc_column][/vc_row][vc_row][vc_column][vc_column_text]
GBPUSD
[/vc_column_text][/vc_column][/vc_row][vc_row][vc_column][vc_separator border_width=”5″][/vc_column][/vc_row][vc_row][vc_column width=”2/3″][vc_custom_heading text=”1 hr” use_theme_fonts=”yes”][vc_column_text]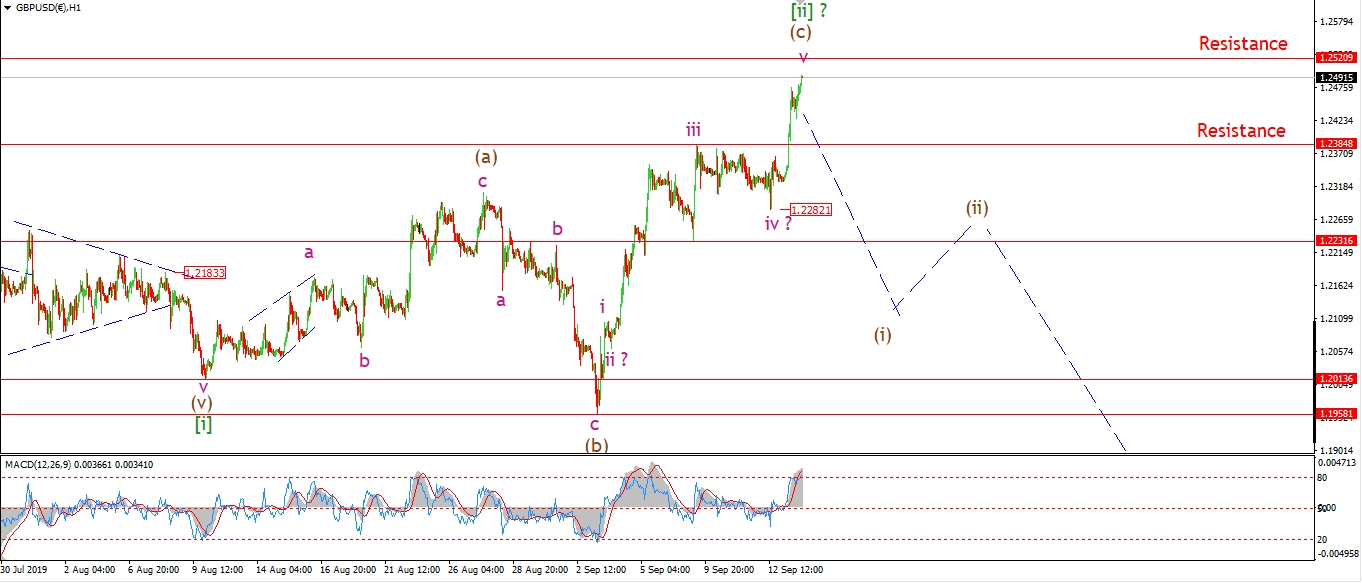 [/vc_column_text][/vc_column][vc_column width=”1/3″][vc_custom_heading text=”4 Hours” use_theme_fonts=”yes”][vc_column_text]
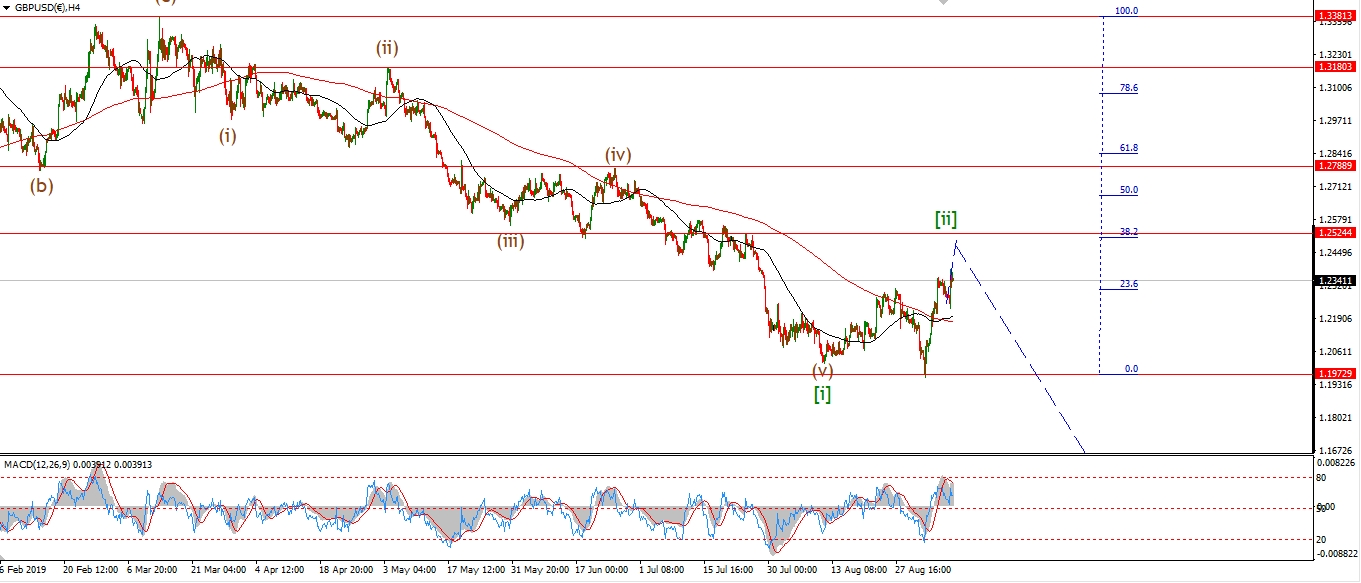 [/vc_column_text][vc_custom_heading text=”Daily” use_theme_fonts=”yes”][vc_column_text]
 [/vc_column_text][/vc_column][/vc_row]
[vc_row][vc_column][vc_column_text]
The rally off the wave (b) low in cable has now completed a five wave structure.
Wave ‘v’ of (v) itself has traced out a five wave rally into this evenings high.
And the price is also very close to the target at 1.2520 now.
So,
all in all I think we can say that cable is near the end of this corrective rally.
And the next major move will be to the downside in wave [iii].
Monday;
Watch for wave ‘v’ to top out by the end of trading on Monday.
Wave (i) of [iii] should get underway early next week
and there is every chance that it will carry the price back below 1.2000 again.
[/vc_column_text][/vc_column][/vc_row]
[vc_row][vc_column][vc_separator border_width=”5″][/vc_column][/vc_row][vc_row][vc_column][vc_column_text]
USDJPY
[/vc_column_text][/vc_column][/vc_row][vc_row][vc_column][vc_separator border_width=”5″][/vc_column][/vc_row][vc_row][vc_column width=”2/3″][vc_custom_heading text=”1 hr” use_theme_fonts=”yes”][vc_column_text]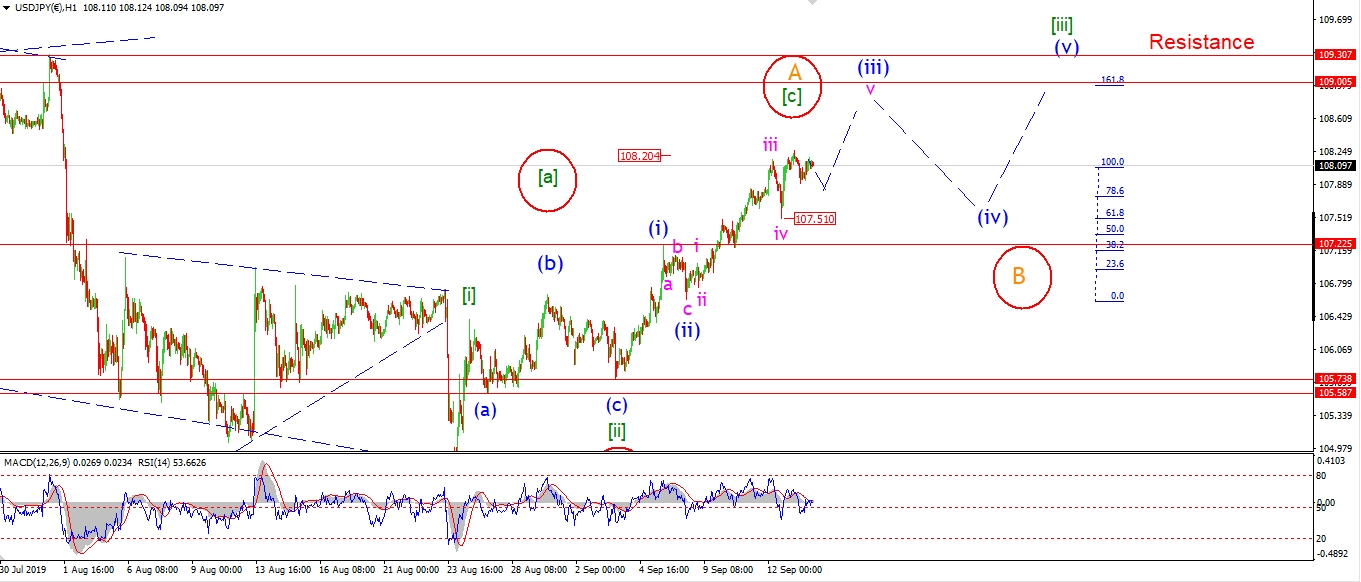 [/vc_column_text][/vc_column][vc_column width=”1/3″][vc_custom_heading text=”4 Hours” use_theme_fonts=”yes”][vc_column_text]
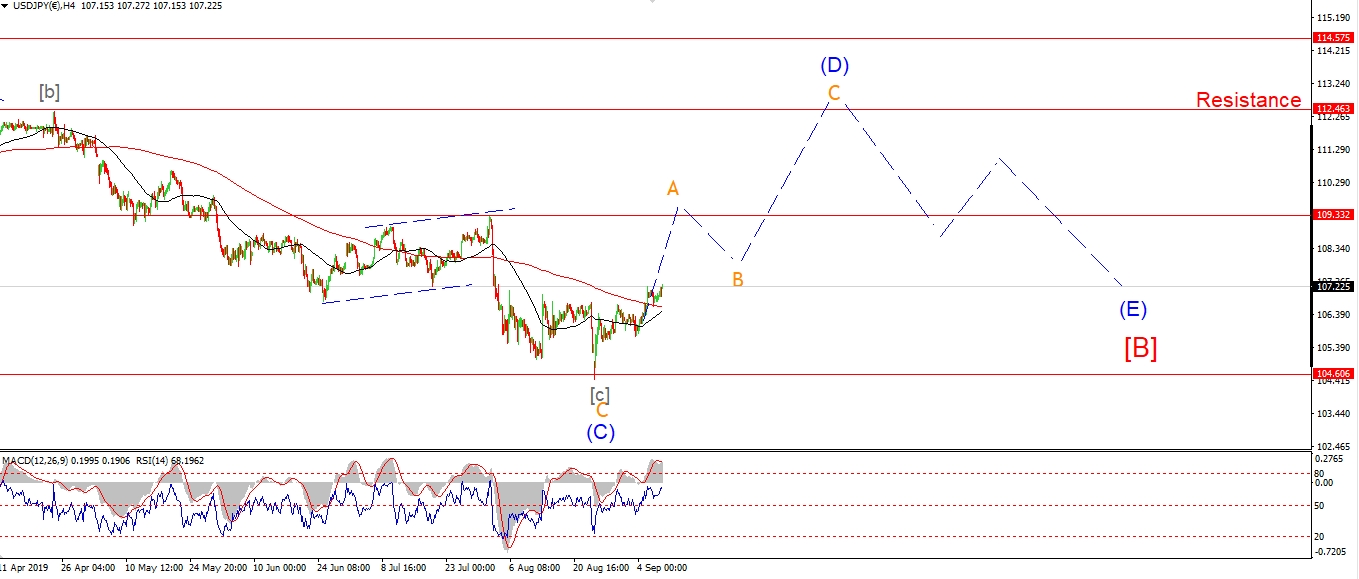 [/vc_column_text][vc_custom_heading text=”Daily” use_theme_fonts=”yes”][vc_column_text]
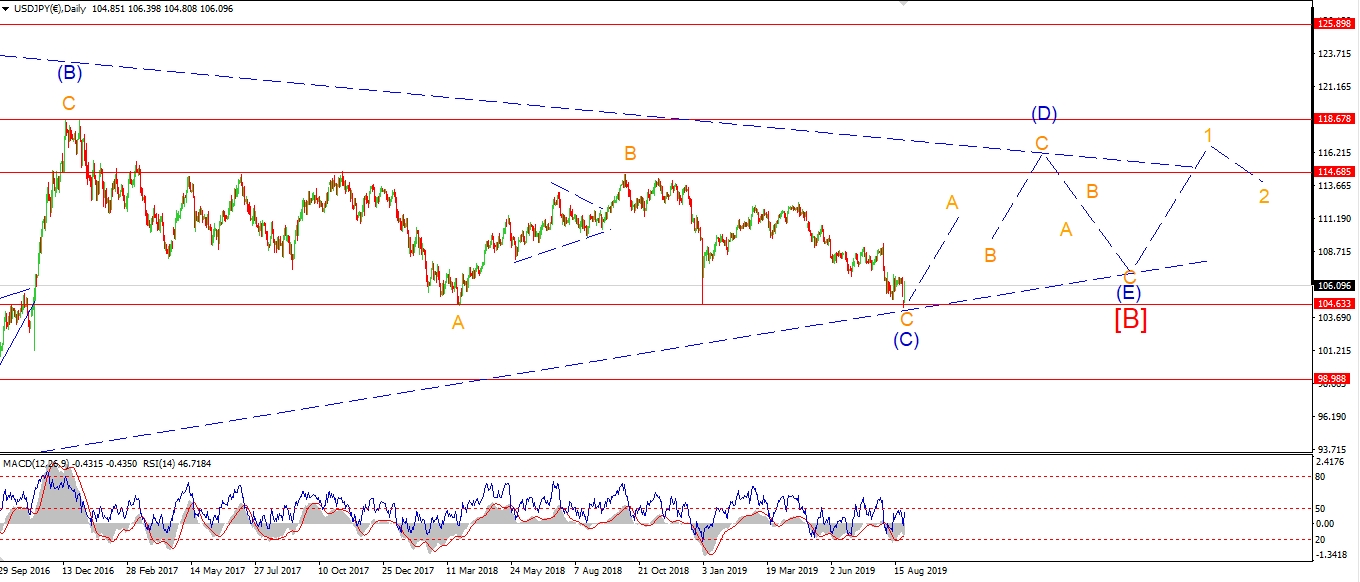 [/vc_column_text][/vc_column][/vc_row]
[vc_row][vc_column][vc_column_text]
USDJPY broke above the wave ‘iii’ high in the overnight session,
and so far today the price has corrected off that high.
Todays high can be viewed as the final high for wave (iii),
but I am allowing for another move higher in wave ‘v’
after a three wave decline as shown.
In this case 107.50 must hold.
Monday;
Watch for wave (iii) to push higher one more time towards 109.00 before correcting again in wave (iv) blue.
A break of 107.22 again will trigger the alternate count.
[/vc_column_text][/vc_column][/vc_row]
[vc_row][vc_column][vc_separator border_width=”5″][/vc_column][/vc_row][vc_row][vc_column][vc_column_text]
DOW JONES INDUSTRIALS
[/vc_column_text][/vc_column][/vc_row][vc_row][vc_column][vc_separator border_width=”5″][/vc_column][/vc_row][vc_row][vc_column width=”2/3″][vc_custom_heading text=”1 hr” use_theme_fonts=”yes”][vc_column_text]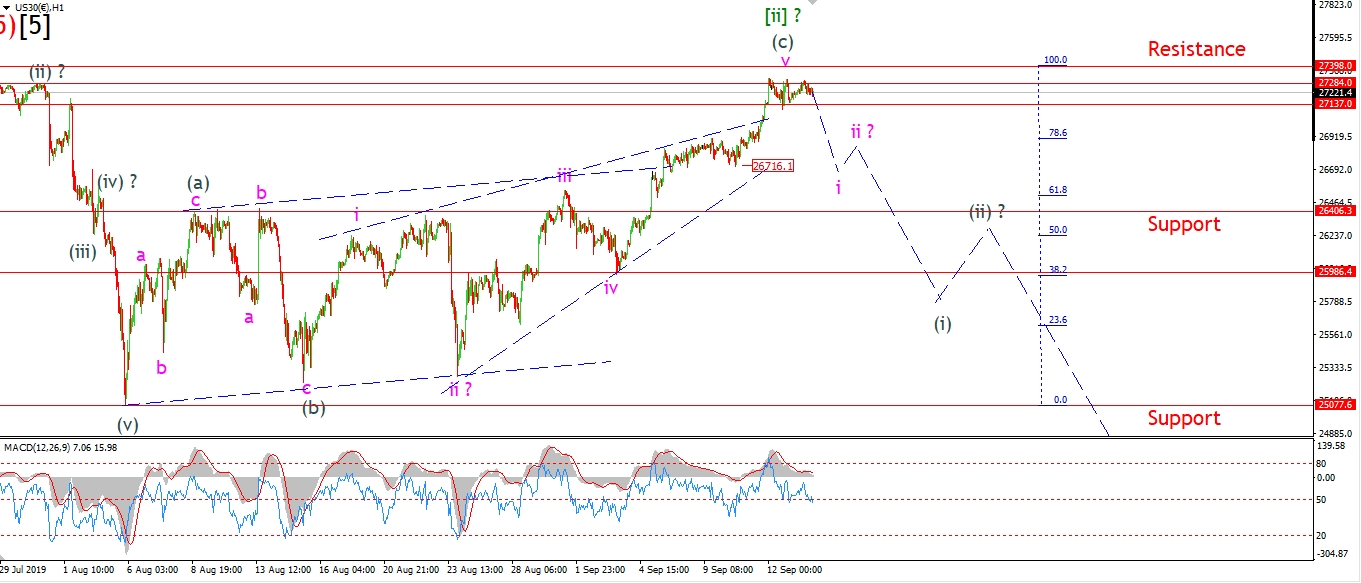 [/vc_column_text][/vc_column][vc_column width=”1/3″][vc_custom_heading text=”4 Hours” use_theme_fonts=”yes”][vc_column_text]
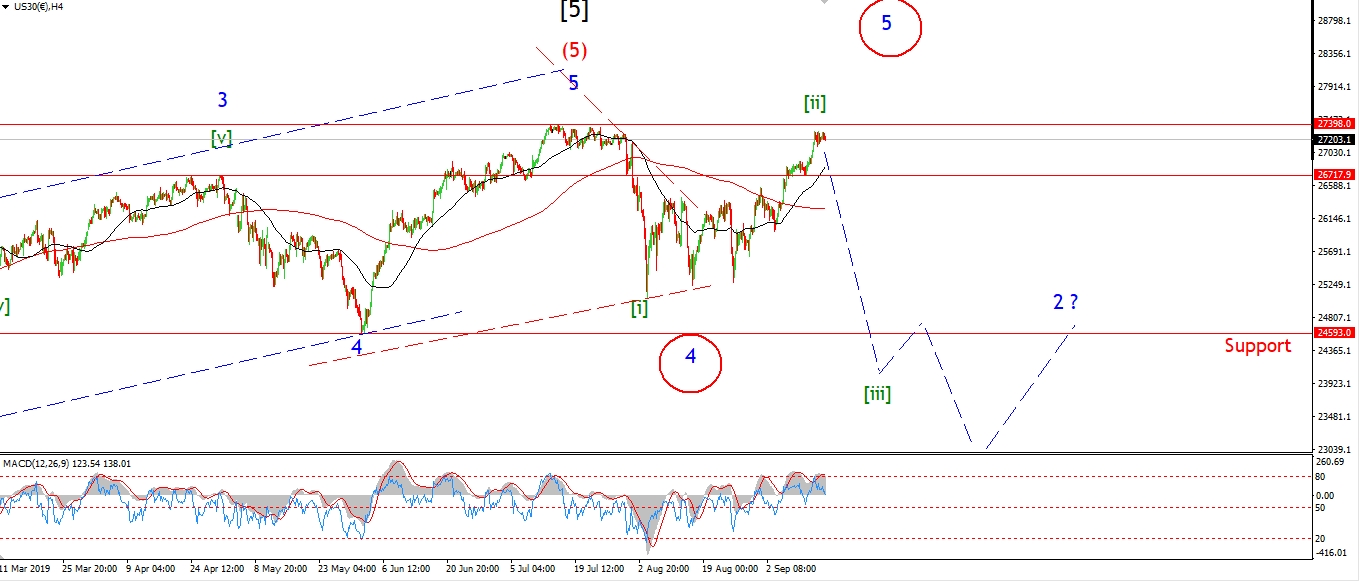 [/vc_column_text][vc_custom_heading text=”Daily” use_theme_fonts=”yes”][vc_column_text]
 [/vc_column_text][/vc_column][/vc_row]
[vc_row][vc_column][vc_column_text]
Another day of indecision for the DOW.
Will the market break to a new high and postpone the bearmarket for another month or so.
Or can we just cut the crap now and get on with the inevitable!
I mentioned the main alternative count on the weekend video.
This is now shown on the 4hr chart.
It involves a very awkward triangle in wave ‘4’ of (5) which may have completed on August 15th.
And off that low wave ‘5’ of (5) is carrying the price higher.
This alternate would allow for a run up to 28000 to finish the rally.
If the price breaks 27398 next week,
that will trigger the alternate count.
Monday;
I am still hoping against hope now that the bearish count will hold.
We will have to wait and see.
[/vc_column_text][/vc_column][/vc_row]
[vc_row][vc_column][vc_separator border_width=”5″][/vc_column][/vc_row][vc_row][vc_column][vc_column_text]
GOLD
[/vc_column_text][/vc_column][/vc_row][vc_row][vc_column][vc_separator border_width=”5″][/vc_column][/vc_row][vc_row][vc_column width=”2/3″][vc_custom_heading text=”1 hr” use_theme_fonts=”yes”][vc_column_text]
 [/vc_column_text][/vc_column][vc_column width=”1/3″][vc_custom_heading text=”4 Hours” use_theme_fonts=”yes”][vc_column_text]
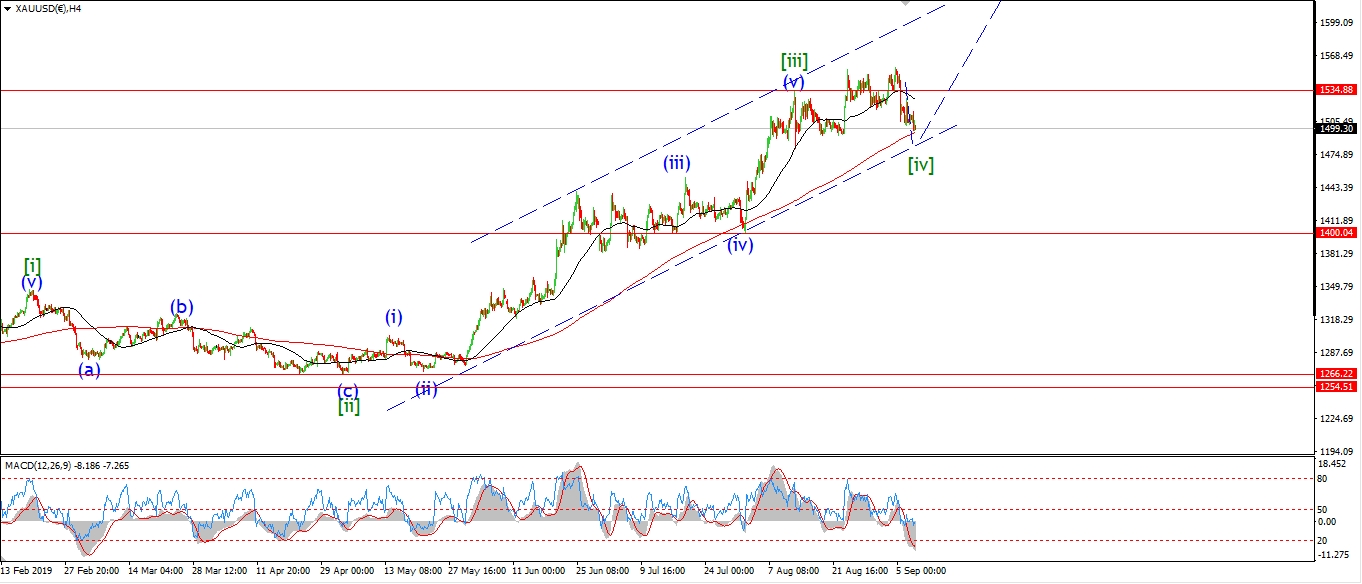 [/vc_column_text][vc_custom_heading text=”Daily” use_theme_fonts=”yes”][vc_column_text]
 [/vc_column_text][/vc_column][/vc_row]
[vc_row][vc_column][vc_column_text]
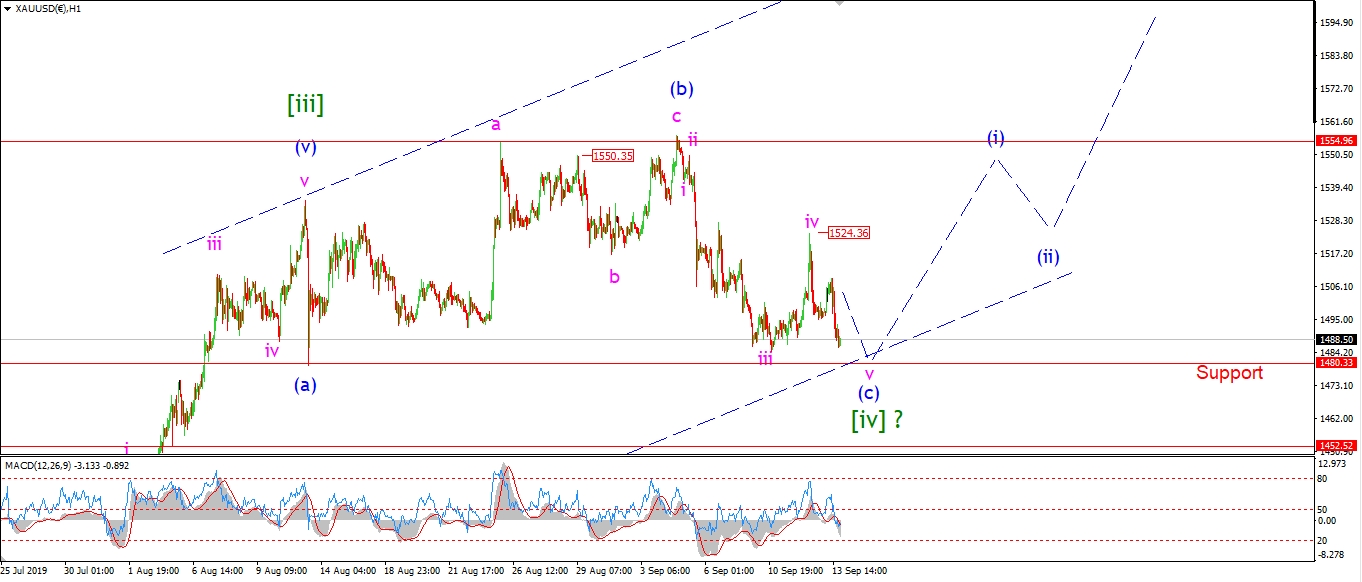
Gold is lower again today off the wave ‘iv’ high created early Thursday.
The price is now drawing close to completing five waves down in wave (c).
A break of 1480 will be enough to satisfy an expanded flat correction in wave [iv].
And that is what I am looking for right now.
Once this correction is over I will be looking higher again in wave [v] of ‘3’.
This next leg up has the potential to carry the price back up to about 1650 in wave ‘3’.
And if the stock market rolls over in the meantime,
that high could be stretched!
Back to the short term.
Monday;
Watch for a final low in wave (c) to come in at above 1480.
Wave (i) of [v] should push back up to about 1550 again.
[/vc_column_text][/vc_column][/vc_row]
[vc_row][vc_column][vc_separator border_width=”5″][/vc_column][/vc_row][vc_row][vc_column][vc_column_text]
U.S CRUDE OIL
[/vc_column_text][/vc_column][/vc_row][vc_row][vc_column][vc_separator border_width=”5″][/vc_column][/vc_row][vc_row][vc_column width=”2/3″][vc_custom_heading text=”1 hr” use_theme_fonts=”yes”][vc_column_text]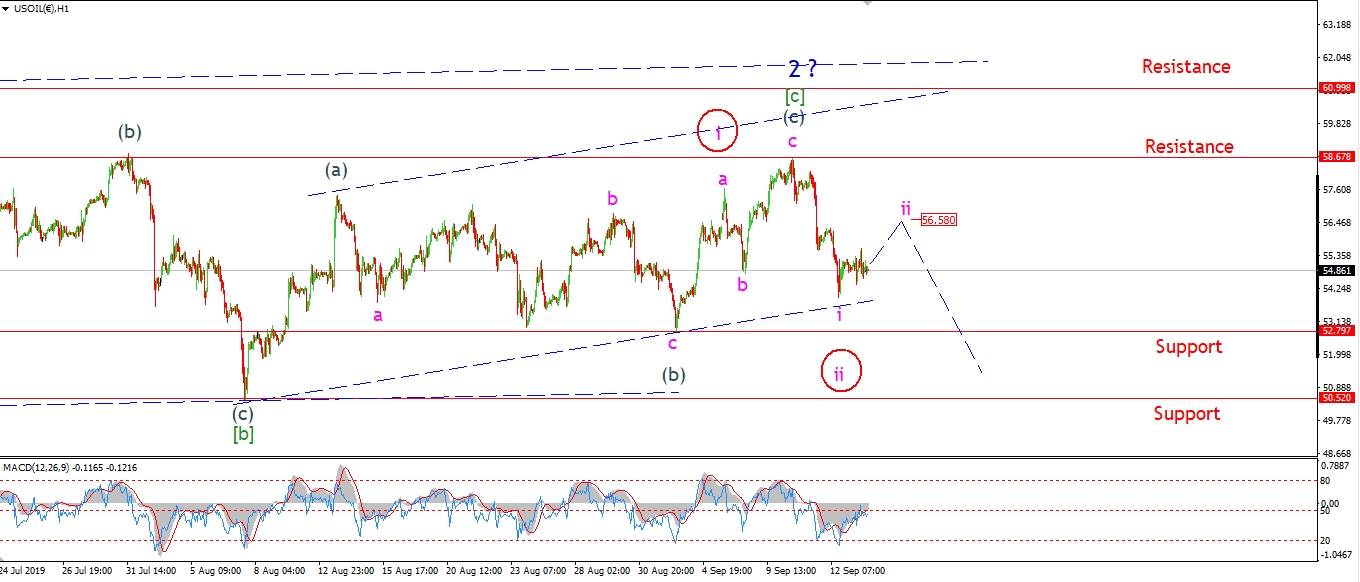 [/vc_column_text][/vc_column][vc_column width=”1/3″][vc_custom_heading text=”4 Hours” use_theme_fonts=”yes”][vc_column_text]
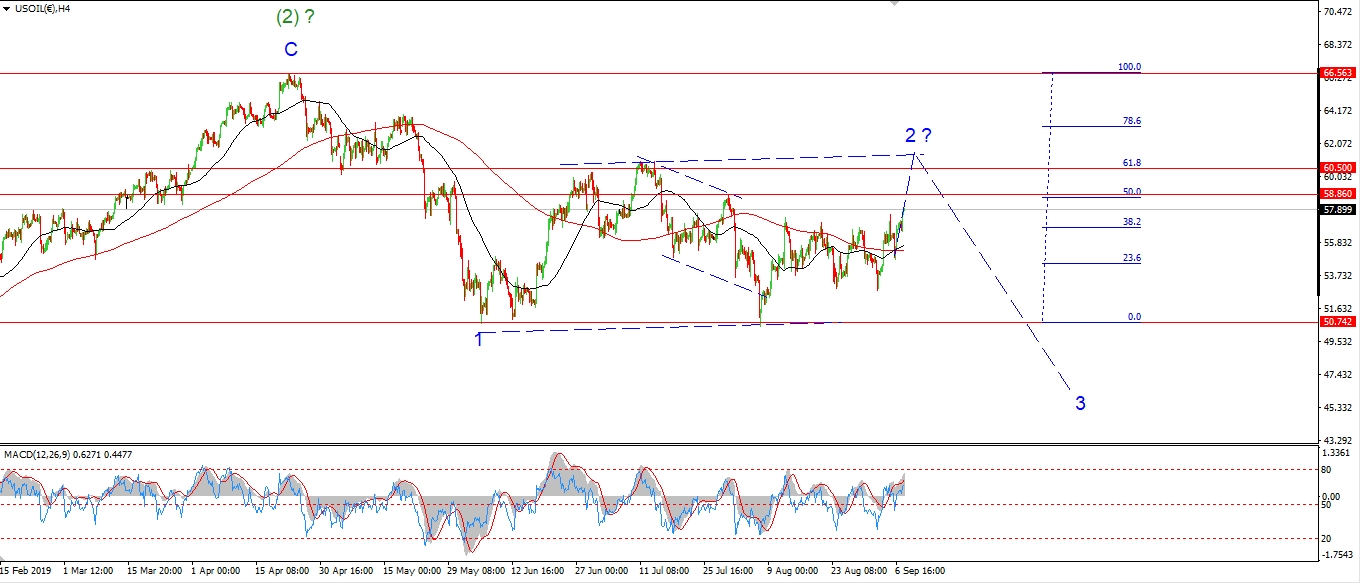 [/vc_column_text][vc_custom_heading text=”Daily” use_theme_fonts=”yes”][vc_column_text]
 [/vc_column_text][/vc_column][/vc_row]
[vc_row][vc_column][vc_column_text]
I must admit,
the action today is very corrective looking off Thursdays low.
It is becoming more likely that this weeks high is the end of the road for wave ‘2’ now
and wave ‘3’ may be on the cards at long last!
I think the key level still lies at 50.52, the wave [b] low.
If that level is broken next week,
that should confirm wave [i] of ‘3’ has begun.
If this short term count is correct,
then we are in for interesting times ahead for crude.
Monday;
watch for wave ‘ii’ to complete at or below 56.50.
A break of 52.79 will signal wave ‘iii’ down has begun.
[/vc_column_text][/vc_column][/vc_row]
[vc_row][vc_column][vc_separator border_width=”5″][/vc_column][/vc_row][vc_row][vc_column][vc_column_text]
US 10 yr Treasuries.
[/vc_column_text][/vc_column][/vc_row][vc_row][vc_column][vc_separator border_width=”5″][/vc_column][/vc_row][vc_row][vc_column width=”2/3″][vc_custom_heading text=”1 hr” use_theme_fonts=”yes”][vc_column_text]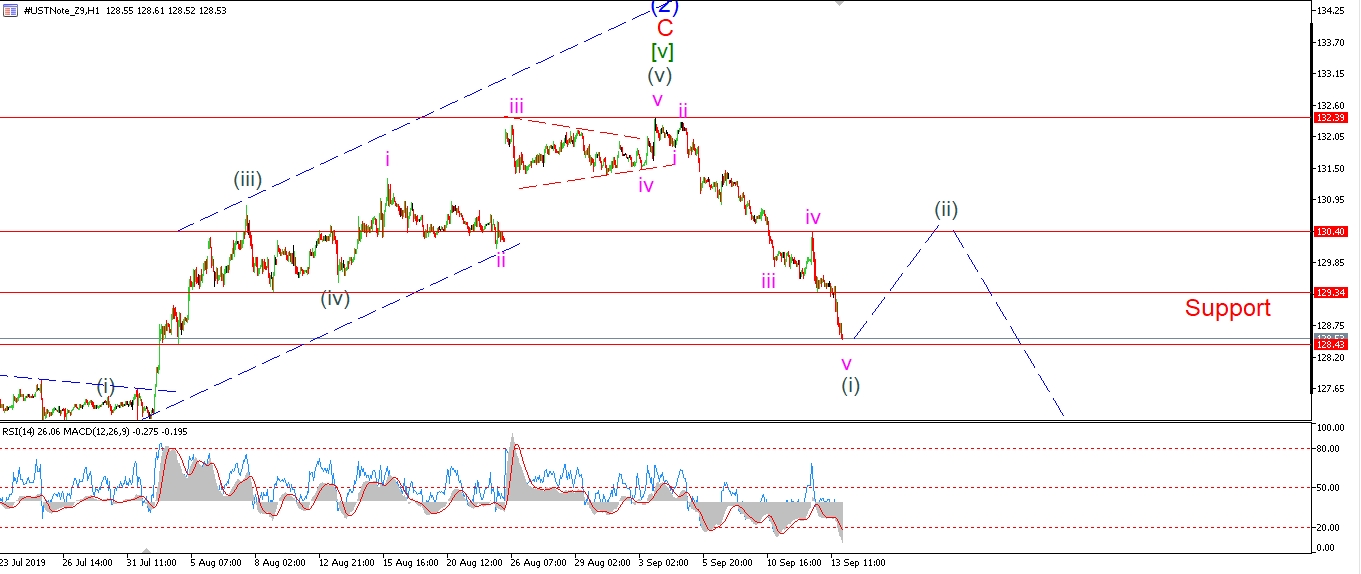 [/vc_column_text][/vc_column][vc_column width=”1/3″][vc_custom_heading text=”4 Hours” use_theme_fonts=”yes”][vc_column_text]
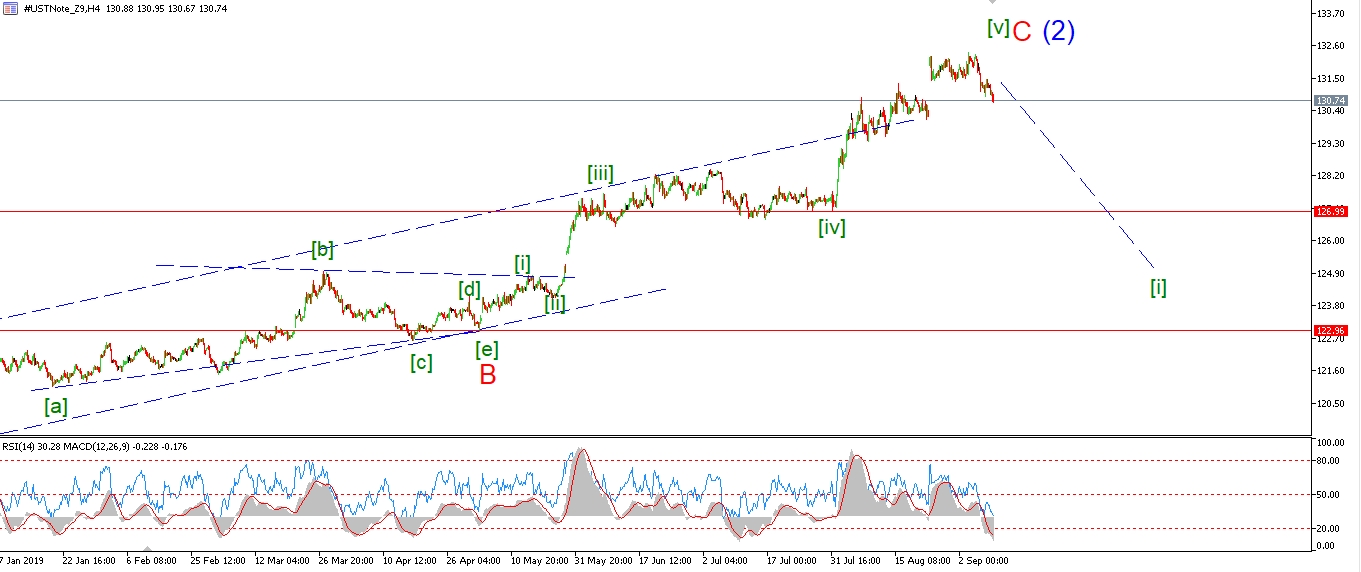 [/vc_column_text][vc_custom_heading text=”Daily” use_theme_fonts=”yes”][vc_column_text]
 [/vc_column_text][/vc_column][/vc_row]
[vc_row][vc_column][vc_column_text]
The 10YR has traced out a five wave decline off the recent high at 132.39 this week.
The price has actually accelerated lower this today in wave ‘v’ of (i).
So we are looking good now for a major turn down in the general bond market to get underway.
I will be looking for a three wave recovery in wave (ii) next week to complete a bearish signal in bonds.
And then we should see some fireworks in wave (iii) as the month goes on.
If the wave count in bonds is correct,
and treasury prices are in fact entering a bear market.
Then we are looking at a serious turn lower for the general credit market as a whole.
The underlying instrument in the wider credit market the long term bond,
and if yields go up in treasuries,
then yields go up for corporate, mortgage and every other form of debt.
Remember how the 2008 crises started,
A decline in value of a small part of the credit markets.
now multiply that crises by 10,
and you can begin to understand what a U.S treasury bond market crash will look like.
There is no way you avoid a depression in this scenario!
But I am getting ahead of myself as usual!
Monday;
Watch for wave (i) to close out soon.
Wave (ii) could take the bulk of next week to complete.
[/vc_column_text][/vc_column][/vc_row]
[vc_row][vc_column][vc_separator border_width=”5″][/vc_column][/vc_row][vc_row][vc_column][vc_column_text]
SILVER
[/vc_column_text][/vc_column][/vc_row][vc_row][vc_column][vc_separator border_width=”5″][/vc_column][/vc_row][vc_row][vc_column width=”2/3″][vc_custom_heading text=”1 hr” use_theme_fonts=”yes”][vc_column_text]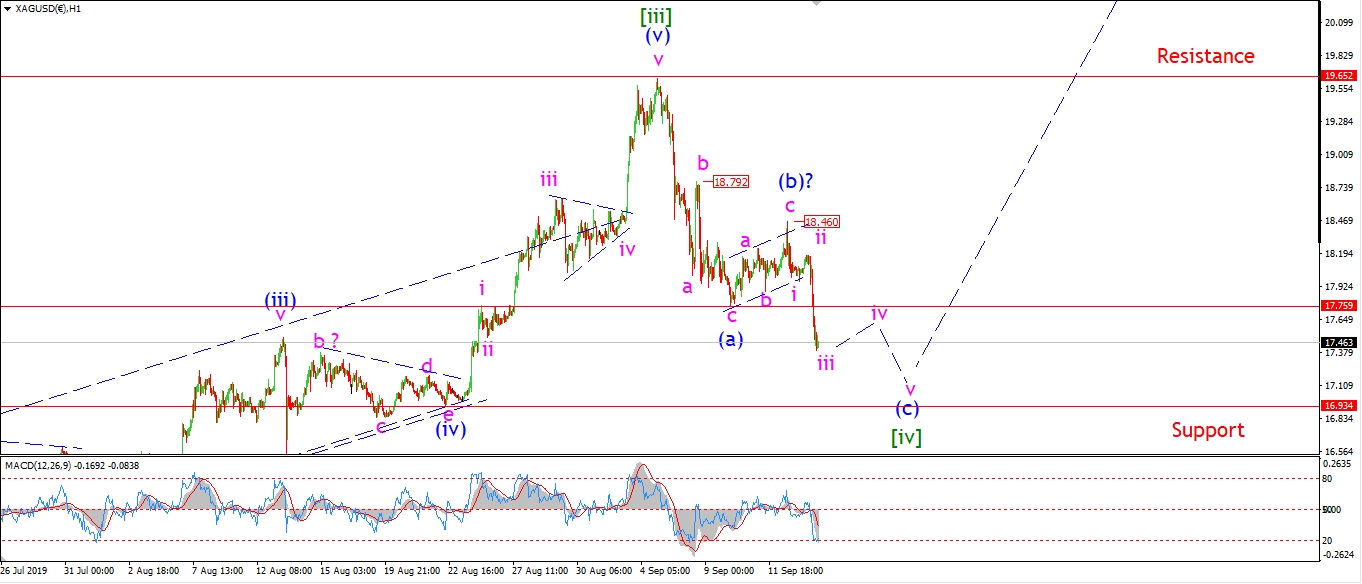 [/vc_column_text][/vc_column][vc_column width=”1/3″][vc_custom_heading text=”4 Hours” use_theme_fonts=”yes”][vc_column_text]
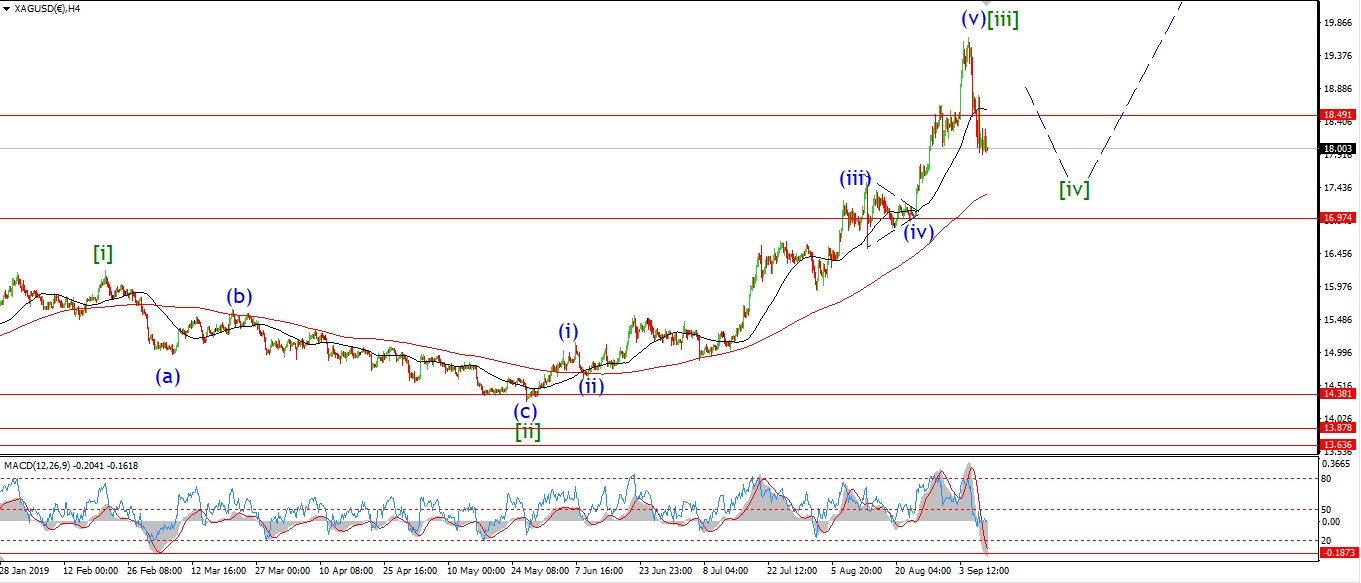 [/vc_column_text][vc_custom_heading text=”Daily” use_theme_fonts=”yes”][vc_column_text]
 [/vc_column_text][/vc_column][/vc_row]
[vc_row][vc_column][vc_column_text]
Silver dropped in a nice impulsive fashion today in wave ‘iii’ of (c).
The decline in wave [iv] is tracing out a flat correction at the moment,
with a 3,3,5 overall pattern now looking fairly certain.
Wave (c) of [iv] should hit the target area at 16.90 by Tuesday all going well.
Monday;
Watch for wave (c) to continue lower for the early part of the week.
wave ‘iv’ of (c) will begin by Monday evening.
Next week should clear the corrective action out of the wave in the metals,
and then we can look higher again.
[/vc_column_text][/vc_column][/vc_row]
[vc_row][vc_column][vc_separator border_width=”5″][/vc_column][/vc_row][vc_row][vc_column][vc_column_text]
S&P 500.
[/vc_column_text][/vc_column][/vc_row][vc_row][vc_column][vc_separator border_width=”5″][/vc_column][/vc_row][vc_row][vc_column width=”2/3″][vc_custom_heading text=”1 hr” use_theme_fonts=”yes”][vc_column_text]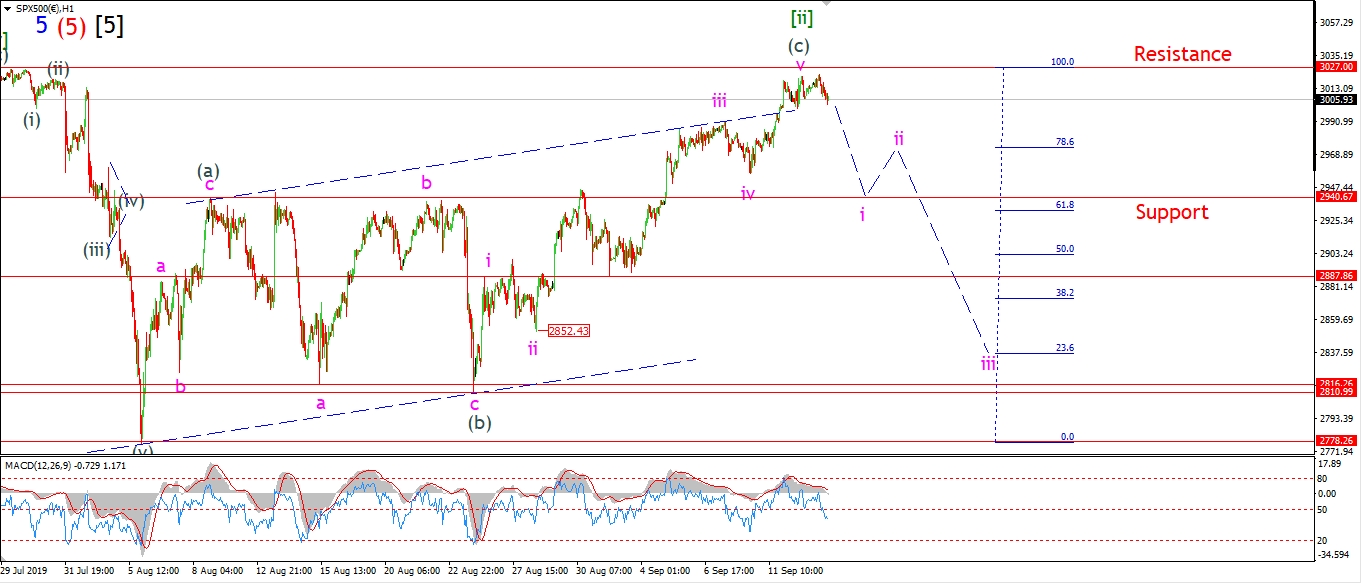 [/vc_column_text][/vc_column][vc_column width=”1/3″][vc_custom_heading text=”4 Hours” use_theme_fonts=”yes”][vc_column_text]
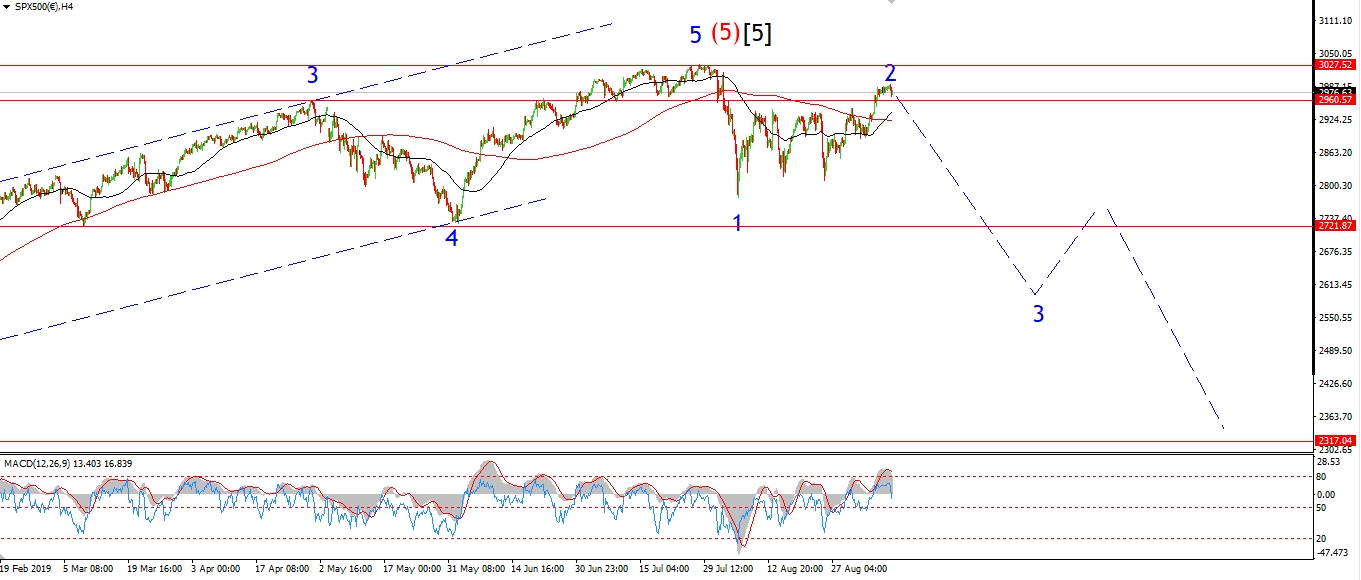 [/vc_column_text][vc_custom_heading text=”Daily” use_theme_fonts=”yes”][vc_column_text]
 [/vc_column_text][/vc_column][/vc_row]
[vc_row][vc_column][vc_column_text]
The S&P has turned lower this evening after failing to break the all time high.
The bearish count is holding on by the skin of its teeth now,
but if we see a further decline on Monday in five waves,
and that decline breaks support at 2940,
that action will favor the bearish outlook for sure.
The alternate count for the S&P is identical to the DOW at the moment,
and this can be seen on the 4hr chart.
Monday;
Watch for a possible decline in wave (i) again.
2940 marks the wave (a) high and if it breaks we are back in business!
[/vc_column_text][/vc_column][/vc_row]
[vc_row][vc_column][vc_separator border_width=”5″][/vc_column][/vc_row]