
[vc_row][vc_column][vc_separator border_width=”5″][/vc_column][/vc_row]
[vc_row][vc_column][vc_column_text]
Good evening folks.
Back at it again after the long holiday weekend.
And even though the U.S market is open today it was a slow session without any shocking moves yet.
But this week has potential to begin a third wave scenario in both the stock market and crude oil.
so without further adieu,
Lets get into it.
[/vc_column_text][/vc_column][/vc_row]
[vc_row][vc_column][vc_separator border_width=”5″][/vc_column][/vc_row]
[vc_row][vc_column][vc_column_text]
EURUSD
[/vc_column_text][/vc_column][/vc_row]
[vc_row][vc_column][vc_separator border_width=”5″][/vc_column][/vc_row][vc_row][vc_column width=”2/3″][vc_custom_heading text=”1 hr” use_theme_fonts=”yes”][vc_column_text]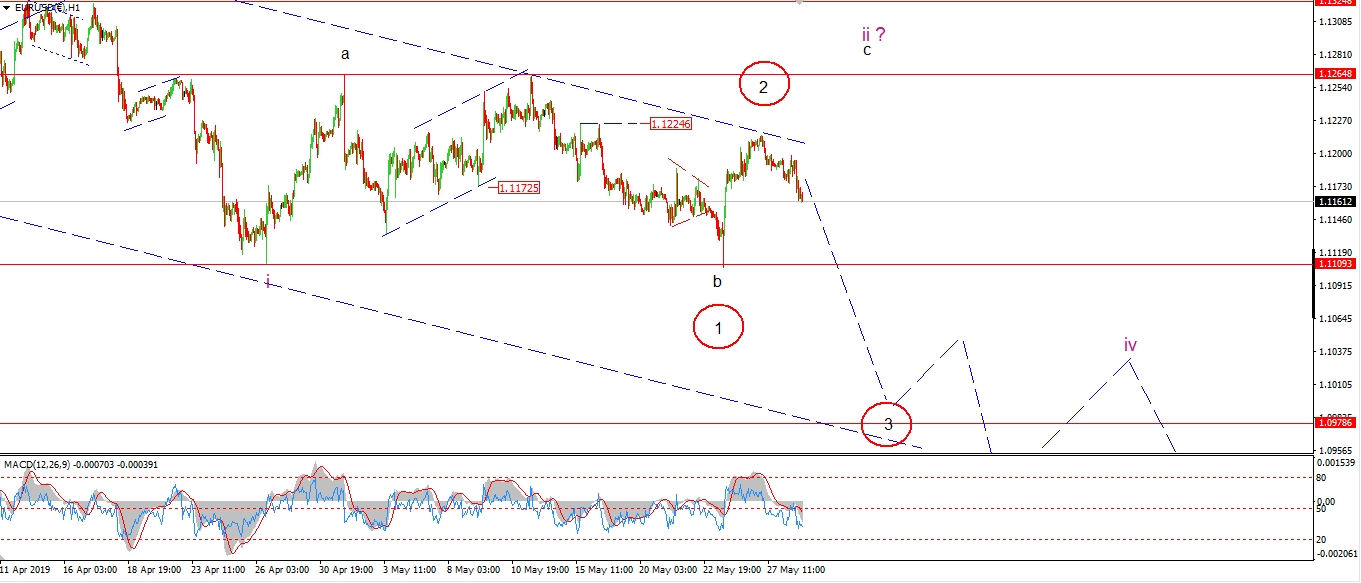 [/vc_column_text][/vc_column][vc_column width=”1/3″][vc_custom_heading text=”4 Hours” use_theme_fonts=”yes”][vc_column_text]
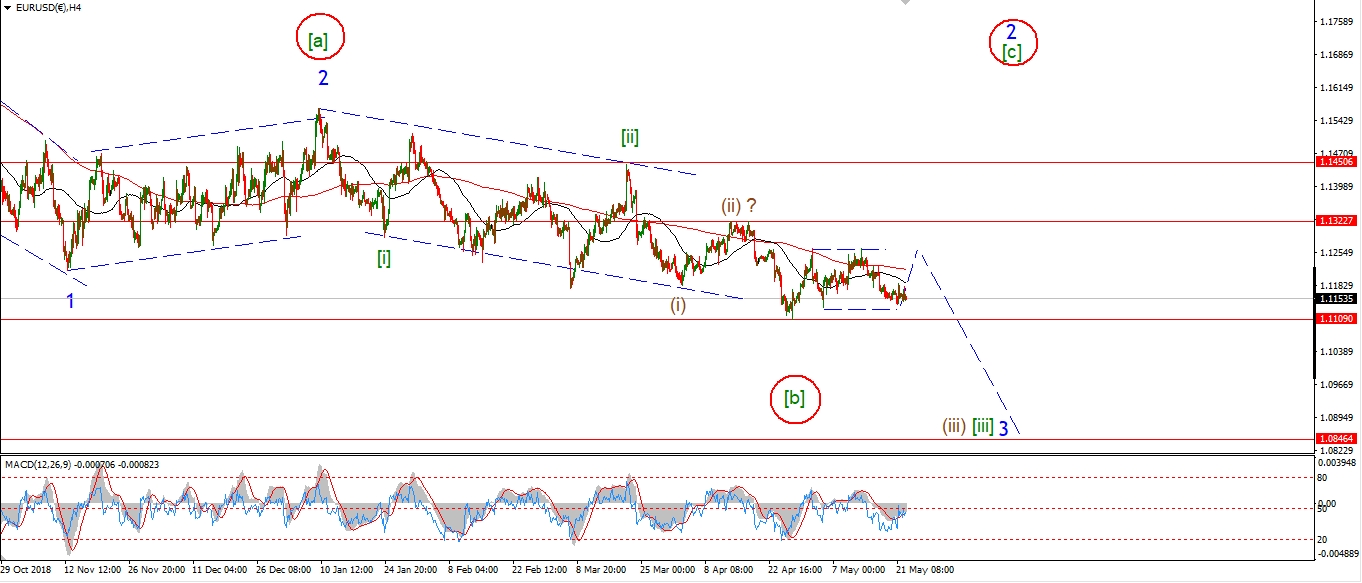 [/vc_column_text][vc_custom_heading text=”Daily” use_theme_fonts=”yes”][vc_column_text]
 [/vc_column_text][/vc_column][/vc_row]
[vc_row][vc_column][vc_column_text]
I have switched to the alternate scenario for wave ‘ii’ in EURUSD today.
The market did fall off Fridays highs,
but that decline looks like a three wave structure so far.
If we see an acceleration lower tomorrow and a break of 1.1109 again.
That will signal that wave ‘iii’ down has started.
But for the moment,
I think it is worthwhile allowing for a larger wave ‘ii’ to complete before that decline into wave ‘iii’ begins.
A break above 1.1224 will confirm this wave ‘ii’ count.
Tomorrow;
Watch for wave ‘c’ of ‘ii’ to complete below 1.1264.
Wave ‘iii’ down should begin before the end of this week.
[/vc_column_text][/vc_column][/vc_row]
[vc_row][vc_column][vc_separator border_width=”5″][/vc_column][/vc_row][vc_row][vc_column][vc_column_text]
GBPUSD
[/vc_column_text][/vc_column][/vc_row][vc_row][vc_column][vc_separator border_width=”5″][/vc_column][/vc_row][vc_row][vc_column width=”2/3″][vc_custom_heading text=”1 hr” use_theme_fonts=”yes”][vc_column_text]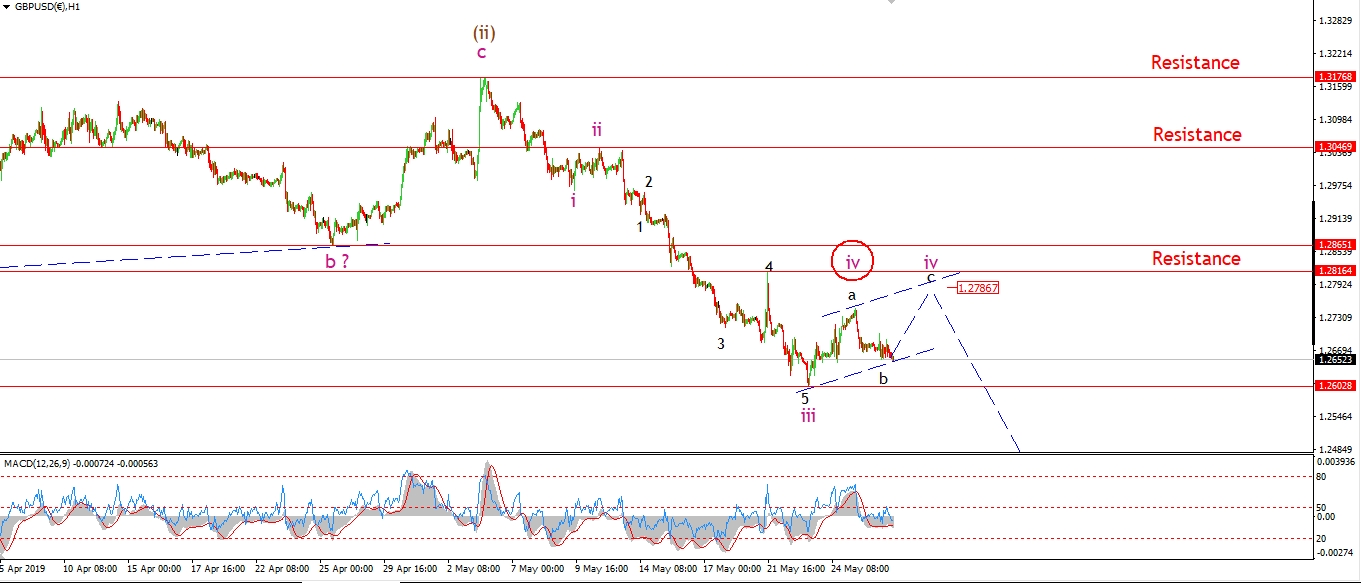 [/vc_column_text][/vc_column][vc_column width=”1/3″][vc_custom_heading text=”4 Hours” use_theme_fonts=”yes”][vc_column_text]
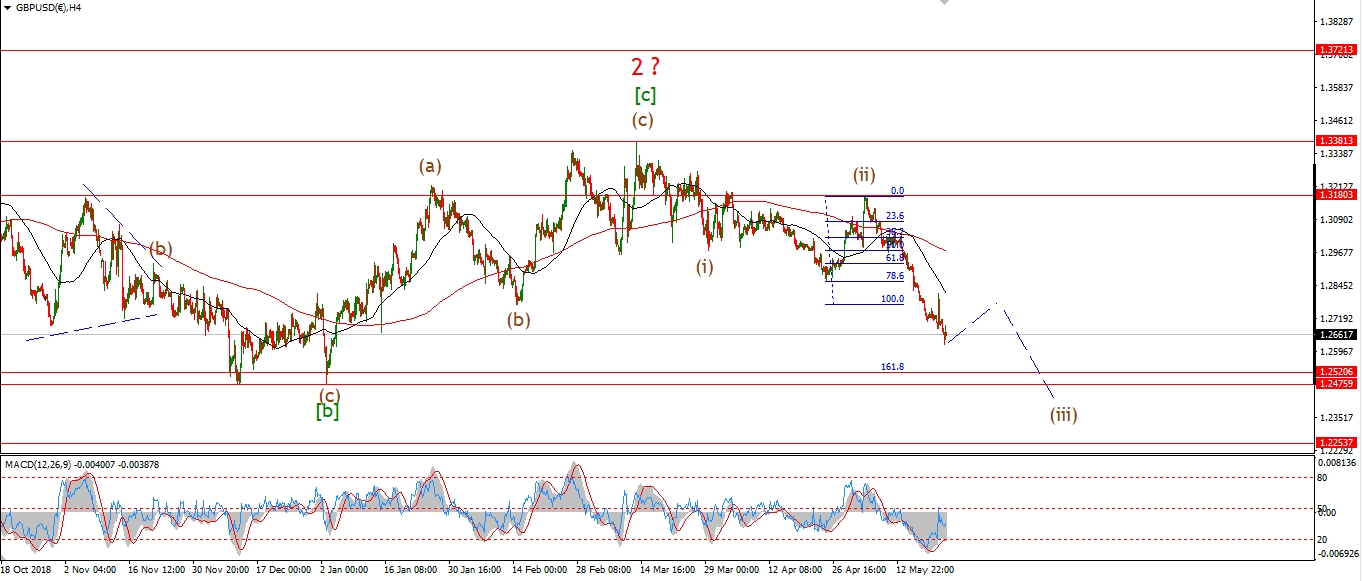 [/vc_column_text][vc_custom_heading text=”Daily” use_theme_fonts=”yes”][vc_column_text]
 [/vc_column_text][/vc_column][/vc_row]
[vc_row][vc_column][vc_column_text]
GBPUSD fell off Fridays high today,
but the decline has stalled above the wave ‘iii’ low at 1.2655.
With this in mind,
it looks like wave ‘iv’ is still in force, todays decline is labelled wave ‘b’ of ‘iv’.
If this short term count is correct then we can expect wave ‘c’ of ‘iv’
to continue higher and fill the trend channel tomorrow.
Wave ‘iv’ should complete at resistance of 1.2816 and then turn lower again into wave ‘v’ of (iii).
Tomorrow;
watch for wave ‘b’ to complete above 1.2602
and wave ‘c’ to rise to resistance.
A break of 1.2602 will favor the alternate wave ‘iv’ shown circled in red.
[/vc_column_text][/vc_column][/vc_row]
[vc_row][vc_column][vc_separator border_width=”5″][/vc_column][/vc_row][vc_row][vc_column][vc_column_text]
USDJPY
[/vc_column_text][/vc_column][/vc_row][vc_row][vc_column][vc_separator border_width=”5″][/vc_column][/vc_row][vc_row][vc_column width=”2/3″][vc_custom_heading text=”1 hr” use_theme_fonts=”yes”][vc_column_text]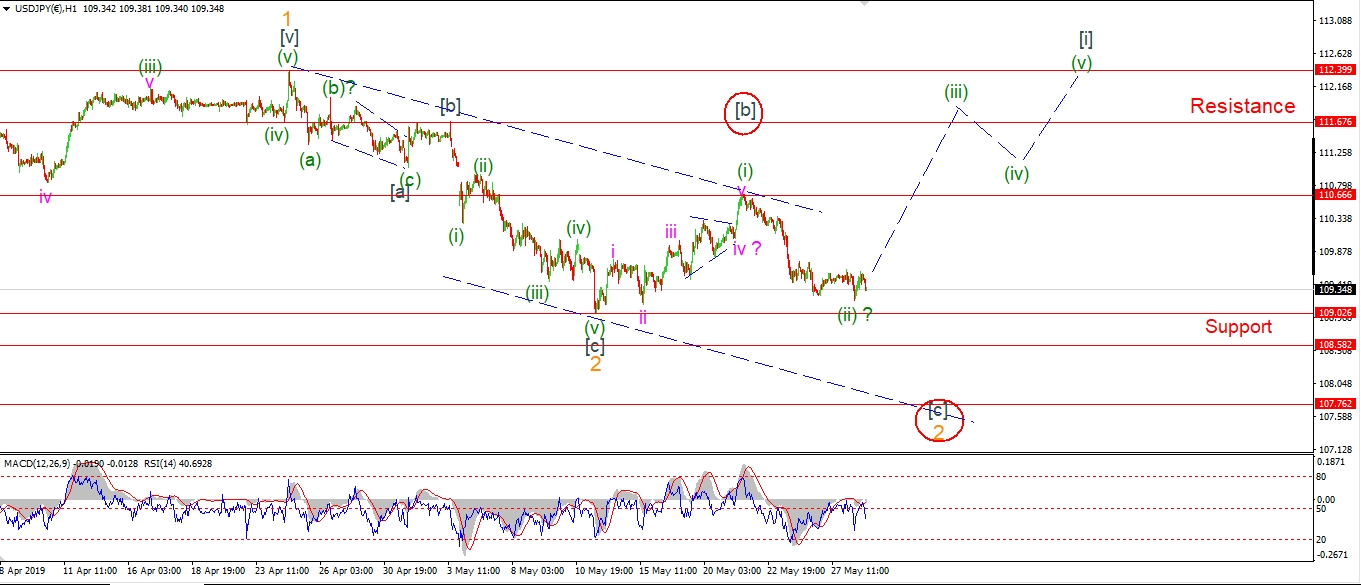 [/vc_column_text][/vc_column][vc_column width=”1/3″][vc_custom_heading text=”4 Hours” use_theme_fonts=”yes”][vc_column_text]
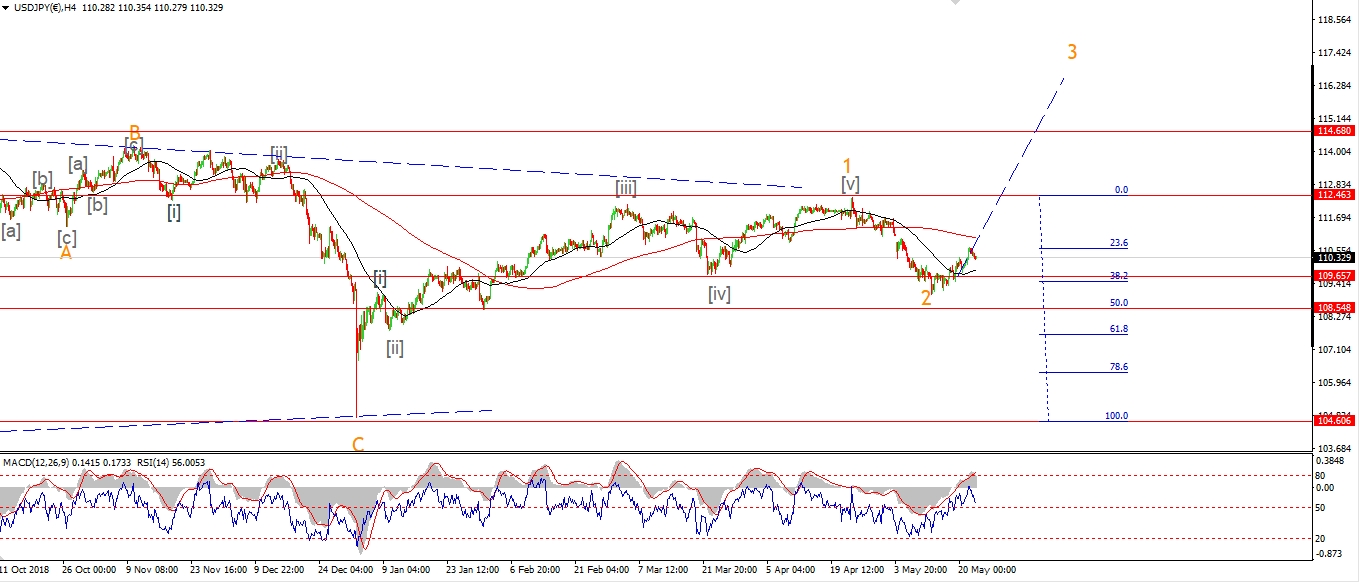 [/vc_column_text][vc_custom_heading text=”Daily” use_theme_fonts=”yes”][vc_column_text]
 [/vc_column_text][/vc_column][/vc_row]
[vc_row][vc_column][vc_column_text]
There was little respite for USDJPY today
and the short term count is hanging in the balance at the moment.
The price is still holding above the support level at 109.02,
so the alternate count has not been triggered just yet.
Although this action does heavily favor it now.
So,
I am open to a break of support and to confirm wave [c] of ‘2’ tomorrow.
If that happens,
the most likely target range for wave [c] to complete
will be between 108.60 at the 50% retracement level,
and 107.60 at the 62% retracement level.
You can see this better on the 4hr chart.
Tomorrow;
Watch for 109.02 to hold to save the current short term count.
If it breaks that will trigger the alternate wave [c] scenario.
[/vc_column_text][/vc_column][/vc_row]
[vc_row][vc_column][vc_separator border_width=”5″][/vc_column][/vc_row][vc_row][vc_column][vc_column_text]
DOW JONES INDUSTRIALS
[/vc_column_text][/vc_column][/vc_row][vc_row][vc_column][vc_separator border_width=”5″][/vc_column][/vc_row][vc_row][vc_column width=”2/3″][vc_custom_heading text=”1 hr” use_theme_fonts=”yes”][vc_column_text]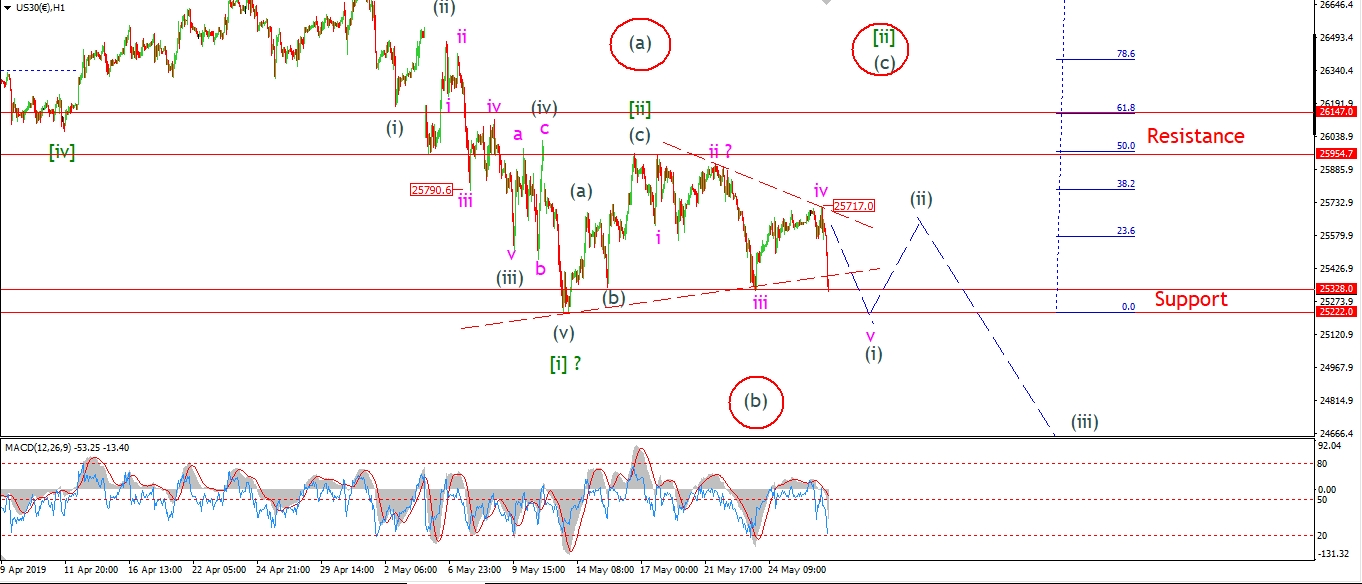 [/vc_column_text][/vc_column][vc_column width=”1/3″][vc_custom_heading text=”4 Hours” use_theme_fonts=”yes”][vc_column_text]
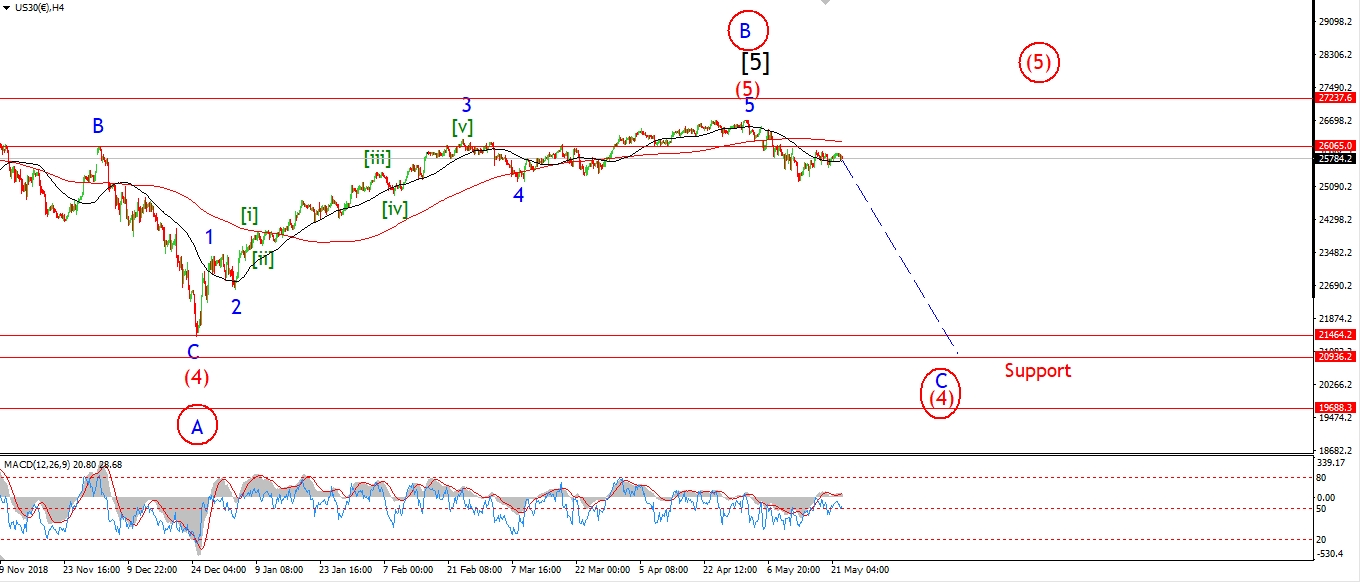 [/vc_column_text][vc_custom_heading text=”Daily” use_theme_fonts=”yes”][vc_column_text]
 [/vc_column_text][/vc_column][/vc_row]
[vc_row][vc_column][vc_column_text]
The DOW is selling off again as we approach the close this evening.
This action fits with the idea of an on-going wave (i) as shown.
The market did gap higher this morning and wave ‘iv’ broke the low of wave ‘i’.
With that action in mind,
wave (i) is now labelled as a leading diagonal rather than a normal impulse wave.
But wave ‘v’ of (i) should still carry lower and break 25328 again before completing the pattern.
If 25222 is broken tomorrow,
that will all but rule out the larger wave [ii] alternate count also.
And wacve [iii] down will be one step closer.
So the story is really starting to get interesting on the bearish side for the DOW this week.
Any correction higher from now on should be relatively short.
Tomorrow;
Watch for wave (i) to complete with a break of 25222.
Wave (ii) should complete by midweek if all goes to plan.
[/vc_column_text][/vc_column][/vc_row]
[vc_row][vc_column][vc_separator border_width=”5″][/vc_column][/vc_row][vc_row][vc_column][vc_column_text]
GOLD
[/vc_column_text][/vc_column][/vc_row][vc_row][vc_column][vc_separator border_width=”5″][/vc_column][/vc_row][vc_row][vc_column width=”2/3″][vc_custom_heading text=”1 hr” use_theme_fonts=”yes”][vc_column_text]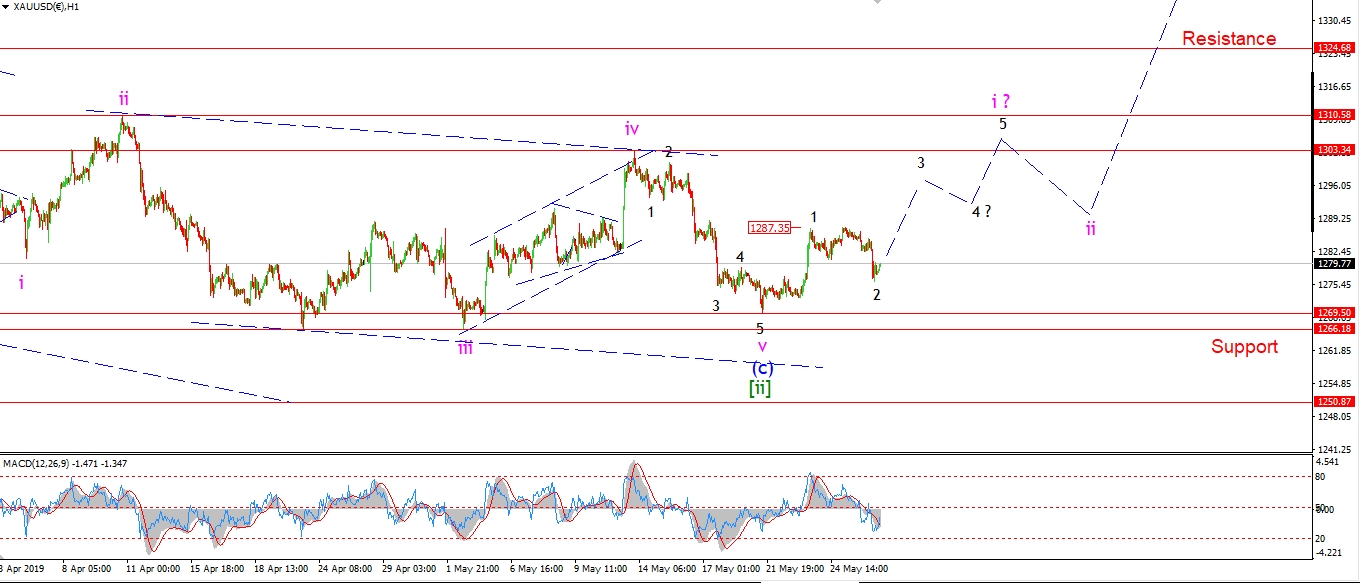 [/vc_column_text][/vc_column][vc_column width=”1/3″][vc_custom_heading text=”4 Hours” use_theme_fonts=”yes”][vc_column_text]
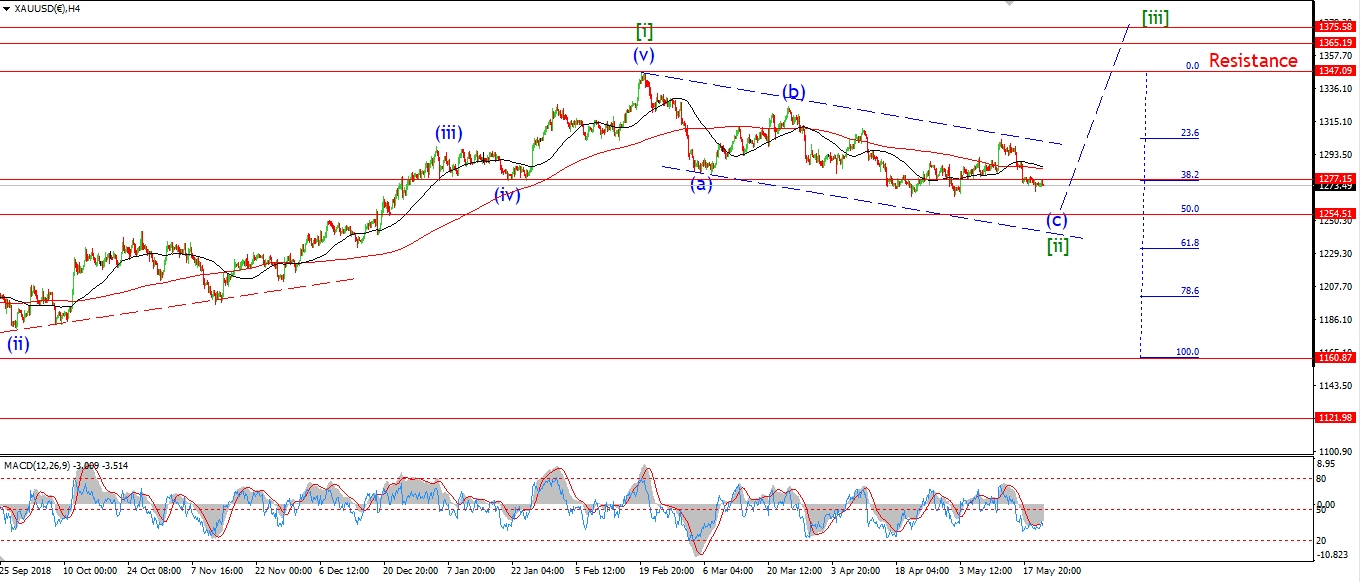 [/vc_column_text][vc_custom_heading text=”Daily” use_theme_fonts=”yes”][vc_column_text]
 [/vc_column_text][/vc_column][/vc_row]
[vc_row][vc_column][vc_column_text]
The decline in gold today can still be viewed as a correction in wave ‘i’.
If the price holds above 1275 tomorrow and rallies back above 1287 again,
that will confirm todays action as wave ‘2’ of ‘i’.
And then we can expect wave ‘i’ to complete in five waves,
and turn the focus higher again out of this extended corrective phase in wave [ii].
The key from here to confirm that the gold has bottomed,
is a five wave rally and a break of 1303 at the previous wave ‘iv’.
And if all goes to plan that should happen this week.
Tomorrow;
Watch for wave ‘i’ to continue higher for the rest of the week.
Price must hold above 1269.50 to remain bullish in the short term.
[/vc_column_text][/vc_column][/vc_row]
[vc_row][vc_column][vc_separator border_width=”5″][/vc_column][/vc_row][vc_row][vc_column][vc_column_text]
U.S CRUDE OIL
[/vc_column_text][/vc_column][/vc_row][vc_row][vc_column][vc_separator border_width=”5″][/vc_column][/vc_row][vc_row][vc_column width=”2/3″][vc_custom_heading text=”1 hr” use_theme_fonts=”yes”][vc_column_text]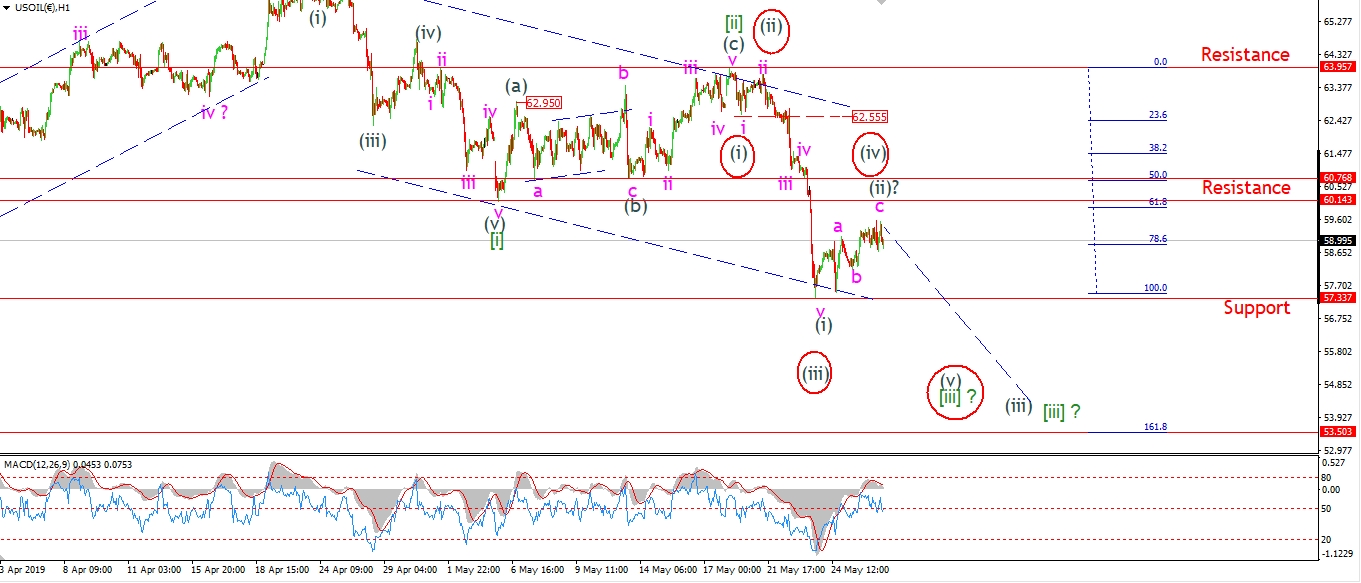 [/vc_column_text][/vc_column][vc_column width=”1/3″][vc_custom_heading text=”4 Hours” use_theme_fonts=”yes”][vc_column_text]
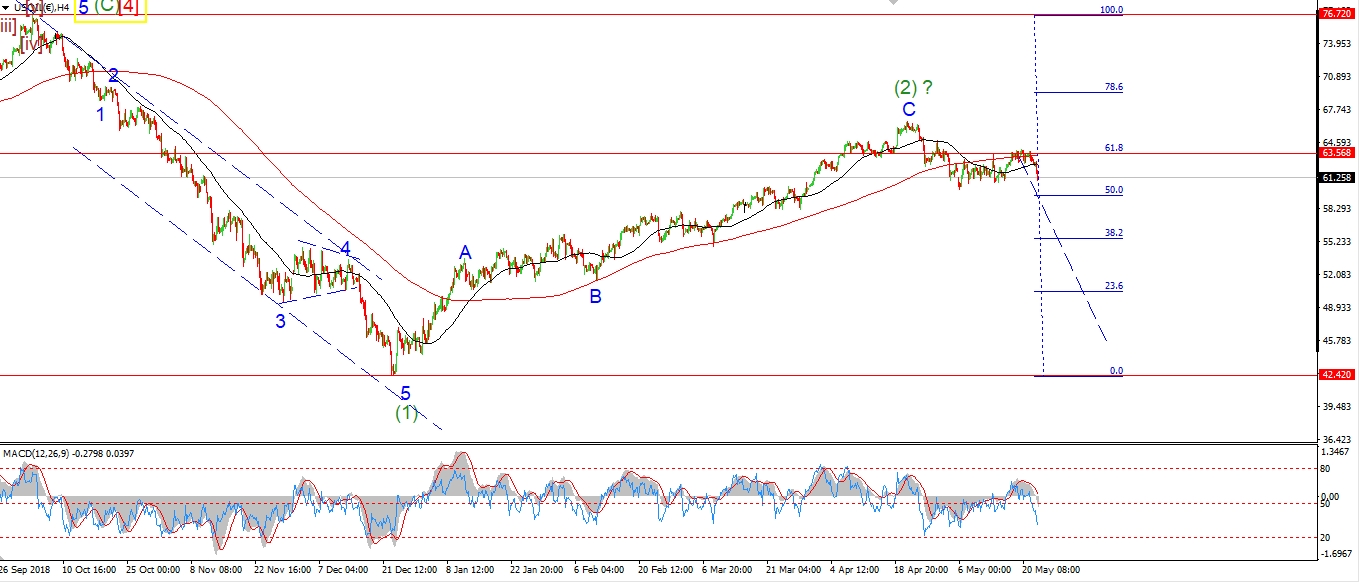 [/vc_column_text][vc_custom_heading text=”Daily” use_theme_fonts=”yes”][vc_column_text]
 [/vc_column_text][/vc_column][/vc_row]
[vc_row][vc_column][vc_column_text]
Crude is fairly flat today and the action fits with both the main wave count and the alternate count in red.
The market has risen in three waves off the recent low labelled wave (i).
And this can be viewed as wave (ii) or wave (iv).
Both wave count call for this corrective rise to complete soon,
and then a further decline to begin in either wave (iii) of [iii],
or wave (v) of [iii].
The main target for wave [iii] green lies at 53.50,
this is where wave [iii] reaches 162% of wave [i].
Wave [iii] should remain in force for at least the next week no matter which wave count is correct.
Tomorrow;
Watch for wave (ii) to complete below resistance at 60.14.
A break of 57.33 will signal that wave (iii) of [iii] has begun.
and this could lead to a continued decline into the target at 53.50.
[/vc_column_text][/vc_column][/vc_row]
[vc_row][vc_column][vc_separator border_width=”5″][/vc_column][/vc_row][vc_row][vc_column][vc_column_text]
US 10 yr Treasuries.
[/vc_column_text][/vc_column][/vc_row][vc_row][vc_column][vc_separator border_width=”5″][/vc_column][/vc_row][vc_row][vc_column width=”2/3″][vc_custom_heading text=”1 hr” use_theme_fonts=”yes”][vc_column_text]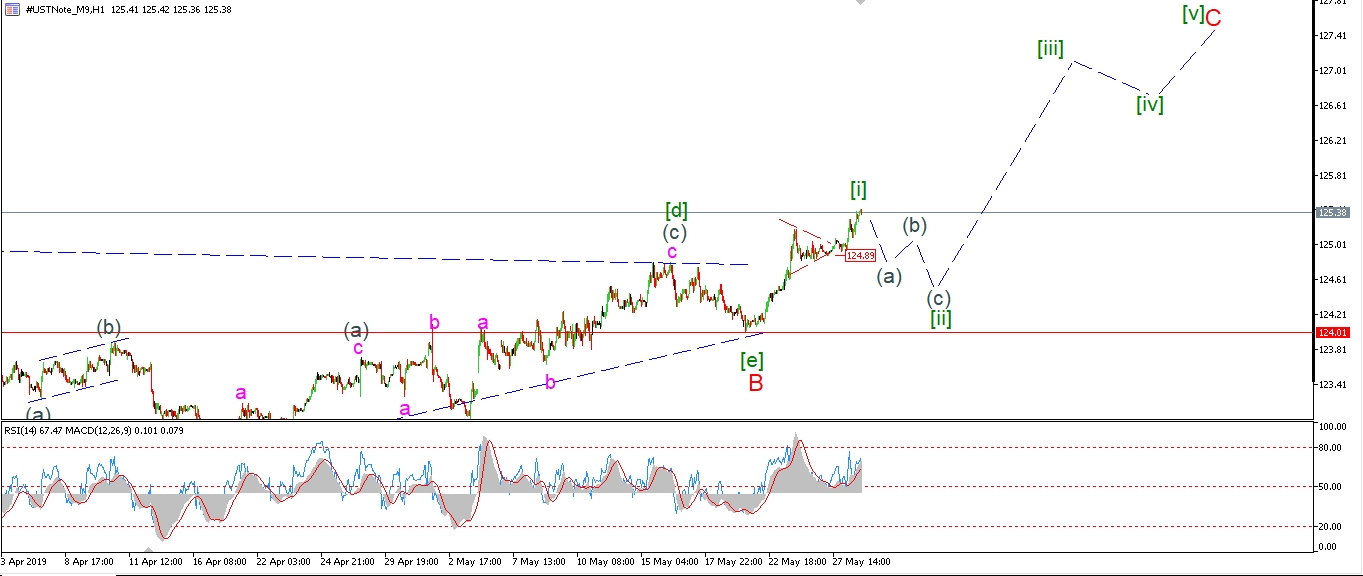 [/vc_column_text][/vc_column][vc_column width=”1/3″][vc_custom_heading text=”4 Hours” use_theme_fonts=”yes”][vc_column_text]
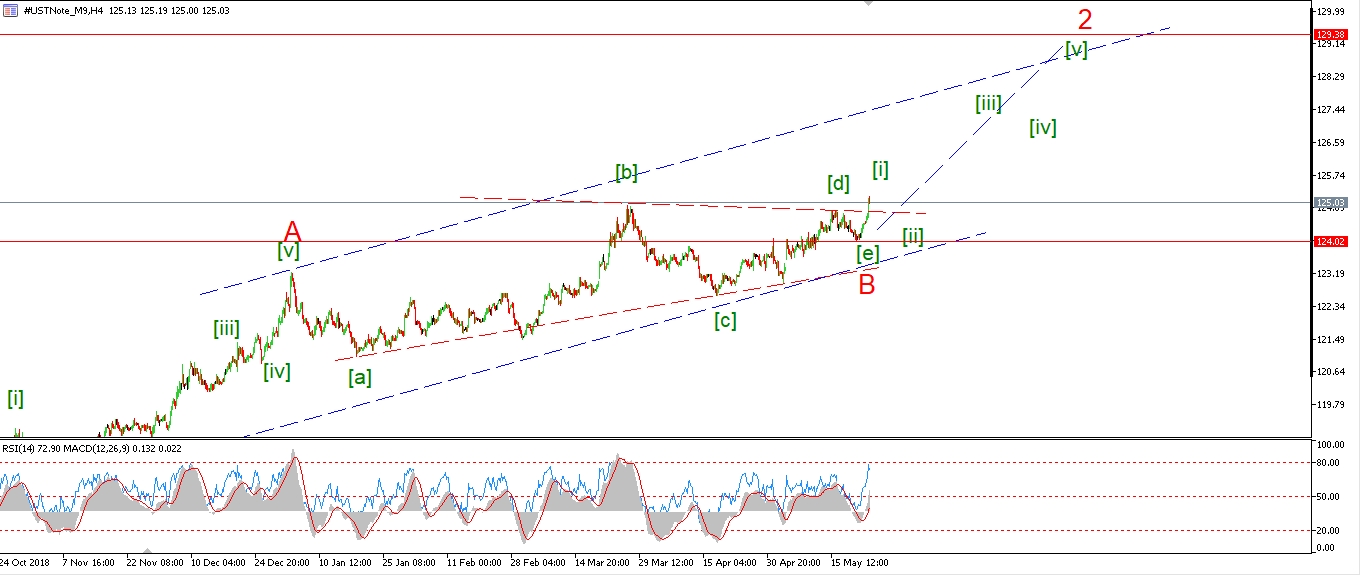 [/vc_column_text][vc_custom_heading text=”Daily” use_theme_fonts=”yes”][vc_column_text]
 [/vc_column_text][/vc_column][/vc_row]
[vc_row][vc_column][vc_column_text]
The sideways move late last week in the 10YR,
was most likely a fourth wave triangle within wave [i] as shown.
The market should correct in a clear three wave form
to a higher low above 124.01 over the coming week.
This will complete an impulse wave off the wave ‘B’ low,
and then setup the market for another rally towards 127.00 in wave [iii] green.
Tomorrow;
When that three wave correction completes in wave [ii] I will have a better idea for the potential for wave ‘C’ overall.
Watch for wave [ii] to begin with a break of 124.90.
[/vc_column_text][/vc_column][/vc_row]
[vc_row][vc_column][vc_separator border_width=”5″][/vc_column][/vc_row][vc_row][vc_column][vc_column_text]
SILVER
[/vc_column_text][/vc_column][/vc_row][vc_row][vc_column][vc_separator border_width=”5″][/vc_column][/vc_row][vc_row][vc_column width=”2/3″][vc_custom_heading text=”1 hr” use_theme_fonts=”yes”][vc_column_text]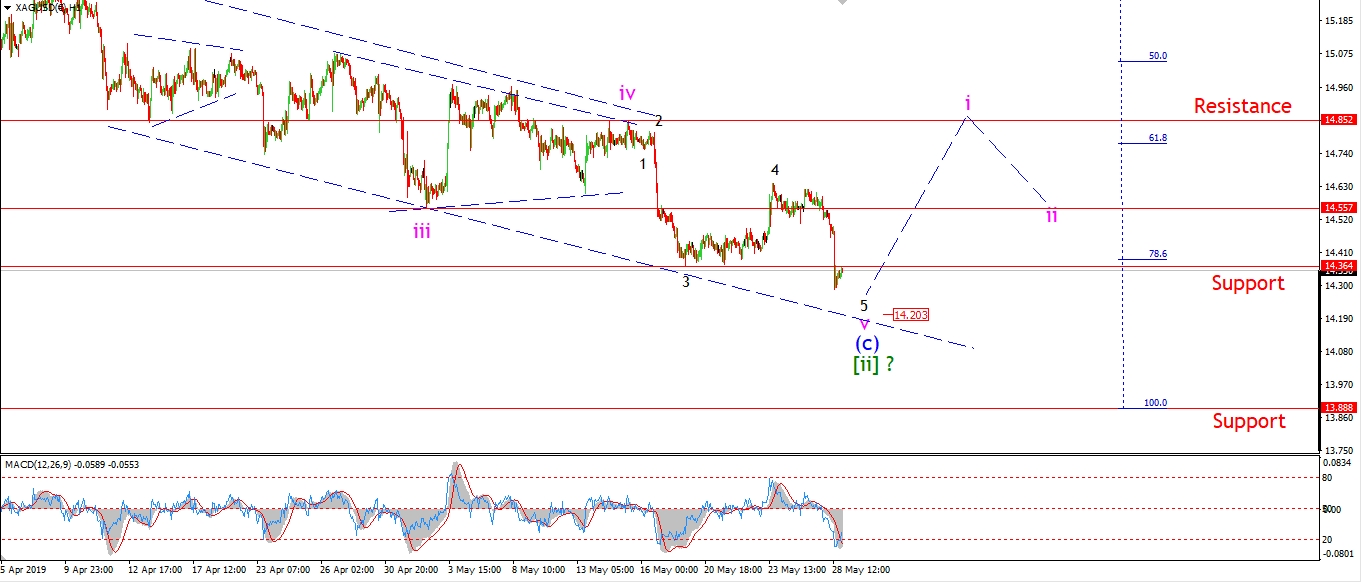 [/vc_column_text][/vc_column][vc_column width=”1/3″][vc_custom_heading text=”4 Hours” use_theme_fonts=”yes”][vc_column_text]
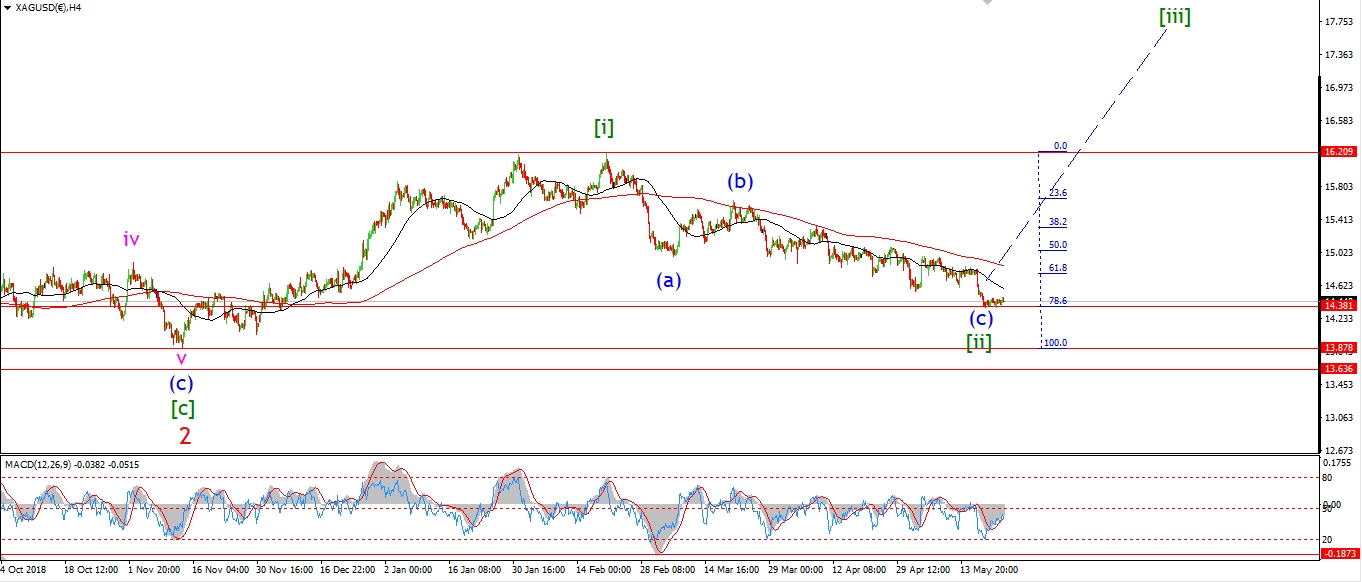 [/vc_column_text][vc_custom_heading text=”Daily” use_theme_fonts=”yes”][vc_column_text]
 [/vc_column_text][/vc_column][/vc_row]
[vc_row][vc_column][vc_column_text]
Silver reached a high above $49 at the top of wave (A) in May 2011.
The bearmarket began at that top and has raged for the last eight years.
The price of Silver fell 73% into the lows of 2016 at wave (B).
And we are now back at the low end of the range again in wave [ii] almost three years later!
The general public believe that Silver will never rally again.
And the best we can expect is the odd bounce above $15
before the next long decline begins!
The thing is,
‘public opinion’ is always wrong when it counts the most.
And we are at one of those occasions now,
where everyone is wrong, at the wrong time.
The wave count in silver shows a correction that is now playing out its last move.
Wave [ii] should put in a significant low this week,
and the next five wave move higher will signal a larger sea change is getting underway.
Patience is key now.
The signal will come.
Tomorrow;
Watch for price to hit the lower trend line at about 14.20
before turning higher again in wave ‘i’ of (i) of [iii].
[/vc_column_text][/vc_column][/vc_row]
[vc_row][vc_column][vc_separator border_width=”5″][/vc_column][/vc_row][vc_row][vc_column][vc_column_text]
S&P 500.
[/vc_column_text][/vc_column][/vc_row][vc_row][vc_column][vc_separator border_width=”5″][/vc_column][/vc_row][vc_row][vc_column width=”2/3″][vc_custom_heading text=”1 hr” use_theme_fonts=”yes”][vc_column_text]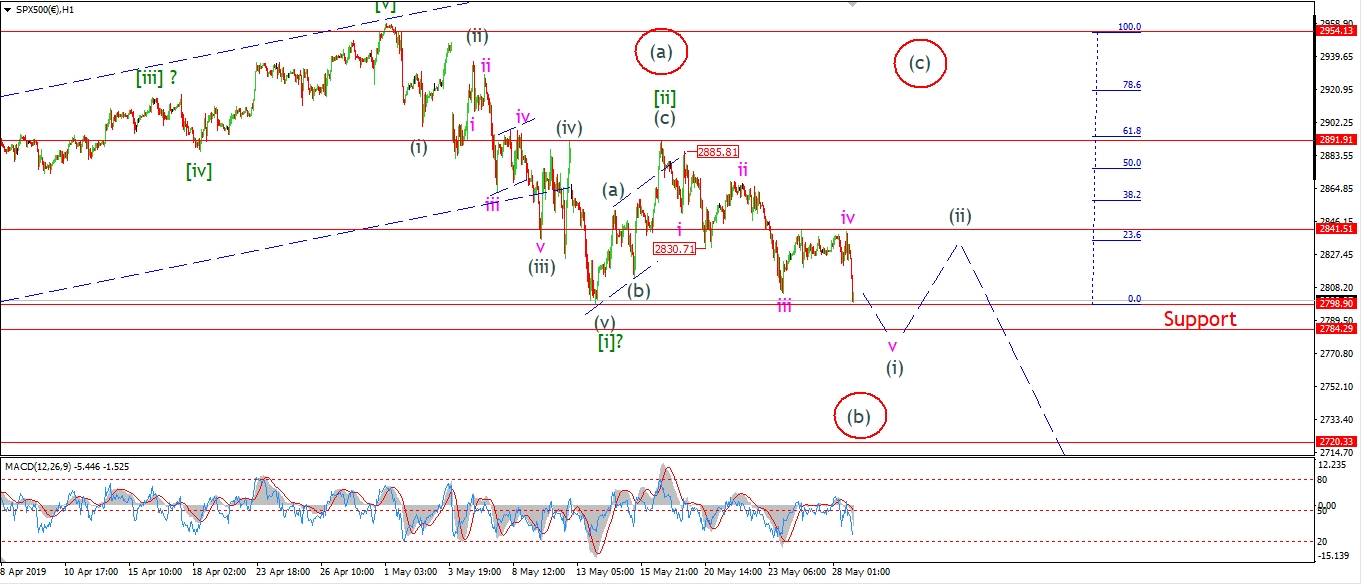 [/vc_column_text][/vc_column][vc_column width=”1/3″][vc_custom_heading text=”4 Hours” use_theme_fonts=”yes”][vc_column_text]
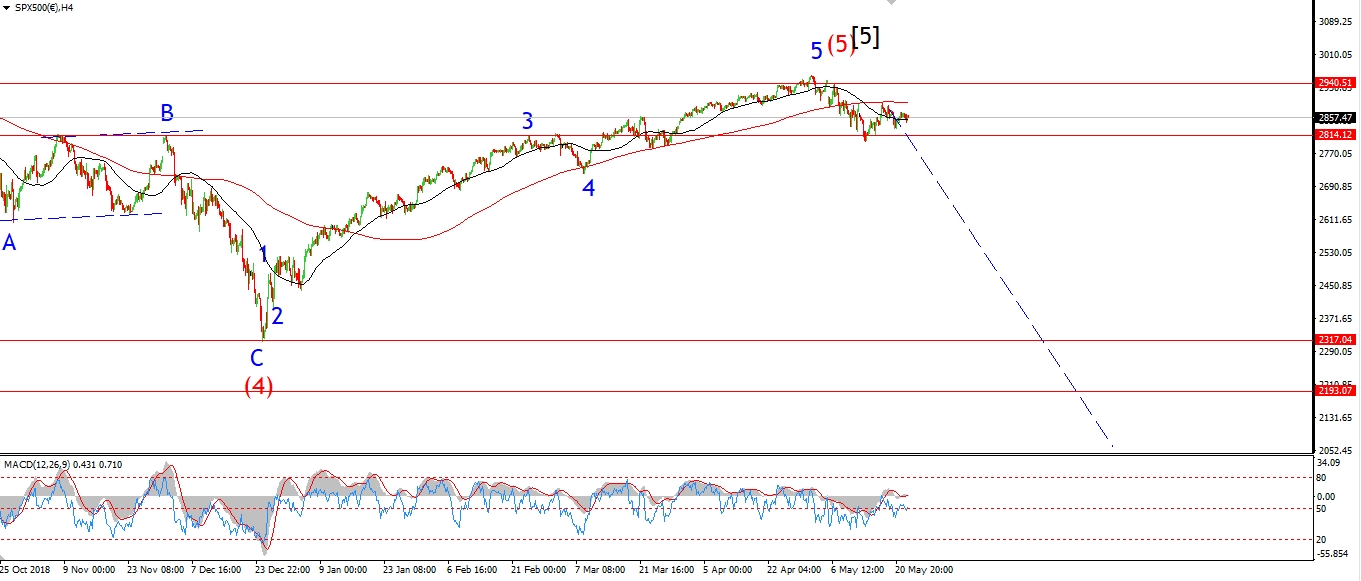 [/vc_column_text][vc_custom_heading text=”Daily” use_theme_fonts=”yes”][vc_column_text]
 [/vc_column_text][/vc_column][/vc_row]
[vc_row][vc_column][vc_column_text]
The alternate count for the S&P is now looking quite unlikely
after this evenings continued selloff into wave ‘v’ of (i).
Price has not yet broken support at 2708,
but I expect that to happen early tomorrow as wave (i) completes.
When wave (i) down completes,
wave (ii) should then correct higher over the coming days to complete another bearish lower high.
The most likely target for wave (ii) lies in the area of the previous fourth wave at 2841.
This action is now heavily favoring the bearish scenario.
And there is a very real possibility now,
for a sharp move lower in a third of a third wave over the coming weeks.
When wave (ii) completes,
the probability for this outcome will be at it’s highest.
Tomorrow;
Watch for wave (i) to complete with a break of 2798 again.
Wave (ii) should begin by tomorrow evening.
[/vc_column_text][/vc_column][/vc_row]
[vc_row][vc_column][vc_column_text]
[/vc_column_text][/vc_column][/vc_row]
[vc_row][vc_column][vc_separator border_width=”5″][/vc_column][/vc_row]