
[vc_row][vc_column][vc_separator border_width=”5″][/vc_column][/vc_row]
[vc_row][vc_column][vc_column_text]
Hello everyone.
[/vc_column_text][/vc_column][/vc_row]
[vc_row][vc_column][vc_separator border_width=”5″][/vc_column][/vc_row]
[vc_row][vc_column][vc_column_text]
EURUSD
[/vc_column_text][/vc_column][/vc_row]
[vc_row][vc_column][vc_separator border_width=”5″][/vc_column][/vc_row][vc_row][vc_column width=”2/3″][vc_custom_heading text=”1 hr” use_theme_fonts=”yes”][vc_column_text]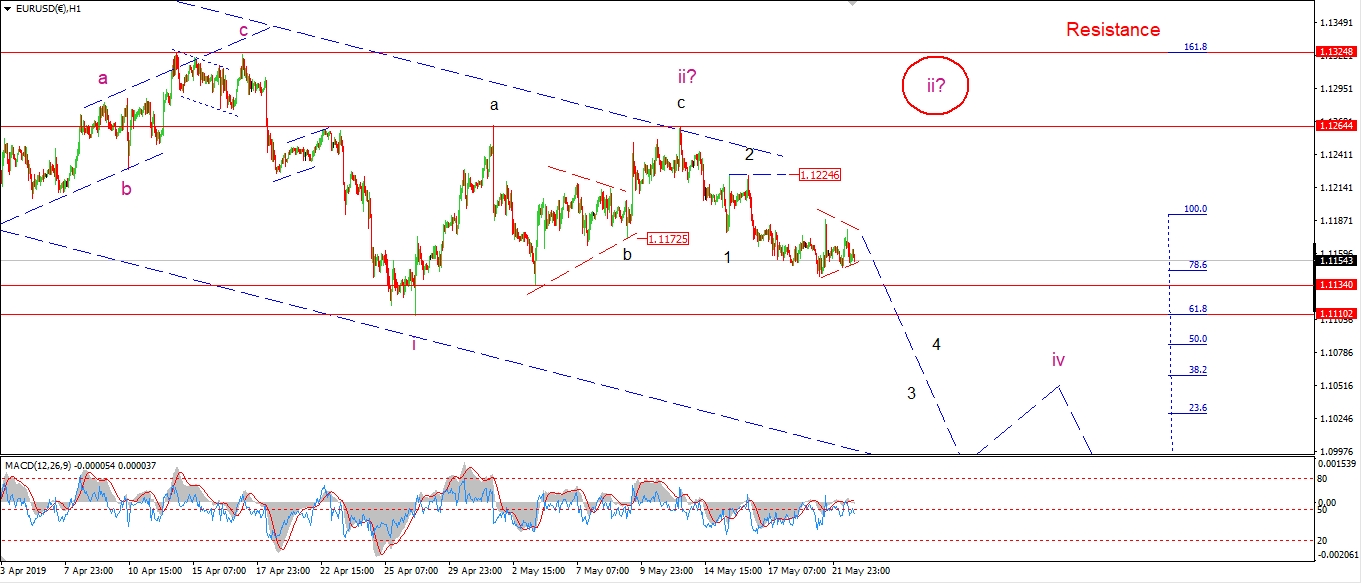 [/vc_column_text][/vc_column][vc_column width=”1/3″][vc_custom_heading text=”4 Hours” use_theme_fonts=”yes”][vc_column_text]
 [/vc_column_text][vc_custom_heading text=”Daily” use_theme_fonts=”yes”][vc_column_text]
 [/vc_column_text][/vc_column][/vc_row]
[vc_row][vc_column][vc_column_text]
EURUSD has held above support for another day.
The action is quite corrective looking at the moment,
and the price range has contracted over the last few sessions.
This suggest either a running flat,
or a developing triangle at a minor degree within wave ‘iii’.
Either way this correction should complete below 1.1224 and then continue lower in wave ‘iii’.
Tomorrow;
Watch for wave ‘3’ of ‘iii’ to break through 1.1110 and confirm the larger pattern.
[/vc_column_text][/vc_column][/vc_row]
[vc_row][vc_column][vc_separator border_width=”5″][/vc_column][/vc_row][vc_row][vc_column][vc_column_text]
GBPUSD
[/vc_column_text][/vc_column][/vc_row][vc_row][vc_column][vc_separator border_width=”5″][/vc_column][/vc_row][vc_row][vc_column width=”2/3″][vc_custom_heading text=”1 hr” use_theme_fonts=”yes”][vc_column_text]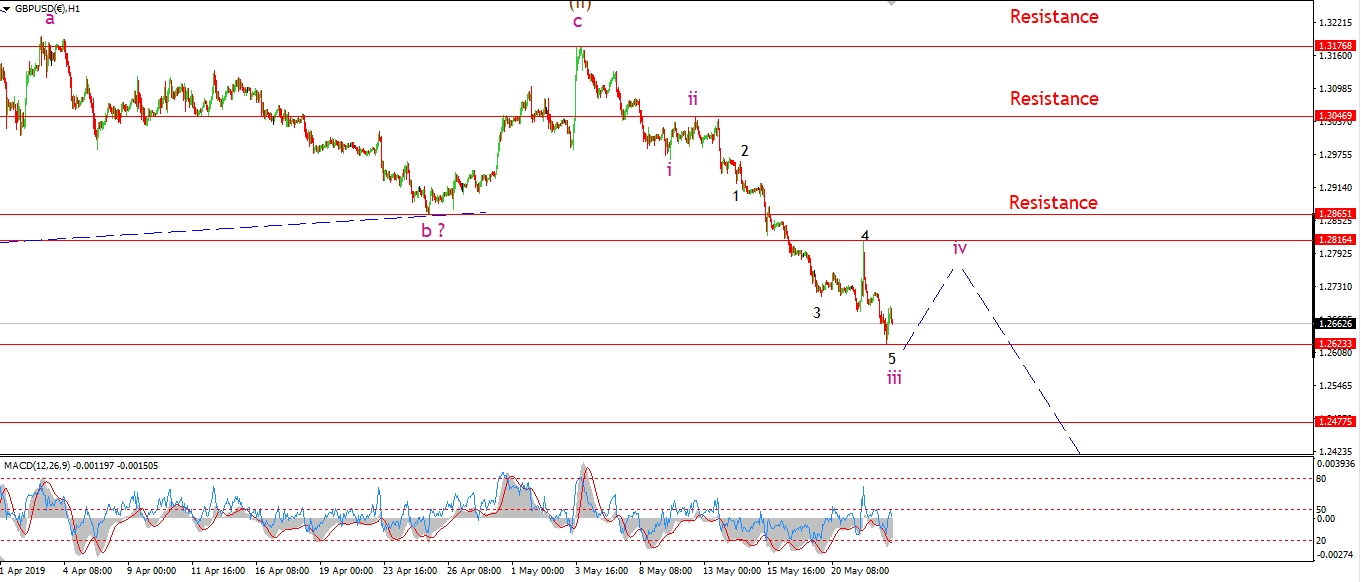 [/vc_column_text][/vc_column][vc_column width=”1/3″][vc_custom_heading text=”4 Hours” use_theme_fonts=”yes”][vc_column_text]
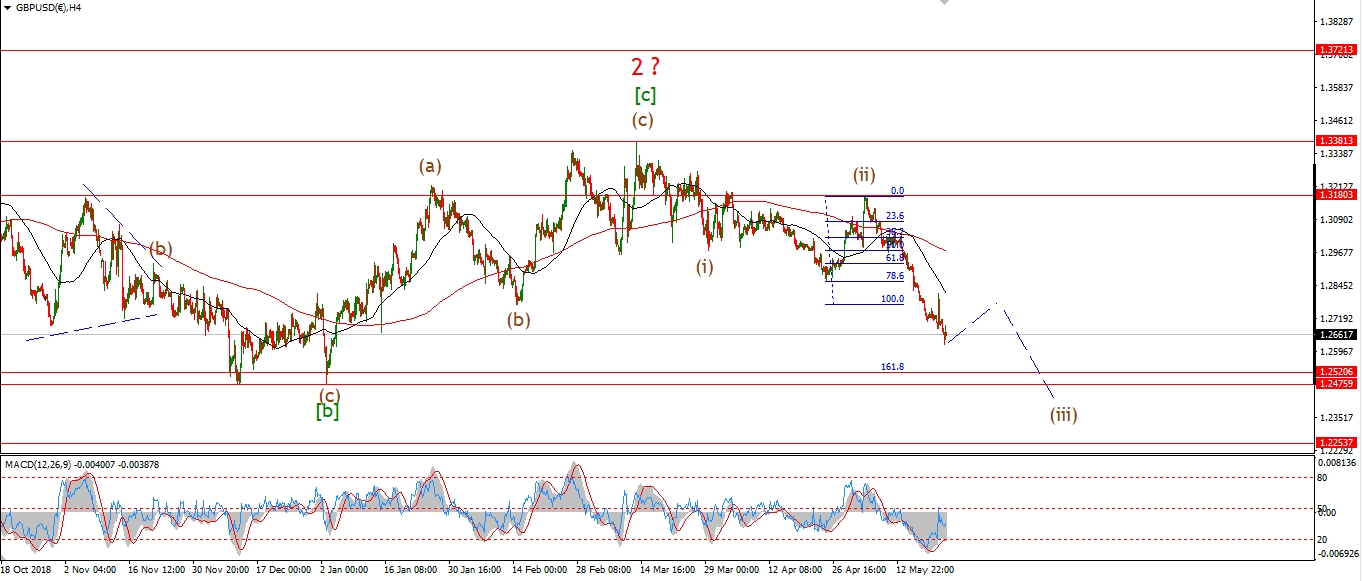 [/vc_column_text][vc_custom_heading text=”Daily” use_theme_fonts=”yes”][vc_column_text]
 [/vc_column_text][/vc_column][/vc_row]
[vc_row][vc_column][vc_column_text]
We were looking for that final dip into wave ‘5’ of ‘iii’ and today it seems we have it in place.
Cable is now down 550pips off the wave (ii) high.
And I think the time is coming for a corrective recovery in wave ‘iv’
which should stem the losses for a week or so
as the price ranges in a corrective pattern before falling in wave ‘v’ to complete wave (iii).
On the 4hr chart,
the ideal target for wave (iii) lies at 1.2520 where wave (iii) reaches 162% of wave (i).
I would like to see a break of support at 1.2475 at wave [b].
We will have to wait and see on that front.
Tomorrow;
Watch for wave ‘iii’ to find a low and wave ‘iv’ to begin.
The initial target for wave ‘iv’ lies at 1.2816.
[/vc_column_text][/vc_column][/vc_row]
[vc_row][vc_column][vc_separator border_width=”5″][/vc_column][/vc_row][vc_row][vc_column][vc_column_text]
USDJPY
[/vc_column_text][/vc_column][/vc_row][vc_row][vc_column][vc_separator border_width=”5″][/vc_column][/vc_row][vc_row][vc_column width=”2/3″][vc_custom_heading text=”1 hr” use_theme_fonts=”yes”][vc_column_text] [/vc_column_text][/vc_column][vc_column width=”1/3″][vc_custom_heading text=”4 Hours” use_theme_fonts=”yes”][vc_column_text]
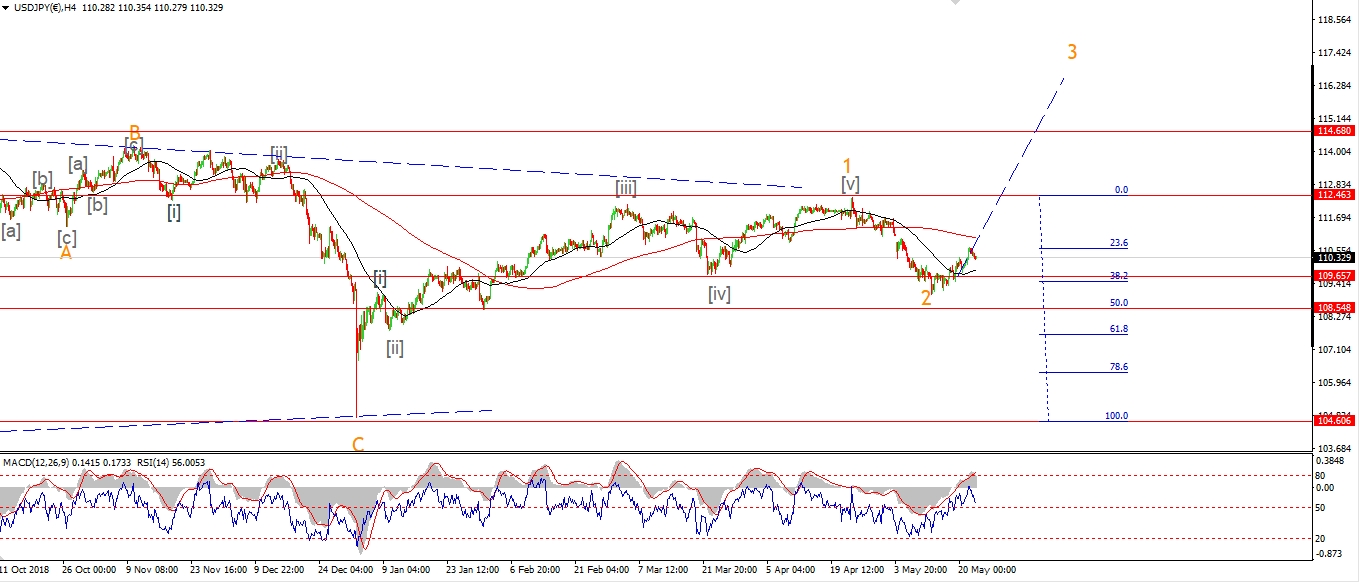 [/vc_column_text][vc_custom_heading text=”Daily” use_theme_fonts=”yes”][vc_column_text]
 [/vc_column_text][/vc_column][/vc_row]
[vc_row][vc_column][vc_column_text]
USDJPY has corrected lower today which complicates the short term pattern slightly.
The action is corrective,
so this is likely a subdivision of wave ‘iii’ as shown.
Possibly another 1,2 pattern to begin wave ‘iii’ of (iii).
In this case 109.75 should hold as wave ‘iii’ continues to develop.
Tomorrow;
Watch for wave ‘2’ to complete above 109.75 and wave ‘3’ of ‘iii’ to push back towards the upper trend channel line again.
[/vc_column_text][/vc_column][/vc_row]
[vc_row][vc_column][vc_separator border_width=”5″][/vc_column][/vc_row][vc_row][vc_column][vc_column_text]
DOW JONES INDUSTRIALS
[/vc_column_text][/vc_column][/vc_row][vc_row][vc_column][vc_separator border_width=”5″][/vc_column][/vc_row][vc_row][vc_column width=”2/3″][vc_custom_heading text=”1 hr” use_theme_fonts=”yes”][vc_column_text]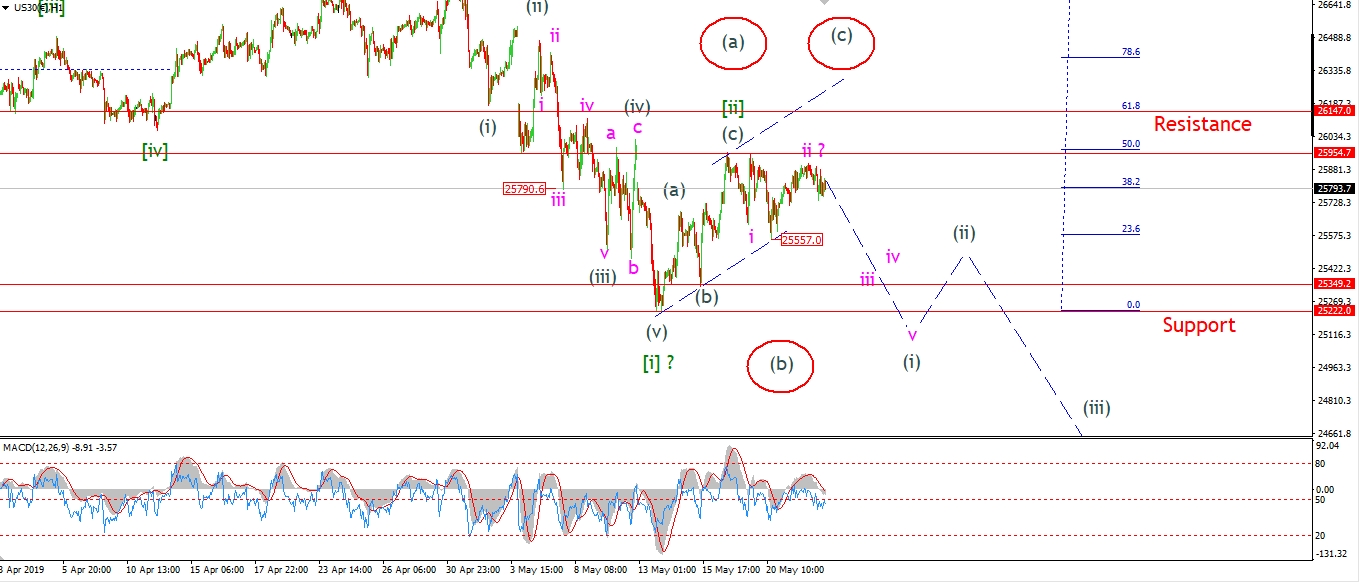 [/vc_column_text][/vc_column][vc_column width=”1/3″][vc_custom_heading text=”4 Hours” use_theme_fonts=”yes”][vc_column_text]
 [/vc_column_text][vc_custom_heading text=”Daily” use_theme_fonts=”yes”][vc_column_text]
 [/vc_column_text][/vc_column][/vc_row]
[vc_row][vc_column][vc_column_text]
The DOW is back off the wave ‘ii’ high today,
although this decline has not developed impulsively just yet in wave ‘iii’.
I am holding with the immediately bearish outlook for the moment as the potential exists for a large and sudden drop in wave ‘iii’.
Only a break of 25954 will trigger the alternate scenario for wave [ii].
And then we will have to wait another week or so for wave [iii] down to begin.
I have labelled the current action as waves ‘i’ and ‘ii’ of (i).
Where wave ‘ii’ is a running flat correction.
And ‘iii’ will be confirmed with a break of 25557.
Tomorrow;
Watch for 25954 to hold,
to rule out the alternate count.
and then a further decline to begin in wave ‘iii’ of (i).
[/vc_column_text][/vc_column][/vc_row]
[vc_row][vc_column][vc_separator border_width=”5″][/vc_column][/vc_row][vc_row][vc_column][vc_column_text]
GOLD
[/vc_column_text][/vc_column][/vc_row][vc_row][vc_column][vc_separator border_width=”5″][/vc_column][/vc_row][vc_row][vc_column width=”2/3″][vc_custom_heading text=”1 hr” use_theme_fonts=”yes”][vc_column_text]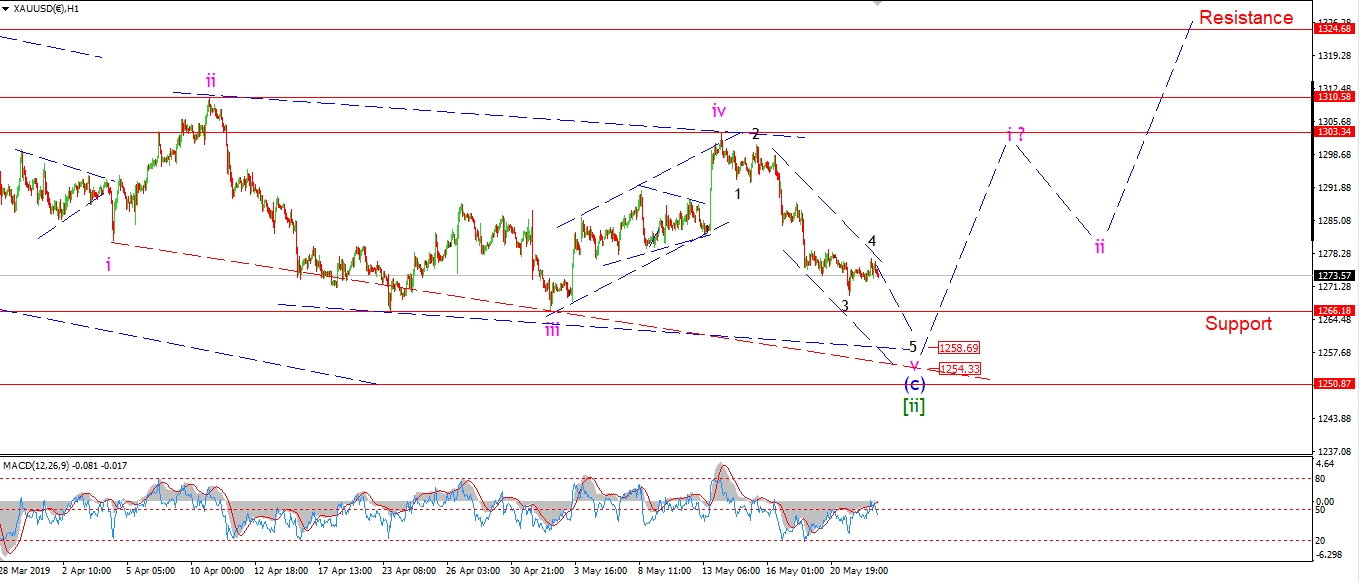 [/vc_column_text][/vc_column][vc_column width=”1/3″][vc_custom_heading text=”4 Hours” use_theme_fonts=”yes”][vc_column_text]
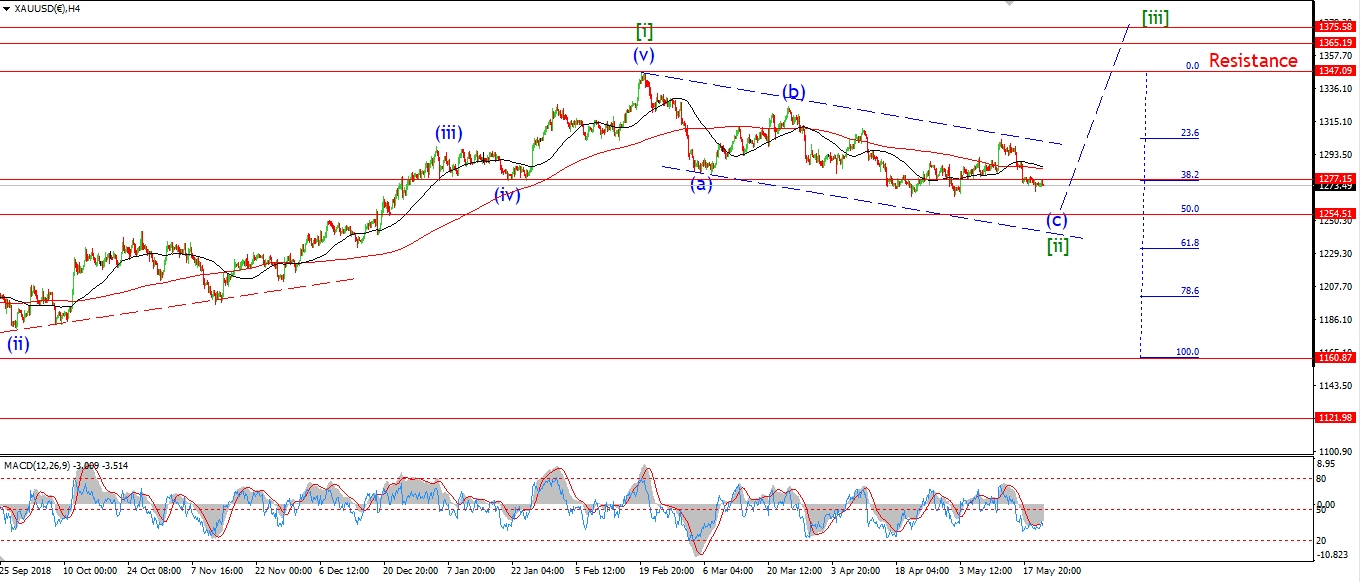 [/vc_column_text][vc_custom_heading text=”Daily” use_theme_fonts=”yes”][vc_column_text]
 [/vc_column_text][/vc_column][/vc_row]
[vc_row][vc_column][vc_column_text]
GOLD has again corrected in a small three wave move to the upside today.
The move is labelled as wave ‘4’ of ‘v’ of (c).
Wave ‘5’ of ‘v’ should now carry the price below support again at 1266.
this is the minimum target for wave ‘v’.
Trend line support shown in red gives us a low at about 1254 for wave ‘v’.
And the trend channel line gives a target for wave ‘v’ at 1258.
Tomorrow;
Watch for wave ‘5’ of ‘v’ to complete with a break of support at 1266.
[/vc_column_text][/vc_column][/vc_row]
[vc_row][vc_column][vc_separator border_width=”5″][/vc_column][/vc_row][vc_row][vc_column][vc_column_text]
U.S CRUDE OIL
[/vc_column_text][/vc_column][/vc_row][vc_row][vc_column][vc_separator border_width=”5″][/vc_column][/vc_row][vc_row][vc_column width=”2/3″][vc_custom_heading text=”1 hr” use_theme_fonts=”yes”][vc_column_text]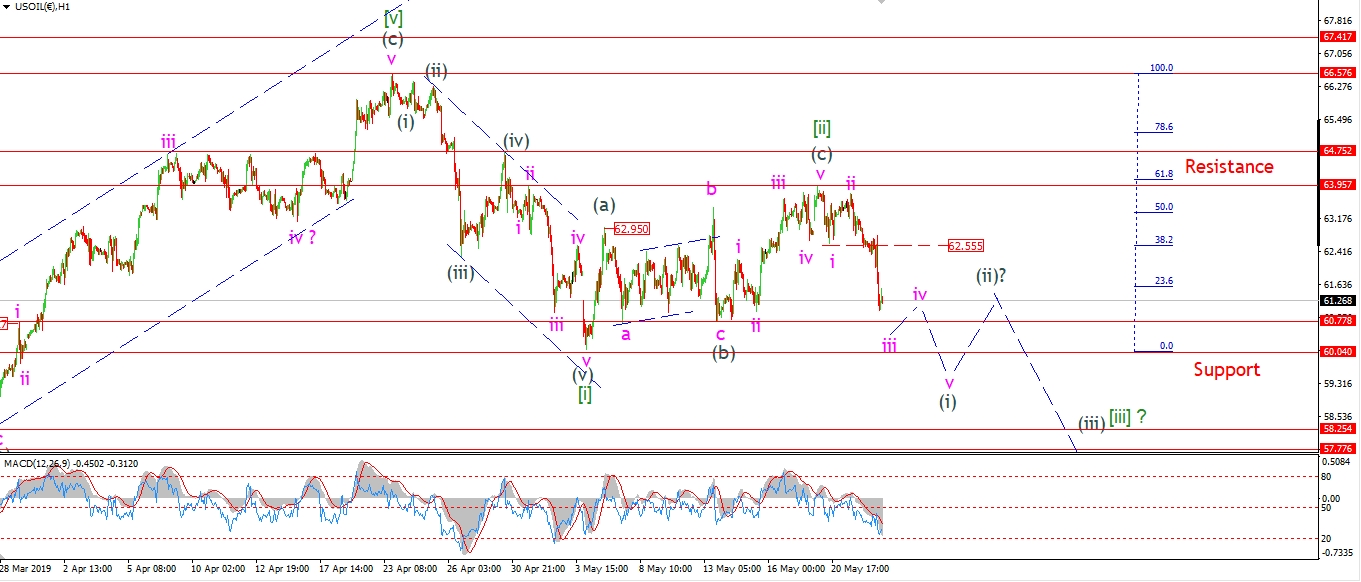 [/vc_column_text][/vc_column][vc_column width=”1/3″][vc_custom_heading text=”4 Hours” use_theme_fonts=”yes”][vc_column_text]
 [/vc_column_text][vc_custom_heading text=”Daily” use_theme_fonts=”yes”][vc_column_text]
 [/vc_column_text][/vc_column][/vc_row]
[vc_row][vc_column][vc_column_text]
Crude is again leading the way down for the market as happened last year.
This is another reason that I am sticking with the bearish count for the stock market at the moment.
the wave count called for a drop in a third wave to get wave (i) underway.
And we were not disappointed.
Wave ‘iii’ has carried the price back towards initial support at wave (b).
And wave ‘iii’ is not yet complete.
A break of that wave (b) support at 60.77
should be enough to confirm the larger bearish outlook for a decline into wave [iii].
Tomorrow;
Watch for wave (i) to continue to develop lower.
Wave ‘iv’ of (i) should not break above the wave ‘i’ low at 62.55.
And wave ‘v’ is expected to break support at 60.04.
[/vc_column_text][/vc_column][/vc_row]
[vc_row][vc_column][vc_separator border_width=”5″][/vc_column][/vc_row][vc_row][vc_column][vc_column_text]
US 10 yr Treasuries.
[/vc_column_text][/vc_column][/vc_row][vc_row][vc_column][vc_separator border_width=”5″][/vc_column][/vc_row][vc_row][vc_column width=”2/3″][vc_custom_heading text=”1 hr” use_theme_fonts=”yes”][vc_column_text]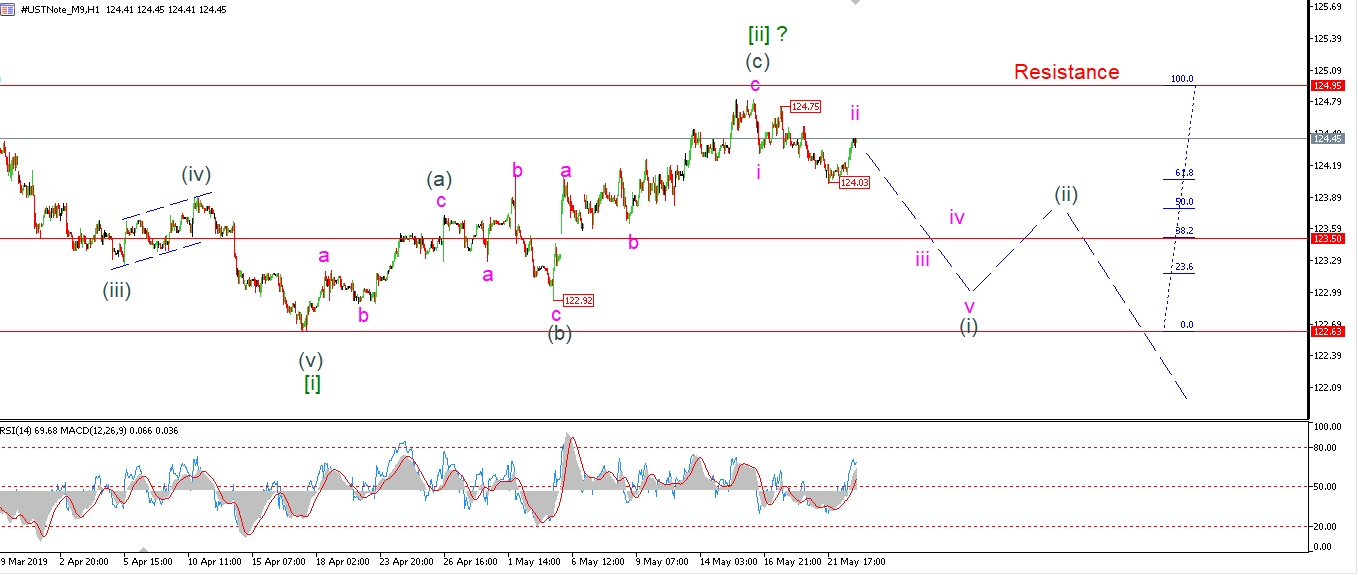 [/vc_column_text][/vc_column][vc_column width=”1/3″][vc_custom_heading text=”4 Hours” use_theme_fonts=”yes”][vc_column_text]
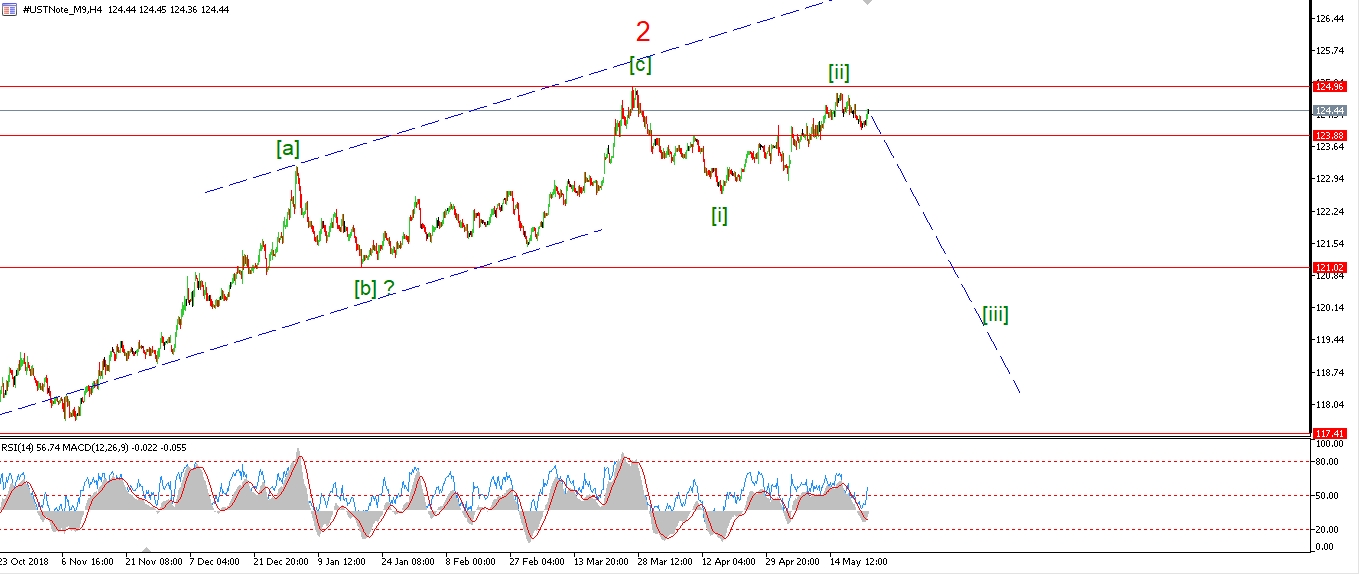 [/vc_column_text][vc_custom_heading text=”Daily” use_theme_fonts=”yes”][vc_column_text]
 [/vc_column_text][/vc_column][/vc_row]
[vc_row][vc_column][vc_column_text]
I have shown a possible running flat pattern in play for wave ‘ii’ pink today.
The rally off Tuesdays lows has ruled out the idea that wave ‘iii’ down is underway yet.
A further drop below 124.00 again will confirm that wave ‘iii’ of (i) has begun.
tomorrow;
Watch for wave ‘ii’ to complete below 124.75 and wave ‘iii’ down to begin.
[/vc_column_text][/vc_column][/vc_row]
[vc_row][vc_column][vc_separator border_width=”5″][/vc_column][/vc_row][vc_row][vc_column][vc_column_text]
SILVER
[/vc_column_text][/vc_column][/vc_row][vc_row][vc_column][vc_separator border_width=”5″][/vc_column][/vc_row][vc_row][vc_column width=”2/3″][vc_custom_heading text=”1 hr” use_theme_fonts=”yes”][vc_column_text]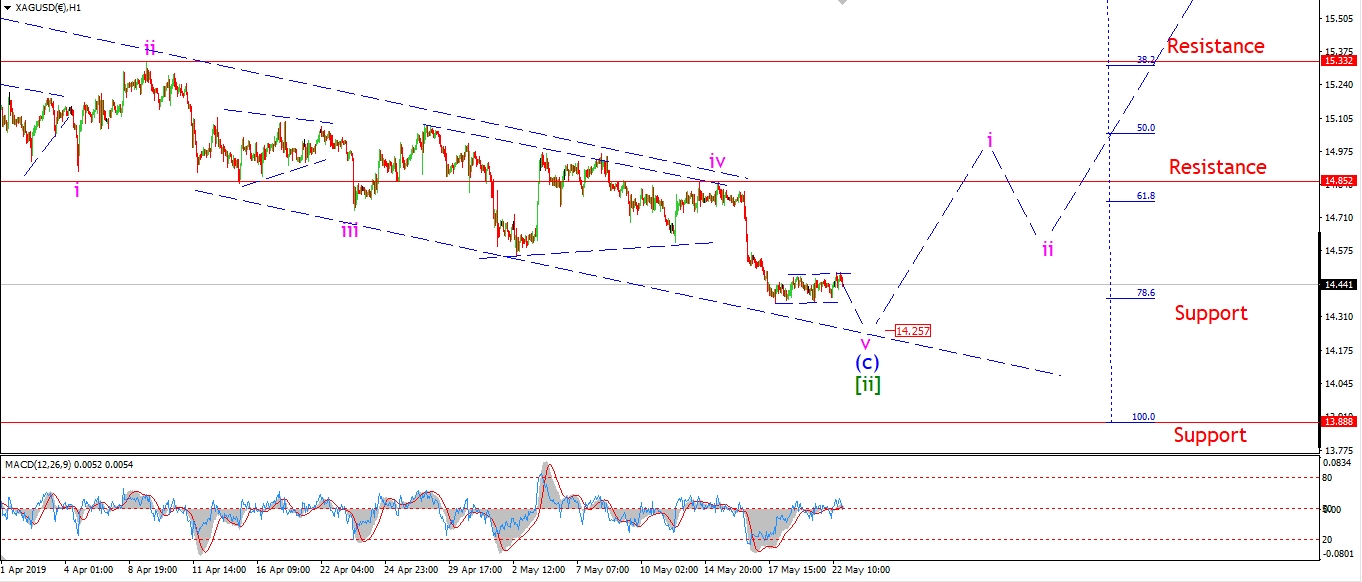 [/vc_column_text][/vc_column][vc_column width=”1/3″][vc_custom_heading text=”4 Hours” use_theme_fonts=”yes”][vc_column_text]
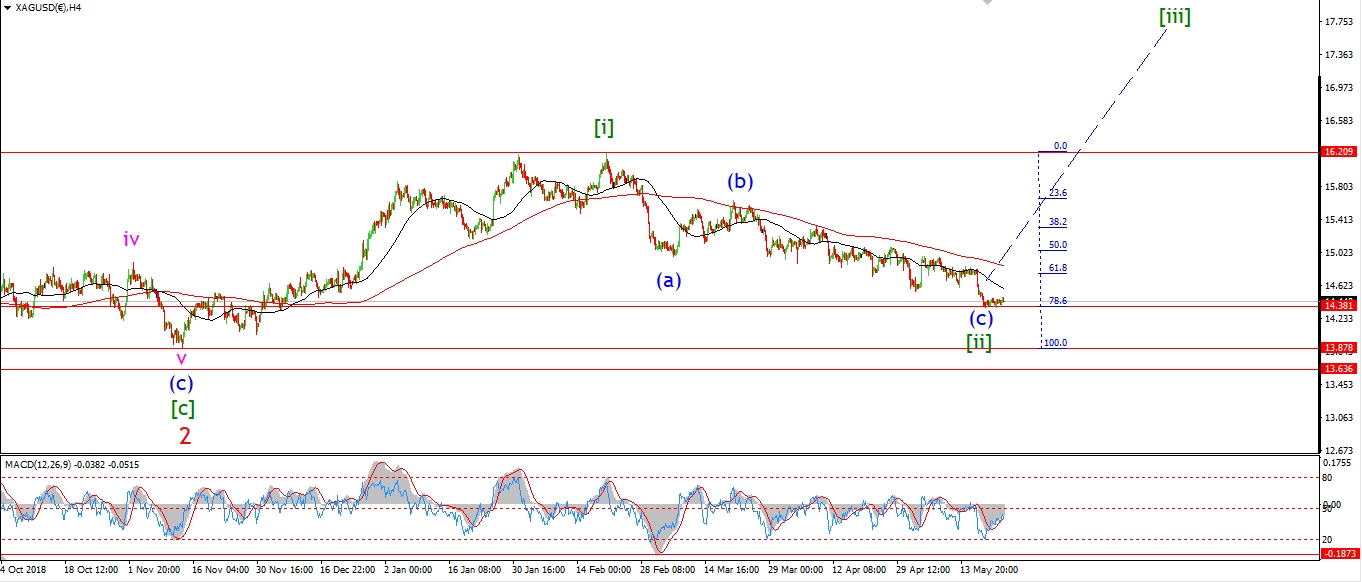 [/vc_column_text][vc_custom_heading text=”Daily” use_theme_fonts=”yes”][vc_column_text]
 [/vc_column_text][/vc_column][/vc_row]
[vc_row][vc_column][vc_column_text]
This sideways correction within wave ‘v’ is taking its time to complete.
This is most likely a small fourth wave within wave ‘v’.
And it suggests another drop into the lower trend line again at 14.25 to complete.
Wave ‘v’ and wave (c) should be done by the end of this week.
And we should see the initial move higher in wave ‘i’ by the end of Fridays session.
Tomorrow;
Watch for wave ‘v’ to push lower again for one last low to complete the larger pattern.
[/vc_column_text][/vc_column][/vc_row]
[vc_row][vc_column][vc_separator border_width=”5″][/vc_column][/vc_row][vc_row][vc_column][vc_column_text]
S&P 500.
[/vc_column_text][/vc_column][/vc_row][vc_row][vc_column][vc_separator border_width=”5″][/vc_column][/vc_row][vc_row][vc_column width=”2/3″][vc_custom_heading text=”1 hr” use_theme_fonts=”yes”][vc_column_text]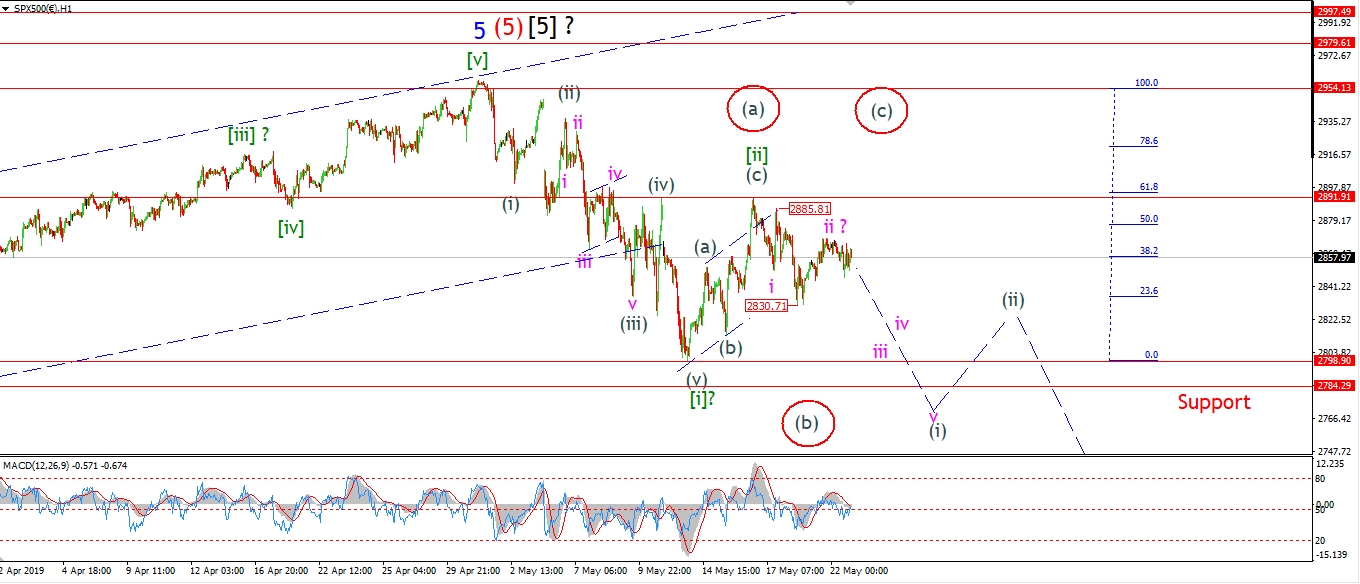 [/vc_column_text][/vc_column][vc_column width=”1/3″][vc_custom_heading text=”4 Hours” use_theme_fonts=”yes”][vc_column_text]
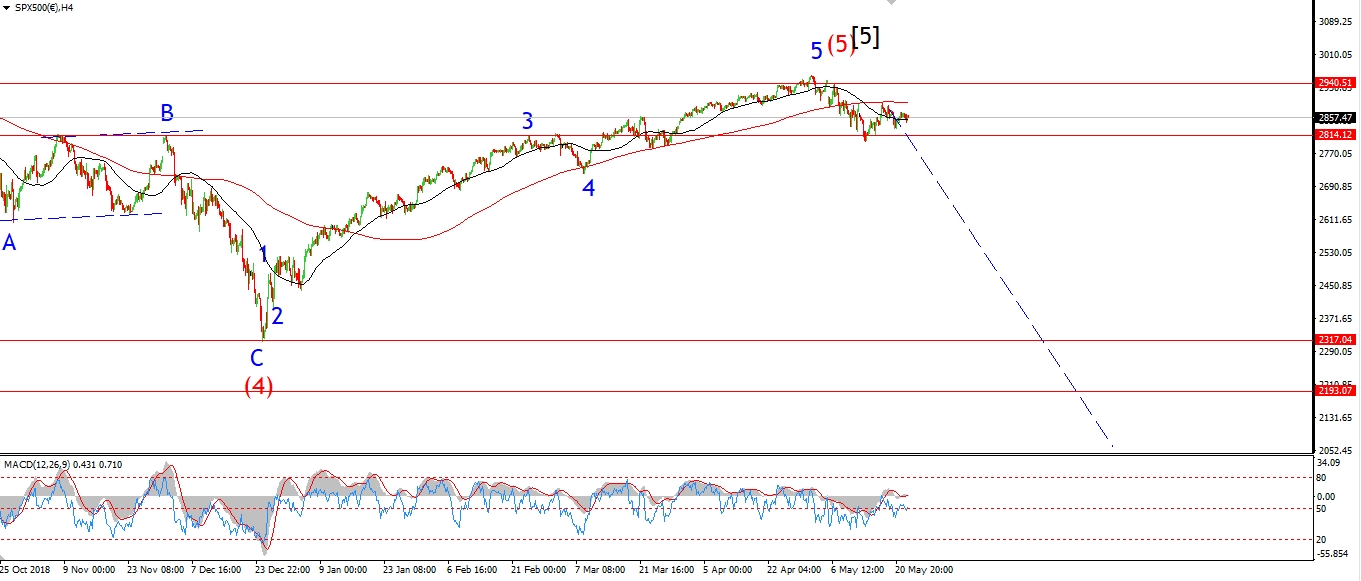 [/vc_column_text][vc_custom_heading text=”Daily” use_theme_fonts=”yes”][vc_column_text]
 [/vc_column_text][/vc_column][/vc_row]
[vc_row][vc_column][vc_column_text]
The S&P is off the wave ‘ii’ high also today.
But as yet we have not seen an acceleration lower into wave ‘iii’ of (i).
The running flat idea is holding so far for wave ‘ii’.
the interim high at 2885 should hold as wave ‘iii’ down develops.
A break of that level will trigger the alternate count as shown.
Tomorrow;
Watch for wave ‘iii’ of (i) to get underway with a break of 2830.
Wave (i) down should break the recent low at 2798 again.
[/vc_column_text][/vc_column][/vc_row]
[vc_row][vc_column][vc_column_text]
[/vc_column_text][/vc_column][/vc_row]
[vc_row][vc_column][vc_separator border_width=”5″][/vc_column][/vc_row]