
[vc_row][vc_column][vc_separator border_width=”5″][/vc_column][/vc_row]
[vc_row][vc_column][vc_column_text]
Good evening folks.
Welcome to a new week.
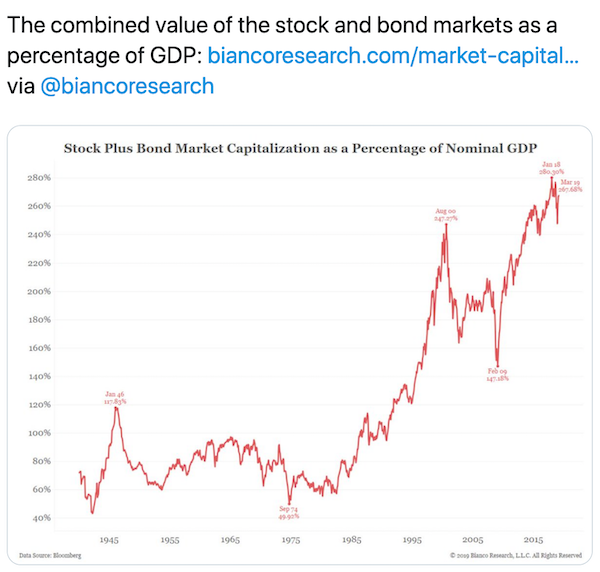
The above chart shows the total financial market value from 1940 to present.
I came across this today and the very first thing I saw, was a perfect five wave pattern off the lows into this years highs.
The corrections even happened in three waves!
It never ceases to amaze me the amount of places where the five wave pattern will occur.
The point being,
We are at a top in financial market valuation.
We can take todays news of another multi billion $ loss making unicorn going public as a clear sing we are at the top.
Massive losses that would cripple any normal company are viewed as a strength in the unicorn world!
Down to business.
[/vc_column_text][/vc_column][/vc_row]
[_s2If current_user_can(access_s2member_ccap_eurusd)]
[vc_row][vc_column][vc_separator border_width=”5″][/vc_column][/vc_row]
[vc_row][vc_column][vc_column_text]
EURUSD
[/vc_column_text][/vc_column][/vc_row]
[vc_row][vc_column][vc_separator border_width=”5″][/vc_column][/vc_row][vc_row][vc_column width=”2/3″][vc_custom_heading text=”1 hr” use_theme_fonts=”yes”][vc_column_text]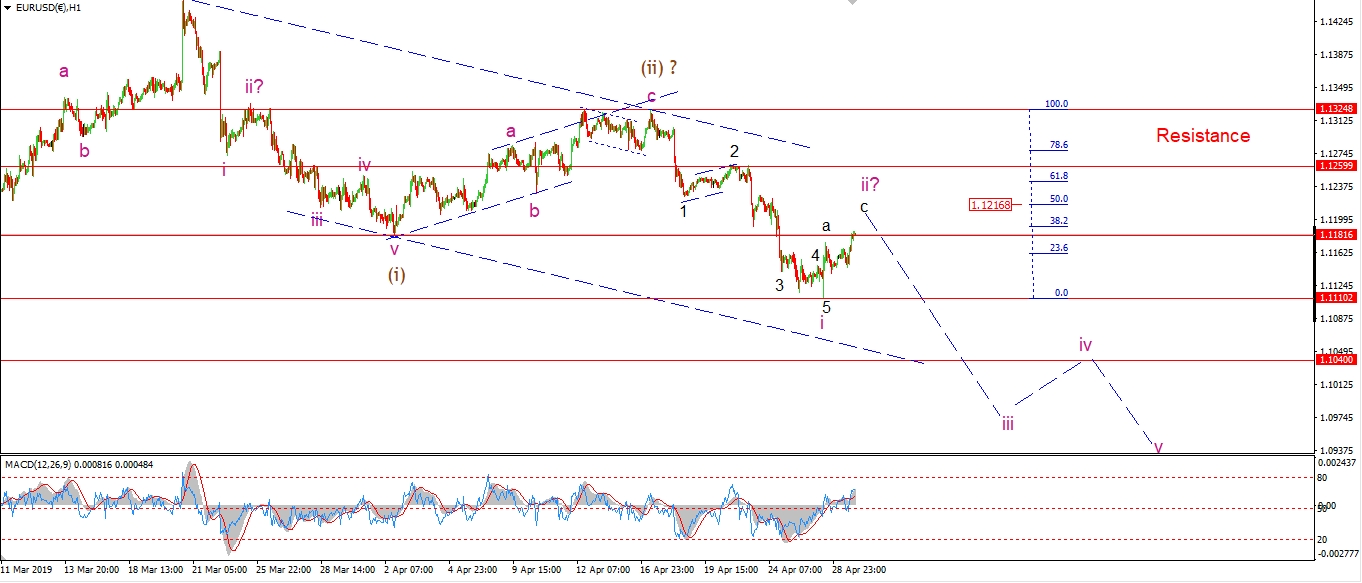 [/vc_column_text][/vc_column][vc_column width=”1/3″][vc_custom_heading text=”4 Hours” use_theme_fonts=”yes”][vc_column_text]
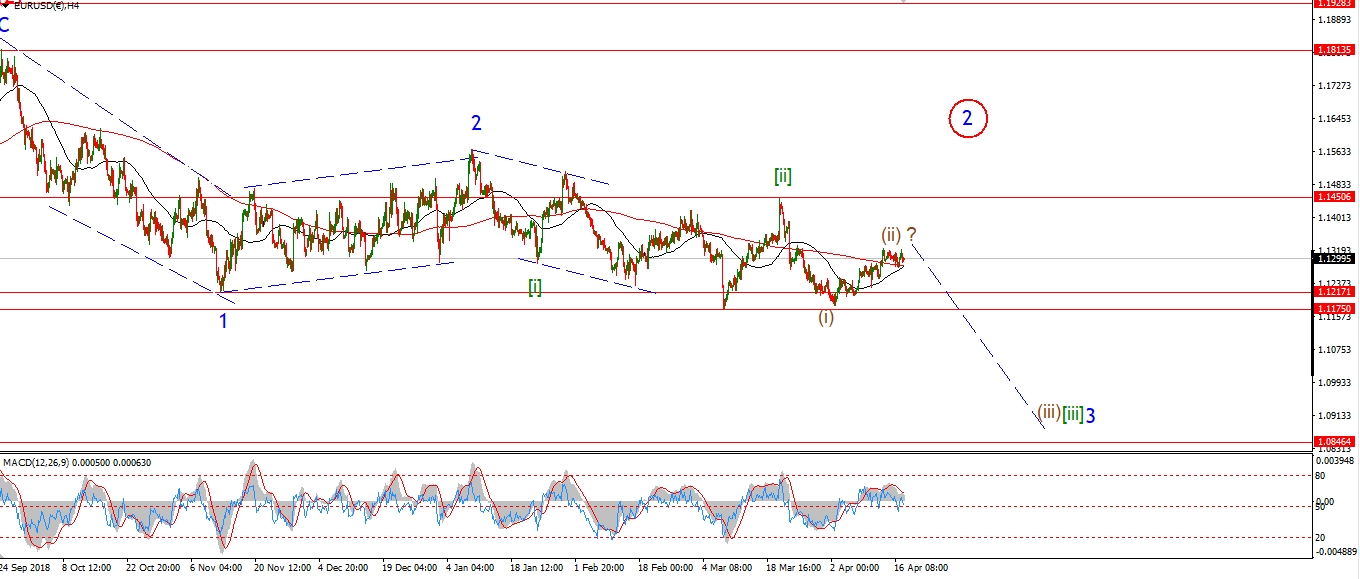 [/vc_column_text][vc_custom_heading text=”Daily” use_theme_fonts=”yes”][vc_column_text]
 [/vc_column_text][/vc_column][/vc_row]
[vc_row][vc_column][vc_column_text]
The price has continued Fridays rally today,
and so far this rally is tracing out a three wave correction higher off the low.
Because of this action I have switched to the alternate short term count
as mention on Friday.
This involves a lower degree impulse wave ‘i’ and ‘ii’ now developing.
The wave count still calls for that decline in a third of a third wave.
And this acceleration lower must begin this week.
Tomorrow;
Watch for wave ”’i to complete a three wave rise
and terminate in the area of the 50% retracement level at 1.1217.
[/vc_column_text][/vc_column][/vc_row]
[/_s2If]
[_s2If current_user_can(access_s2member_ccap_gbpusd)]
[vc_row][vc_column][vc_separator border_width=”5″][/vc_column][/vc_row][vc_row][vc_column][vc_column_text]
GBPUSD
[/vc_column_text][/vc_column][/vc_row][vc_row][vc_column][vc_separator border_width=”5″][/vc_column][/vc_row][vc_row][vc_column width=”2/3″][vc_custom_heading text=”1 hr” use_theme_fonts=”yes”][vc_column_text]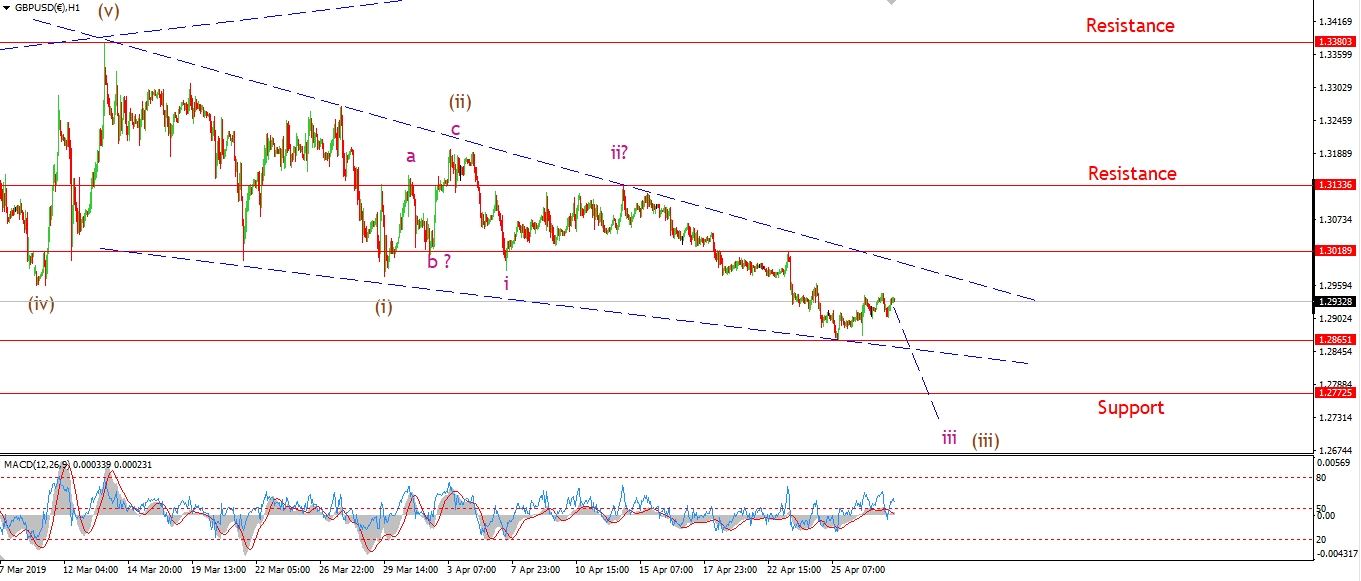 [/vc_column_text][/vc_column][vc_column width=”1/3″][vc_custom_heading text=”4 Hours” use_theme_fonts=”yes”][vc_column_text]
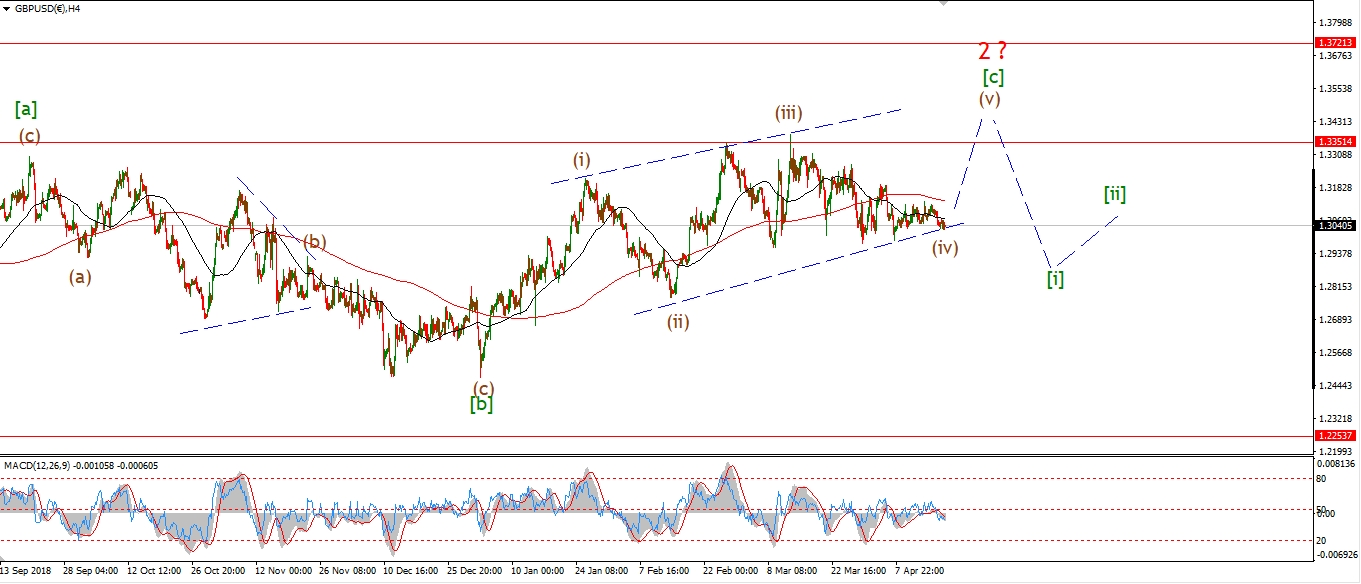 [/vc_column_text][vc_custom_heading text=”Daily” use_theme_fonts=”yes”][vc_column_text]
 [/vc_column_text][/vc_column][/vc_row]
[vc_row][vc_column][vc_column_text]
The short term wave count has not cleared up yet.
I continue to remain with the bearish outlook as with EURUSD.
The general trend continues lower day by day,
with the upside action looking corrective.
As long as this continues,
I will stay with the idea that this is an early stage bearish trend in a possible wave [iii] down.
Tomorrow;
Watch for the downward sloping trend line to hold as wave (iii) stays in force.
1.3018 should hold,
and a break of support at 1.2772 should bring an acceleration lower in wave (iii).
[/vc_column_text][/vc_column][/vc_row]
[/_s2If]
[_s2If current_user_can(access_s2member_ccap_usdjpy)]
[vc_row][vc_column][vc_separator border_width=”5″][/vc_column][/vc_row][vc_row][vc_column][vc_column_text]
USDJPY
[/vc_column_text][/vc_column][/vc_row][vc_row][vc_column][vc_separator border_width=”5″][/vc_column][/vc_row][vc_row][vc_column width=”2/3″][vc_custom_heading text=”1 hr” use_theme_fonts=”yes”][vc_column_text] [/vc_column_text][/vc_column][vc_column width=”1/3″][vc_custom_heading text=”4 Hours” use_theme_fonts=”yes”][vc_column_text]
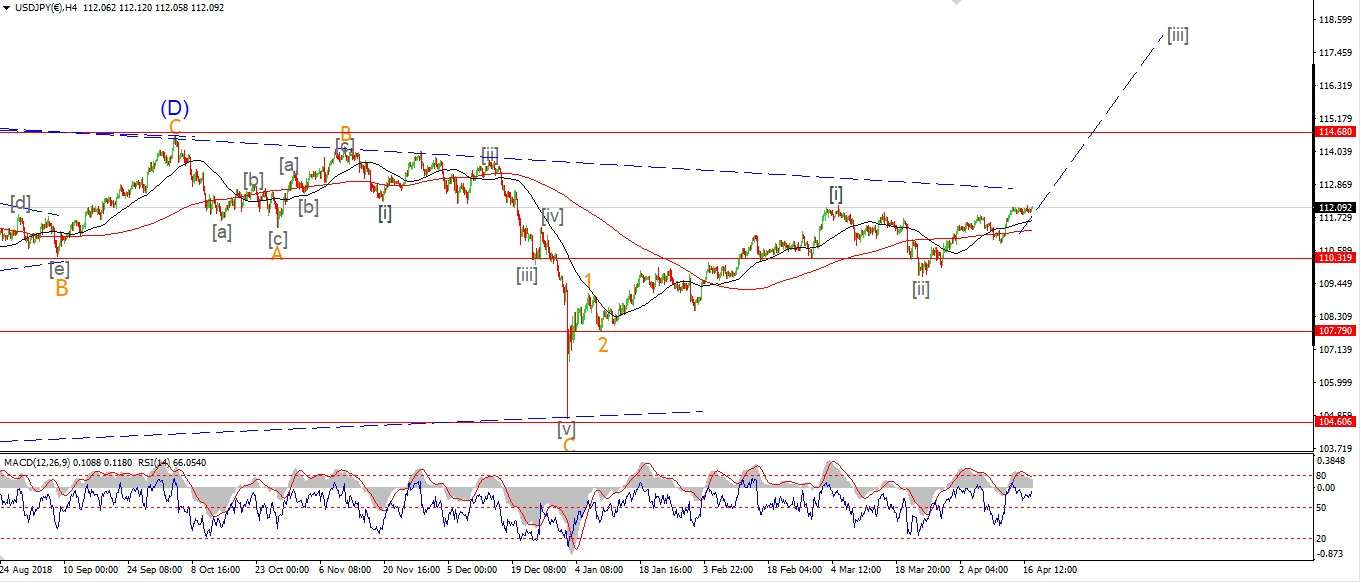 [/vc_column_text][vc_custom_heading text=”Daily” use_theme_fonts=”yes”][vc_column_text]
 [/vc_column_text][/vc_column][/vc_row]
[vc_row][vc_column][vc_column_text]
USDJPY is holding above the low labelled wave (ii) at 111.35.
If the price breaks above 112.40 again that will confirm wave (iii) has begun.
So I am looking for a rally early this week to rule out the alternate count for wave (ii) green.
The only issue with the action today is
that the price range is contracting around the 111.75 area.
This could be a triangle wave ‘b’ within that alternate count.
Again,
A break of 11240 will rule out the alternate count.
But it is good to keep it in mind.
Tomorrow;
Watch for 111.35 to hold and a rally in wave ‘iii’ to begin.
[/vc_column_text][/vc_column][/vc_row]
[/_s2If]
[_s2If current_user_can(access_s2member_ccap_dow_jones)]
[vc_row][vc_column][vc_separator border_width=”5″][/vc_column][/vc_row][vc_row][vc_column][vc_column_text]
DOW JONES INDUSTRIALS
[/vc_column_text][/vc_column][/vc_row][vc_row][vc_column][vc_separator border_width=”5″][/vc_column][/vc_row][vc_row][vc_column width=”2/3″][vc_custom_heading text=”1 hr” use_theme_fonts=”yes”][vc_column_text]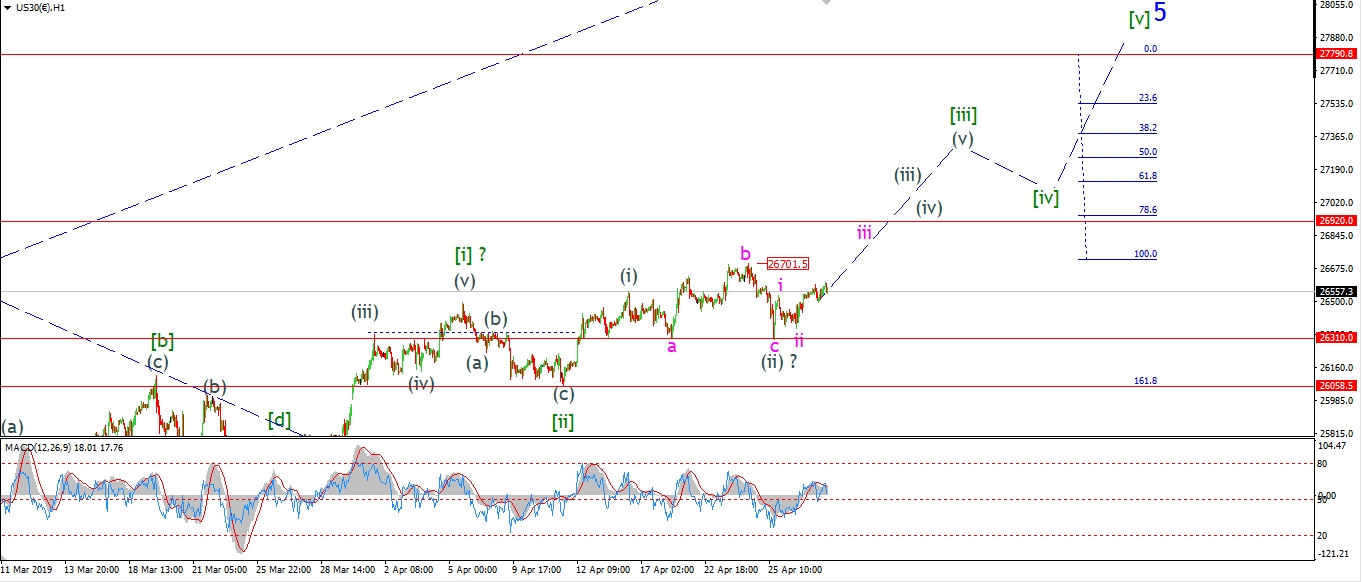 [/vc_column_text][/vc_column][vc_column width=”1/3″][vc_custom_heading text=”4 Hours” use_theme_fonts=”yes”][vc_column_text]
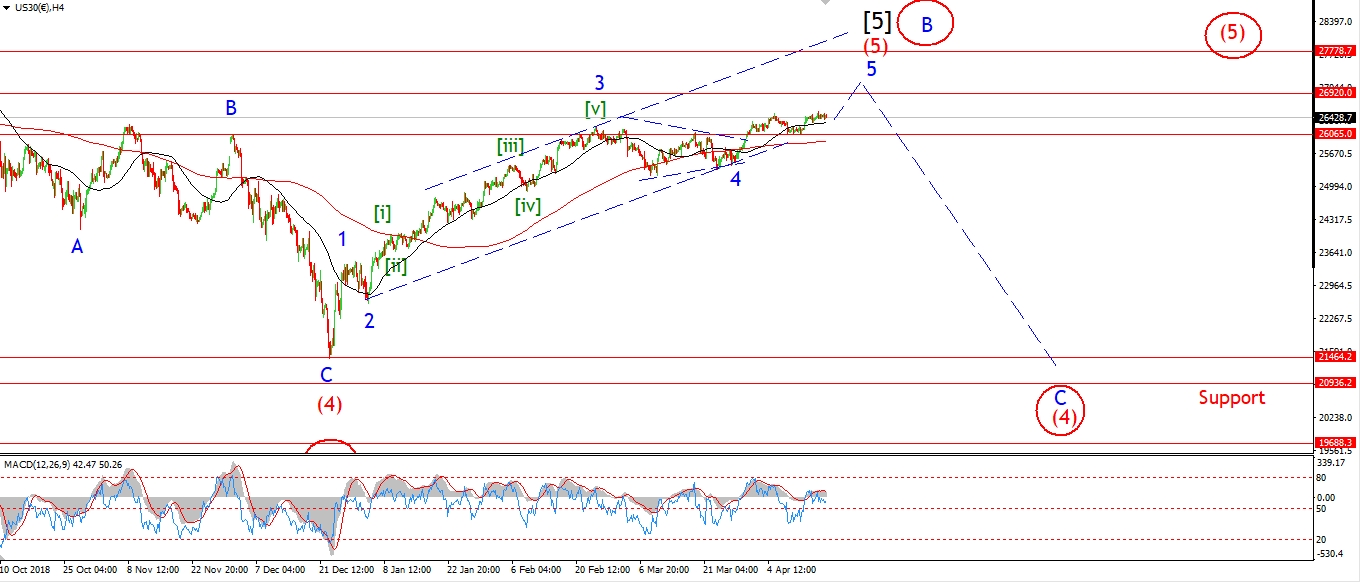 [/vc_column_text][vc_custom_heading text=”Daily” use_theme_fonts=”yes”][vc_column_text]
 [/vc_column_text][/vc_column][/vc_row]
[vc_row][vc_column][vc_column_text]
The market is pushing higher today,
albeit the action is far from convincing for a third wave.
I would like to see a new all time high this week in wave (iii) grey.
that will bring that upper target, and final high at 27790 one step closer.
Then we can work on the beginning of the next bear-market again.
The S&P broke to a new high today,
the Nasdaq made a new high last week,
that sentiment should be enough to carry the DOW over the line also.
Tomorrow;
Watch for wave ‘iii’ of (iii) to continue higher and break out above the wave ‘b’ high at 26700.
[/vc_column_text][/vc_column][/vc_row]
[/_s2If]
[_s2If current_user_can(access_s2member_ccap_gold)]
[vc_row][vc_column][vc_separator border_width=”5″][/vc_column][/vc_row][vc_row][vc_column][vc_column_text]
GOLD
[/vc_column_text][/vc_column][/vc_row][vc_row][vc_column][vc_separator border_width=”5″][/vc_column][/vc_row][vc_row][vc_column width=”2/3″][vc_custom_heading text=”1 hr” use_theme_fonts=”yes”][vc_column_text]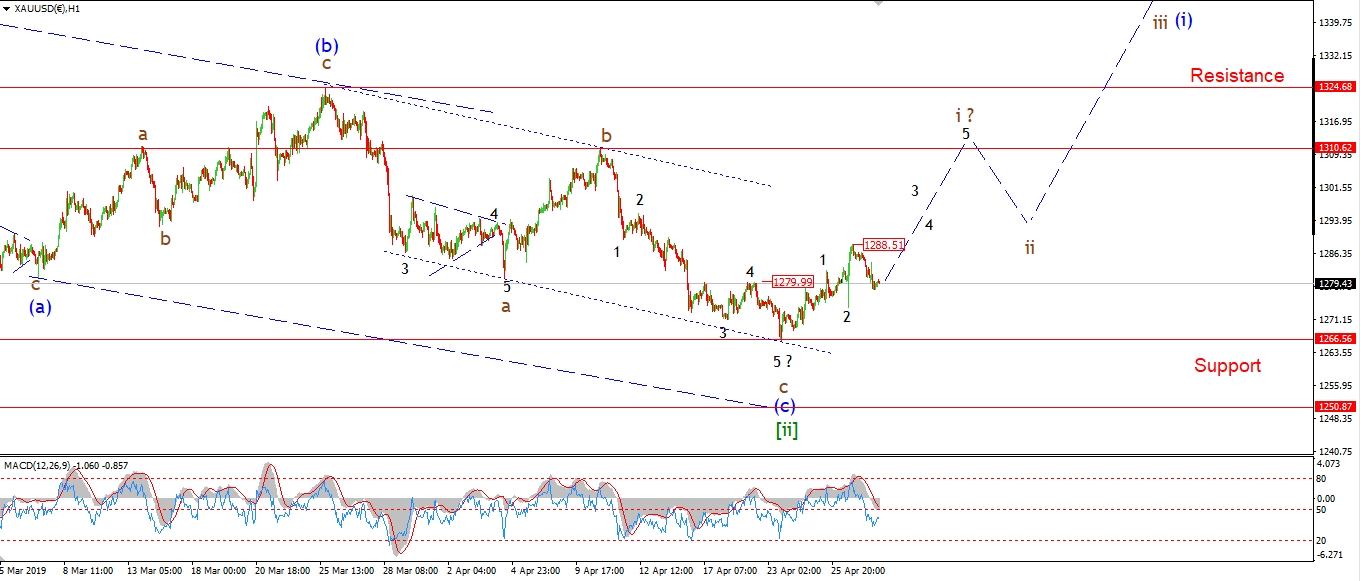 [/vc_column_text][/vc_column][vc_column width=”1/3″][vc_custom_heading text=”4 Hours” use_theme_fonts=”yes”][vc_column_text]
 [/vc_column_text][vc_custom_heading text=”Daily” use_theme_fonts=”yes”][vc_column_text]
 [/vc_column_text][/vc_column][/vc_row]
[vc_row][vc_column][vc_column_text]
No real change to the pattern in GOLD today.
The price fell to another higher low above wave ‘2’.
This could be developing extension within wave ‘3’ of ‘i’.
If that is the case,
then we must see another rally tomorrow
to continue the five wave pattern higher off the lows at wave [ii] green.
A break above 1290 again will signal wave ‘3’ of ‘i’ is underway.
Tomorrow;
Watch for the recent low at 1266.56 to hold as we continue a five wave pattern higher in wave ‘i’.
We should get a clear pattern in place by the end of the week.
[/vc_column_text][/vc_column][/vc_row]
[/_s2If]
[_s2If current_user_can(access_s2member_ccap_crude)]
[vc_row][vc_column][vc_separator border_width=”5″][/vc_column][/vc_row][vc_row][vc_column][vc_column_text]
U.S CRUDE OIL
[/vc_column_text][/vc_column][/vc_row][vc_row][vc_column][vc_separator border_width=”5″][/vc_column][/vc_row][vc_row][vc_column width=”2/3″][vc_custom_heading text=”1 hr” use_theme_fonts=”yes”][vc_column_text]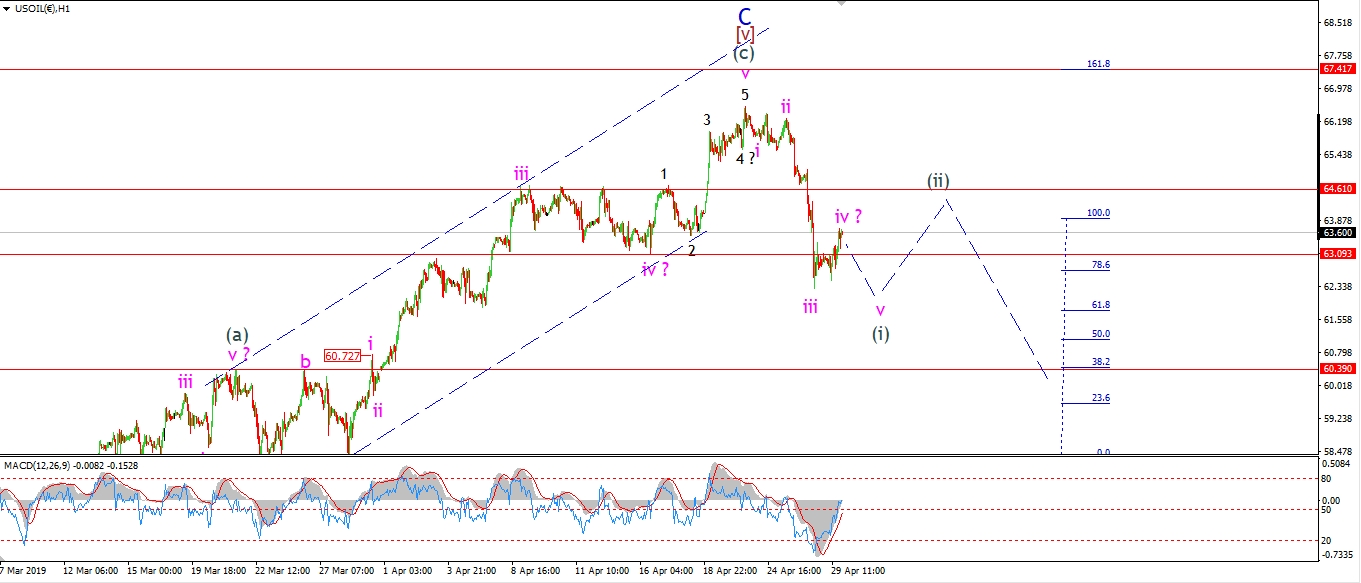 [/vc_column_text][/vc_column][vc_column width=”1/3″][vc_custom_heading text=”4 Hours” use_theme_fonts=”yes”][vc_column_text]
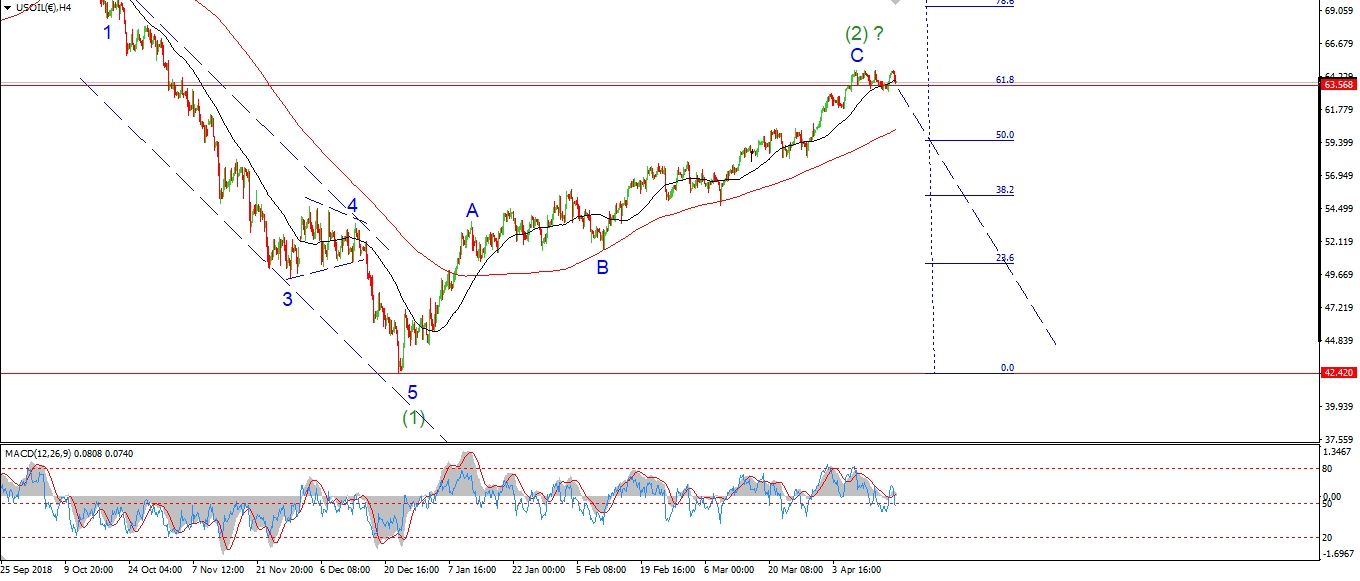 [/vc_column_text][vc_custom_heading text=”Daily” use_theme_fonts=”yes”][vc_column_text]
 [/vc_column_text][/vc_column][/vc_row]
[vc_row][vc_column][vc_column_text]
Crude has consolidated today after Fridays sharp move lower.
The short term wave count calls for a correction higher in wave ‘iv’ of (i).
Todays action fits that pattern for now.
So the market should be topping again this evening in wave ‘iv’,
and we should see another turn lower tomorrow in wave ‘v’.
A break of 63.00 again will confirm wave ‘v’ of (i).
And then we can look for wave (ii) to begin.
The larger bearish signal off the high will be complete at wave (ii).
And that should take the rest of the week to develop.
Tomorrow;
Watch for wave ‘i’ to complete early tomorrow,
and then return lower in wave ‘v’ of (i).
[/vc_column_text][/vc_column][/vc_row]
[/_s2If]
[_s2If current_user_can(access_s2member_ccap_us10yr)]
[vc_row][vc_column][vc_separator border_width=”5″][/vc_column][/vc_row][vc_row][vc_column][vc_column_text]
US 10 yr Treasuries.
[/vc_column_text][/vc_column][/vc_row][vc_row][vc_column][vc_separator border_width=”5″][/vc_column][/vc_row][vc_row][vc_column width=”2/3″][vc_custom_heading text=”1 hr” use_theme_fonts=”yes”][vc_column_text] [/vc_column_text][/vc_column][vc_column width=”1/3″][vc_custom_heading text=”4 Hours” use_theme_fonts=”yes”][vc_column_text]
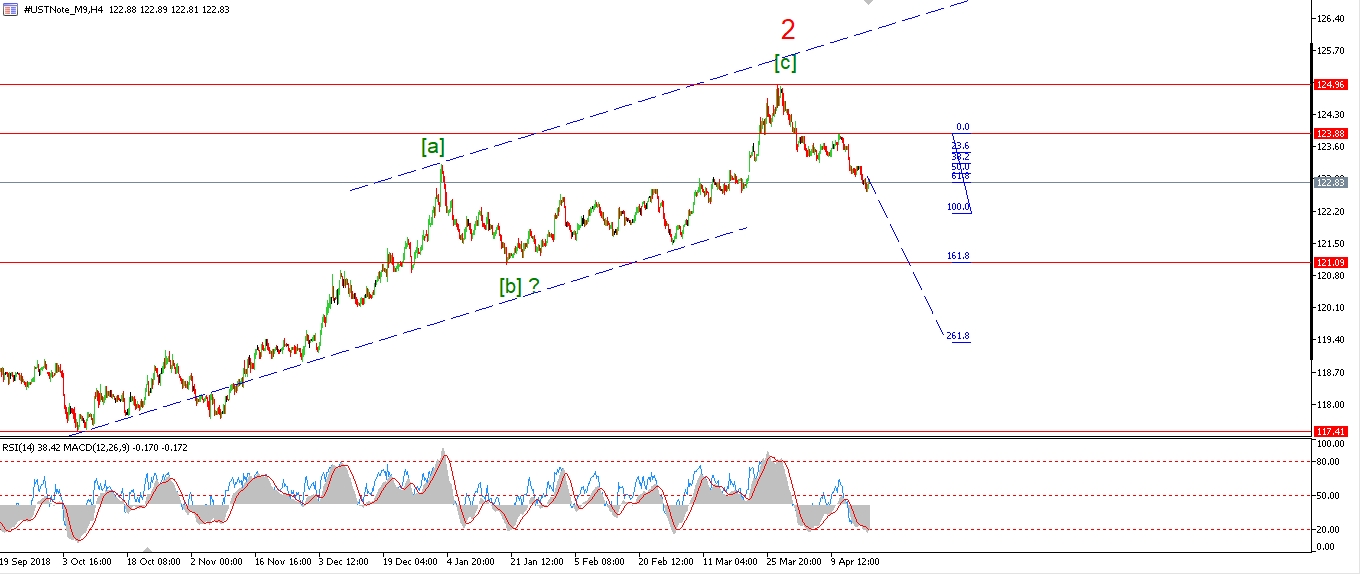 [/vc_column_text][vc_custom_heading text=”Daily” use_theme_fonts=”yes”][vc_column_text]
 [/vc_column_text][/vc_column][/vc_row]
[vc_row][vc_column][vc_column_text]
The 10YR has fallen off Friday’s highs today
which suggests that the top is in for wave (ii) grey.
The initial signs are positive,
but the price should continue to fall for the rest of the week
and break support at 122.63 and confirm wave (iii) down has begun.
Tomorrow;
Watch for wave ‘i’ of (iii) to continue lower.
The high of wave (ii) at 123.72 should hold.
A break of 122.89 will be a sing that wave ‘i’ of (iii) is underway.
[/vc_column_text][/vc_column][/vc_row]
[/_s2If]
[_s2If current_user_can(access_s2member_ccap_silver)]
[vc_row][vc_column][vc_separator border_width=”5″][/vc_column][/vc_row][vc_row][vc_column][vc_column_text]
SILVER
[/vc_column_text][/vc_column][/vc_row][vc_row][vc_column][vc_separator border_width=”5″][/vc_column][/vc_row][vc_row][vc_column width=”2/3″][vc_custom_heading text=”1 hr” use_theme_fonts=”yes”][vc_column_text]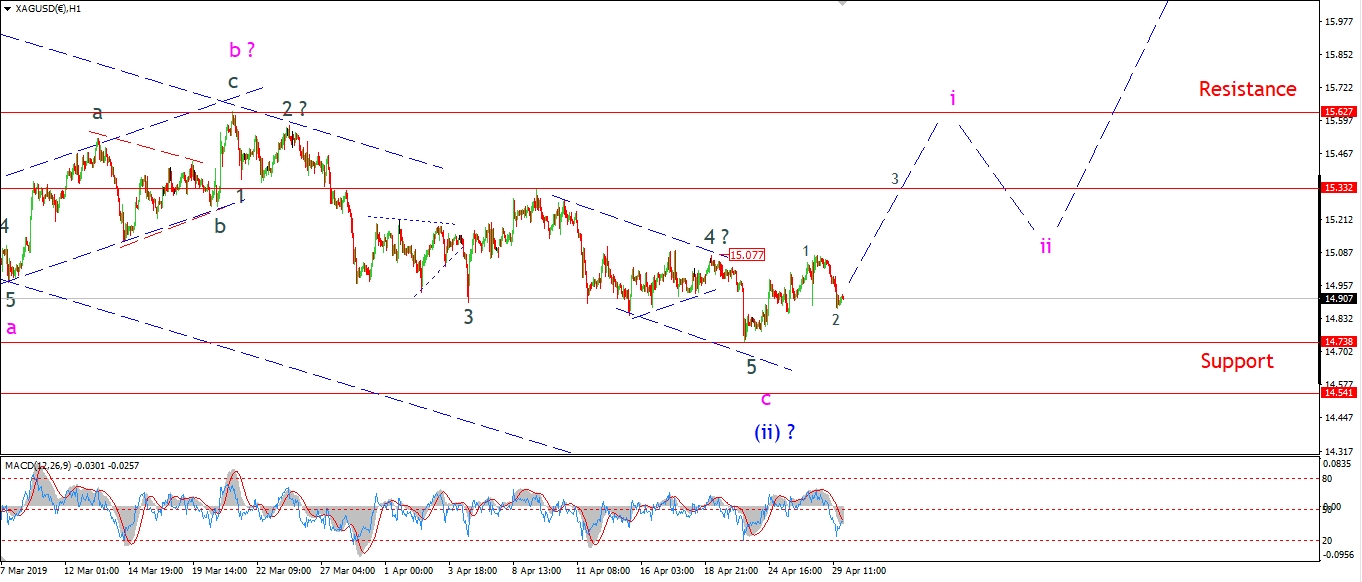 [/vc_column_text][/vc_column][vc_column width=”1/3″][vc_custom_heading text=”4 Hours” use_theme_fonts=”yes”][vc_column_text]
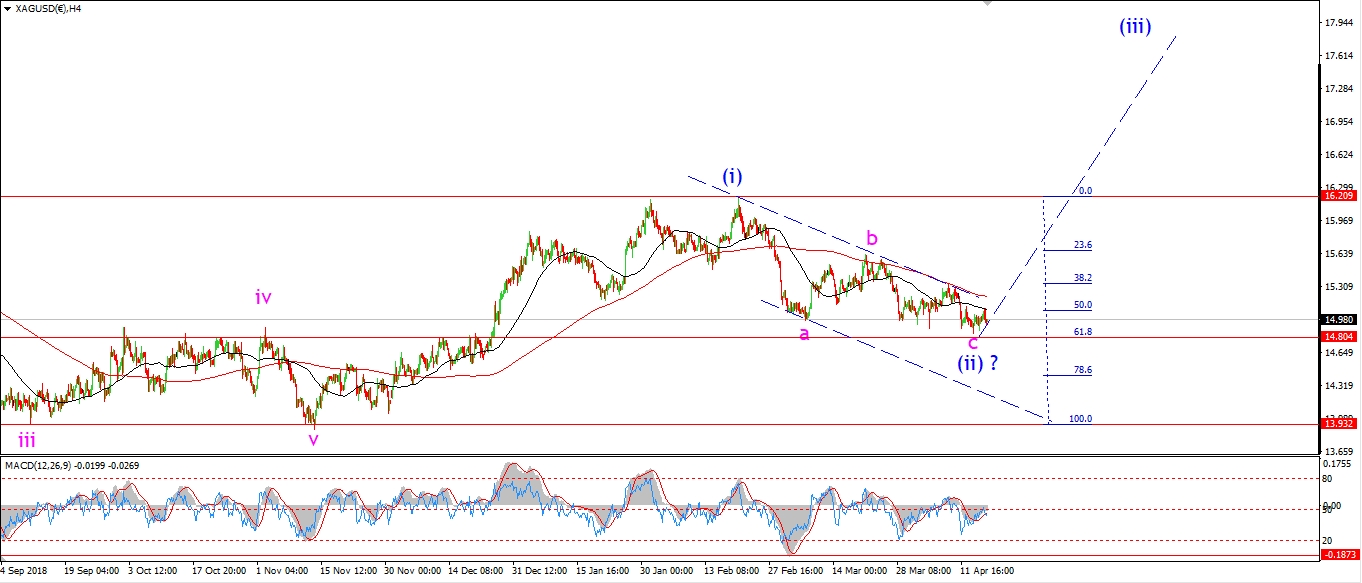 [/vc_column_text][vc_custom_heading text=”Daily” use_theme_fonts=”yes”][vc_column_text]
 [/vc_column_text][/vc_column][/vc_row]
[vc_row][vc_column][vc_column_text]
Silver is holding above support at 14.73 after todays declines.
I have I have shown a possible interpretation on the short term chart.
Todays decline can be viewed as part of an expanded flat wave ‘2’.
But the price must hold above 14.73,
and a further rally should take over this week to trace out a five wave rally in wave ‘i’.
Only then can we be confident that the market has bottomed at wave (ii).
Tomorrow;
Watch for 14.73 to hold and wave ‘i’ to continue higher.
[/vc_column_text][/vc_column][/vc_row]
[/_s2If]
[_s2If current_user_can(access_s2member_ccap_sp500)]
[vc_row][vc_column][vc_separator border_width=”5″][/vc_column][/vc_row][vc_row][vc_column][vc_column_text]
S&P 500.
[/vc_column_text][/vc_column][/vc_row][vc_row][vc_column][vc_separator border_width=”5″][/vc_column][/vc_row][vc_row][vc_column width=”2/3″][vc_custom_heading text=”1 hr” use_theme_fonts=”yes”][vc_column_text]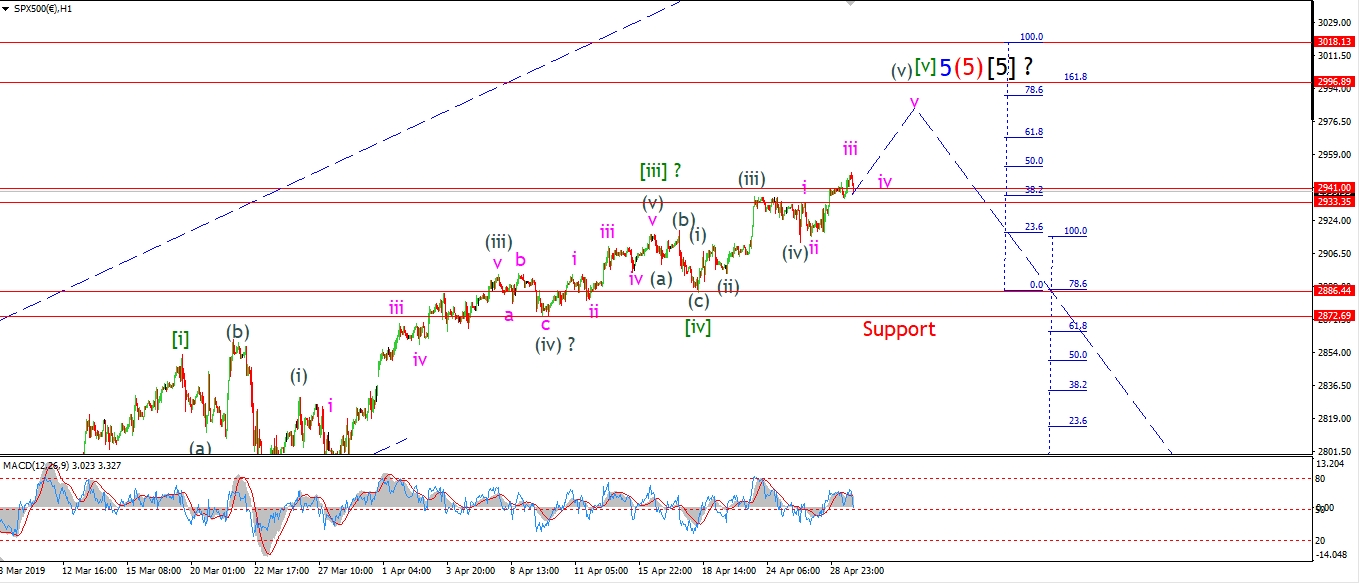 [/vc_column_text][/vc_column][vc_column width=”1/3″][vc_custom_heading text=”4 Hours” use_theme_fonts=”yes”][vc_column_text]
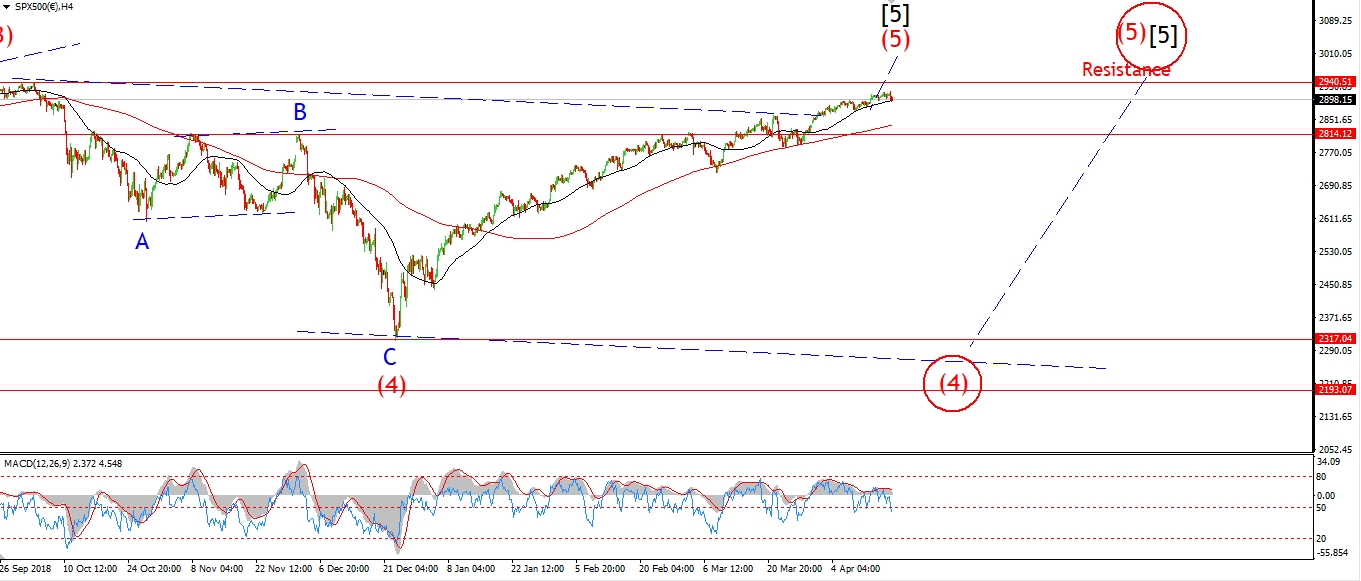 [/vc_column_text][vc_custom_heading text=”Daily” use_theme_fonts=”yes”][vc_column_text]
 [/vc_column_text][/vc_column][/vc_row]
[vc_row][vc_column][vc_column_text]
The S&P500 has broken to a new all time high today.
In general the action is pretty hesitant rather than exuberant as you might expect.
And the market is actually selling off again as we approach the close.
I am taking this as a hint that we may be further along in the structure than I thought.
I have re-labelled the short term count today with this idea in mind.
Todays new all time high occurred in wave ‘iii’ of (v).
The market should push higher over the coming week in wave (v),
but the structure is closer to the end now.
If this is correct,
Then all we have is wave ‘iv’ and ‘v’ to complete this top.
Tomorrow;
Watch for wave ‘iii’ to hold above 2933 at wave ‘i’ pink.
I expect wave ‘iii’ of (v) will pull clear of the recent left shoulder before completing.
So the rest of the week should be positive with that final target in sight at 2996.
[/vc_column_text][/vc_column][/vc_row]
[/_s2If]
[vc_row][vc_column][vc_column_text]
[/vc_column_text][/vc_column][/vc_row]
[vc_row][vc_column][vc_separator border_width=”5″][/vc_column][/vc_row]