
[vc_row][vc_column][vc_separator border_width=”5″][/vc_column][/vc_row]
[vc_row][vc_column][vc_column_text]
Hi there everyone.
I saw this story on Bloomberg today which is in stark contrast to the euphoric market!
Heres the chart,
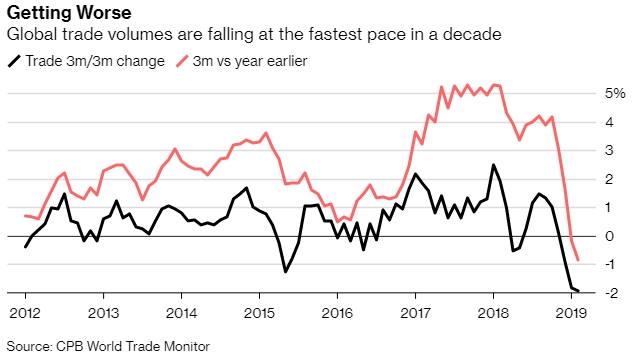
It is interesting,
on one hand we are in a bidding war in the stock market, to own a piece of the revenue stream from trade.
But on the other hand we are shifting away from trading, and therefore guaranteeing the decline of those revenue streams!
A bubble is an amazing thing to behold eh!
Down to it.
[/vc_column_text][/vc_column][/vc_row]
[_s2If current_user_can(access_s2member_ccap_eurusd)]
[vc_row][vc_column][vc_separator border_width=”5″][/vc_column][/vc_row]
[vc_row][vc_column][vc_column_text]
EURUSD
[/vc_column_text][/vc_column][/vc_row]
[vc_row][vc_column][vc_separator border_width=”5″][/vc_column][/vc_row][vc_row][vc_column width=”2/3″][vc_custom_heading text=”1 hr” use_theme_fonts=”yes”][vc_column_text]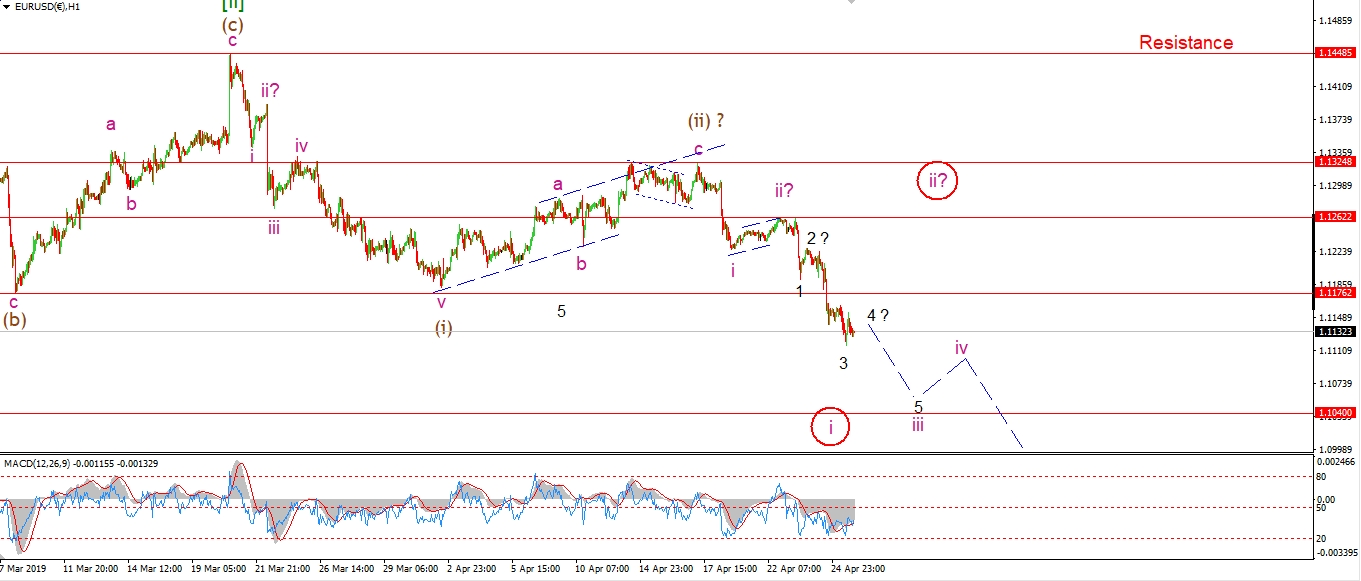 [/vc_column_text][/vc_column][vc_column width=”1/3″][vc_custom_heading text=”4 Hours” use_theme_fonts=”yes”][vc_column_text]
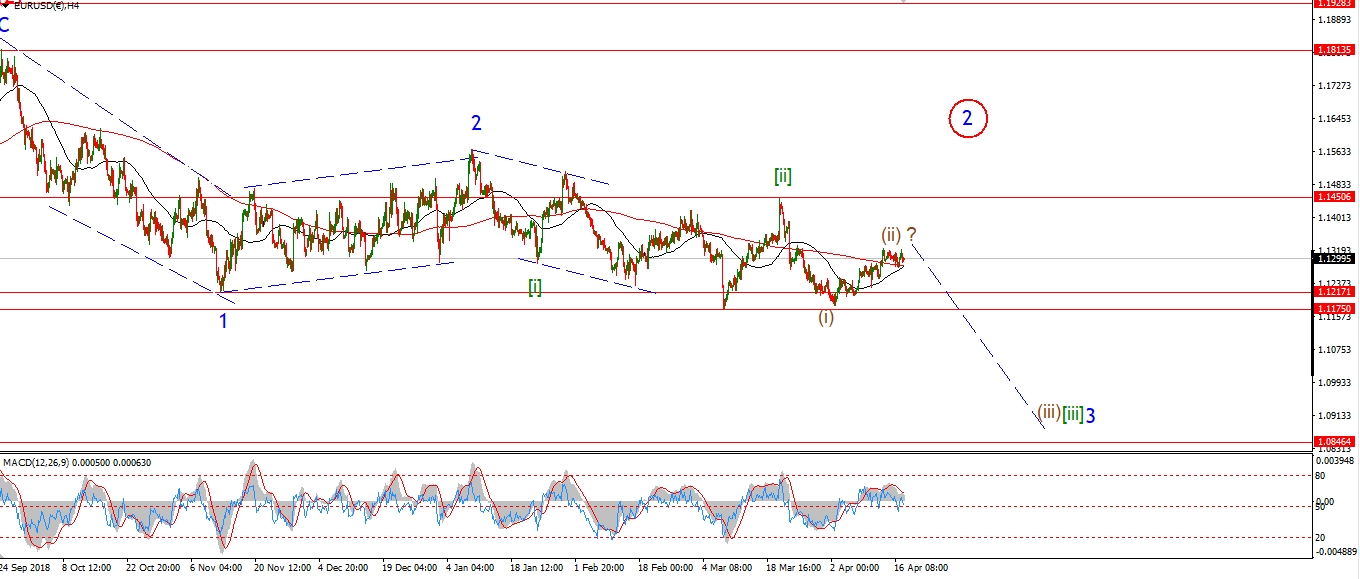 [/vc_column_text][vc_custom_heading text=”Daily” use_theme_fonts=”yes”][vc_column_text]
 [/vc_column_text][/vc_column][/vc_row]
[vc_row][vc_column][vc_column_text]
EURUSD is lower again today in wave ‘iii’ of (iii).
Wave ‘iii’ is tracing out a five wave decline,
and we may be within a third wave of wave ‘iii’ itself now.
If that is the case,
then I expect this decline will continue and maybe even accelerate over the coming days.
The alternate count shown circled in red, is still viable.
A correction back to 1.1260 will trigger that count.
Tomorrow;
The major wave in force now is wave (iii) brown.
The minimum target for the wave lies at 1.1040 where it reaches equality with wave (i).
Watch for wave ‘iii’ of (iii) to continue lower.
[/vc_column_text][/vc_column][/vc_row]
[/_s2If]
[_s2If current_user_can(access_s2member_ccap_gbpusd)]
[vc_row][vc_column][vc_separator border_width=”5″][/vc_column][/vc_row][vc_row][vc_column][vc_column_text]
GBPUSD
[/vc_column_text][/vc_column][/vc_row][vc_row][vc_column][vc_separator border_width=”5″][/vc_column][/vc_row][vc_row][vc_column width=”2/3″][vc_custom_heading text=”1 hr” use_theme_fonts=”yes”][vc_column_text]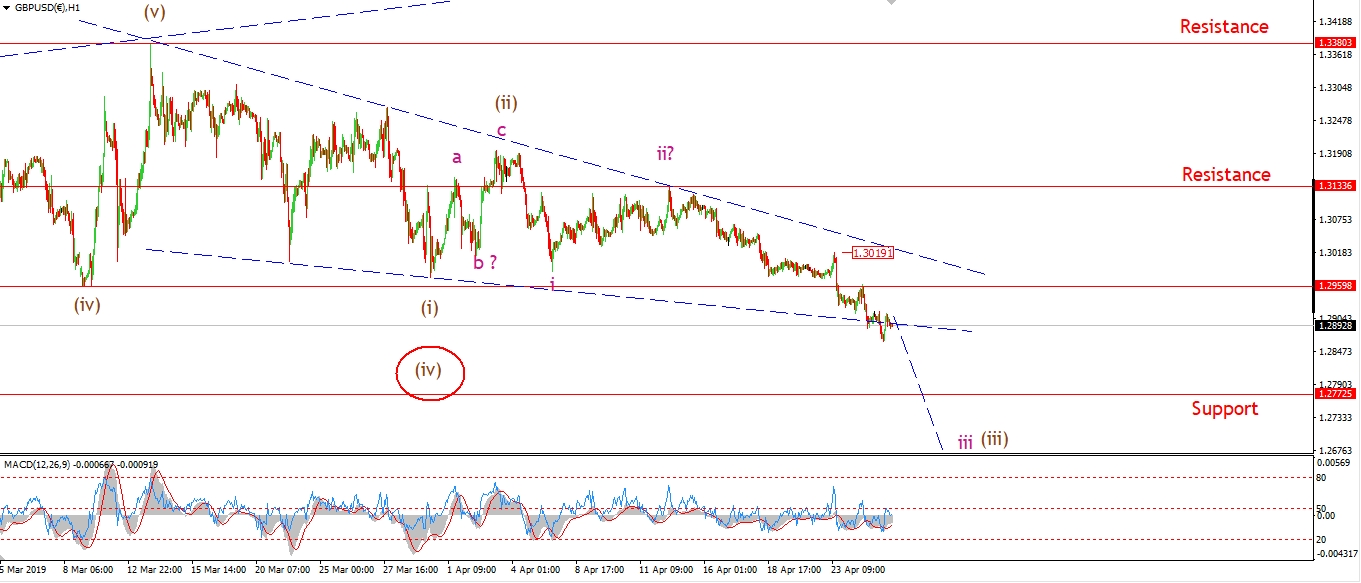 [/vc_column_text][/vc_column][vc_column width=”1/3″][vc_custom_heading text=”4 Hours” use_theme_fonts=”yes”][vc_column_text]
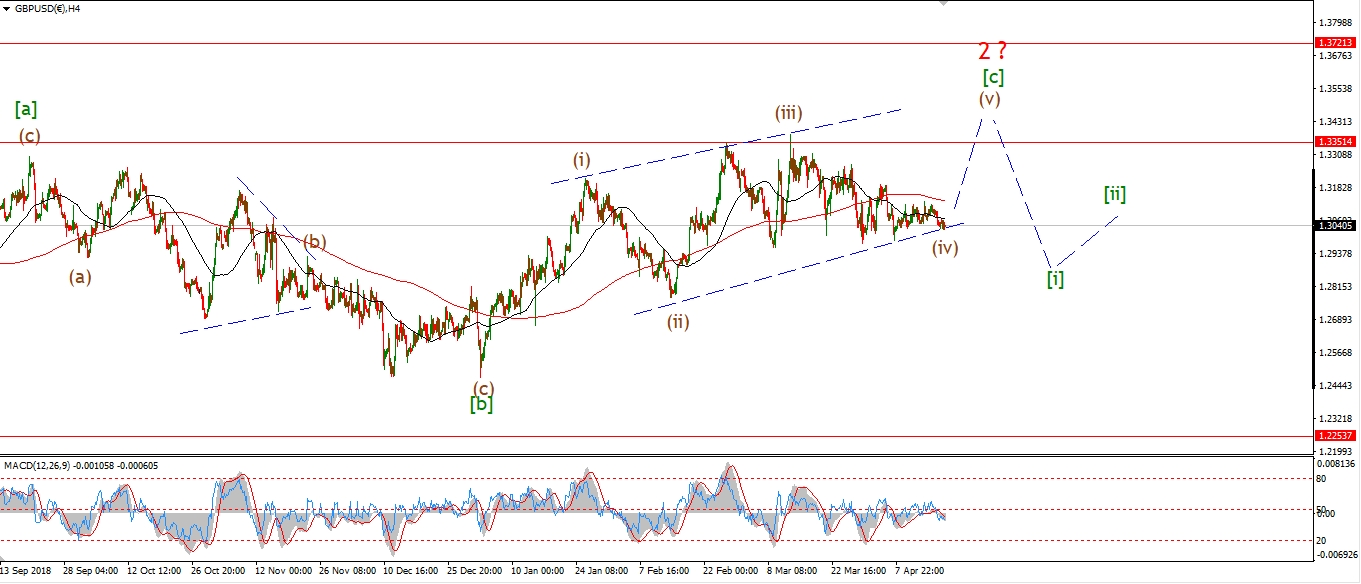 [/vc_column_text][vc_custom_heading text=”Daily” use_theme_fonts=”yes”][vc_column_text]
 [/vc_column_text][/vc_column][/vc_row]
[vc_row][vc_column][vc_column_text]
Although the short term price structure is less than ideal,
the price continues lower none the less.
The next support level below us now lies at 1.2772.
This is the level of wave (ii) within the previous rally.
A break of this level will another degree of confidence that the top is in for cable.
Tomorrow;
watch for 1.3019 to continue to hold and this decline in wave (iii) to continue.
[/vc_column_text][/vc_column][/vc_row]
[/_s2If]
[_s2If current_user_can(access_s2member_ccap_usdjpy)]
[vc_row][vc_column][vc_separator border_width=”5″][/vc_column][/vc_row][vc_row][vc_column][vc_column_text]
USDJPY
[/vc_column_text][/vc_column][/vc_row][vc_row][vc_column][vc_separator border_width=”5″][/vc_column][/vc_row][vc_row][vc_column width=”2/3″][vc_custom_heading text=”1 hr” use_theme_fonts=”yes”][vc_column_text]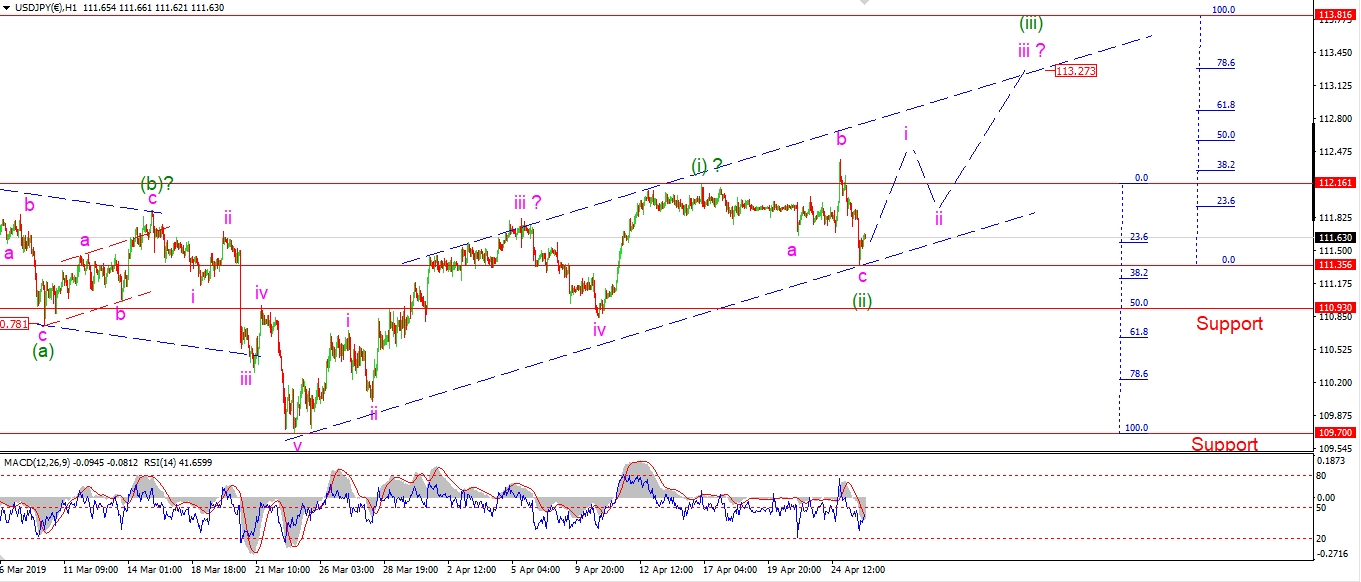 [/vc_column_text][/vc_column][vc_column width=”1/3″][vc_custom_heading text=”4 Hours” use_theme_fonts=”yes”][vc_column_text]
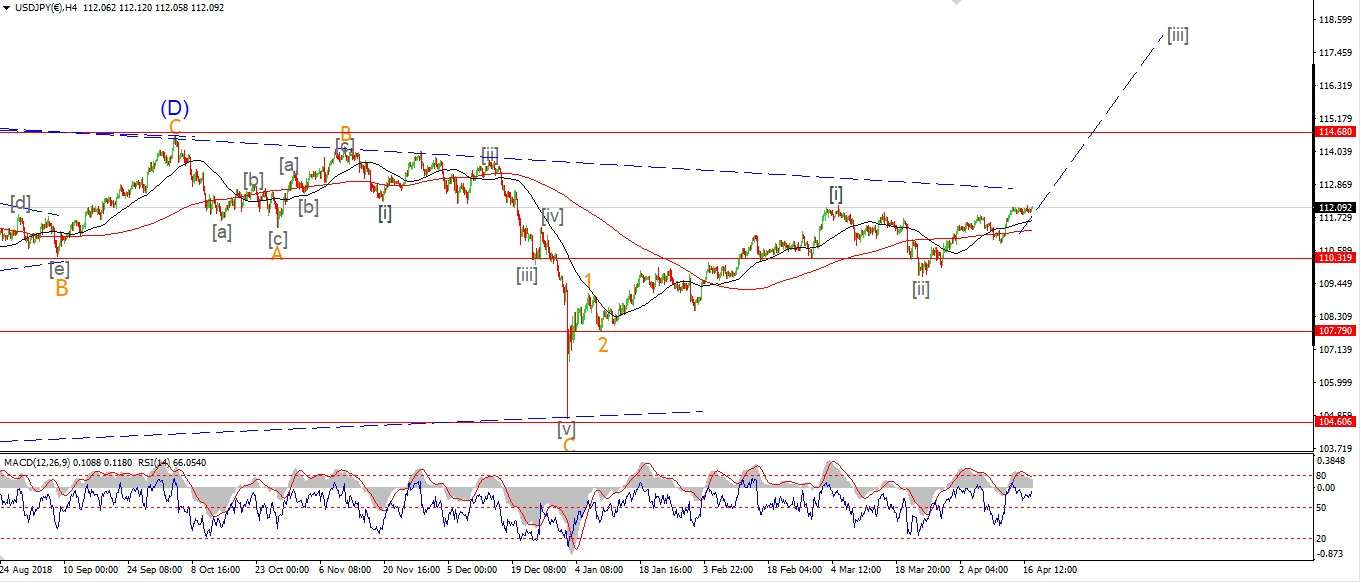 [/vc_column_text][vc_custom_heading text=”Daily” use_theme_fonts=”yes”][vc_column_text]
 [/vc_column_text][/vc_column][/vc_row]
[vc_row][vc_column][vc_column_text]
I have switched to the alternate count this evening.
Todays sharp decline is in five waves.
So this is viewed as wave ‘c’ of (ii) as shown.
Wave (ii) seems to have traced out an expanded flat correction.
The internal structure follows the 3,3,5 pattern.
and this decline should be followed by a rally in wave ‘i’ of (iii).
Wave (i) green has traced out a larger rally off the lows.
So this suggests a larger rally in wave (iii) green also.
The target lies at about 115.30,
where wave (iii) reaches 161.8% of wave (i).
Tomorrow;
Watch for wave (ii) to complete soon.
A rally back above 112.16 will signal that wave (iii) has begun.
[/vc_column_text][/vc_column][/vc_row]
[/_s2If]
[_s2If current_user_can(access_s2member_ccap_dow_jones)]
[vc_row][vc_column][vc_separator border_width=”5″][/vc_column][/vc_row][vc_row][vc_column][vc_column_text]
DOW JONES INDUSTRIALS
[/vc_column_text][/vc_column][/vc_row][vc_row][vc_column][vc_separator border_width=”5″][/vc_column][/vc_row][vc_row][vc_column width=”2/3″][vc_custom_heading text=”1 hr” use_theme_fonts=”yes”][vc_column_text]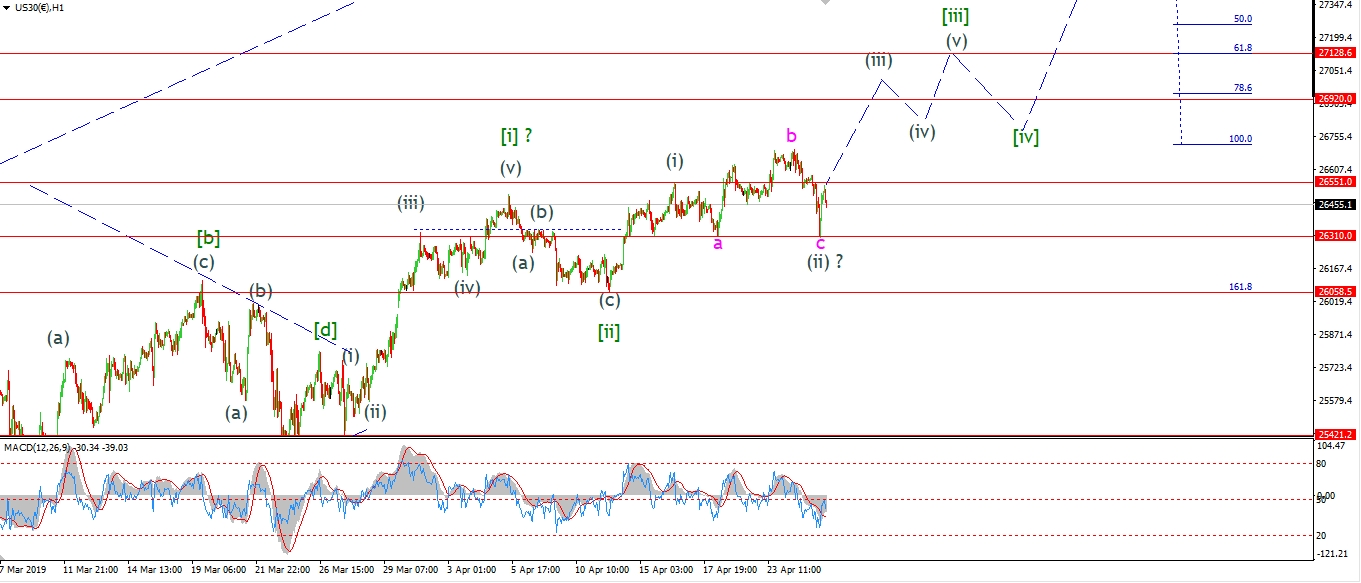 [/vc_column_text][/vc_column][vc_column width=”1/3″][vc_custom_heading text=”4 Hours” use_theme_fonts=”yes”][vc_column_text]
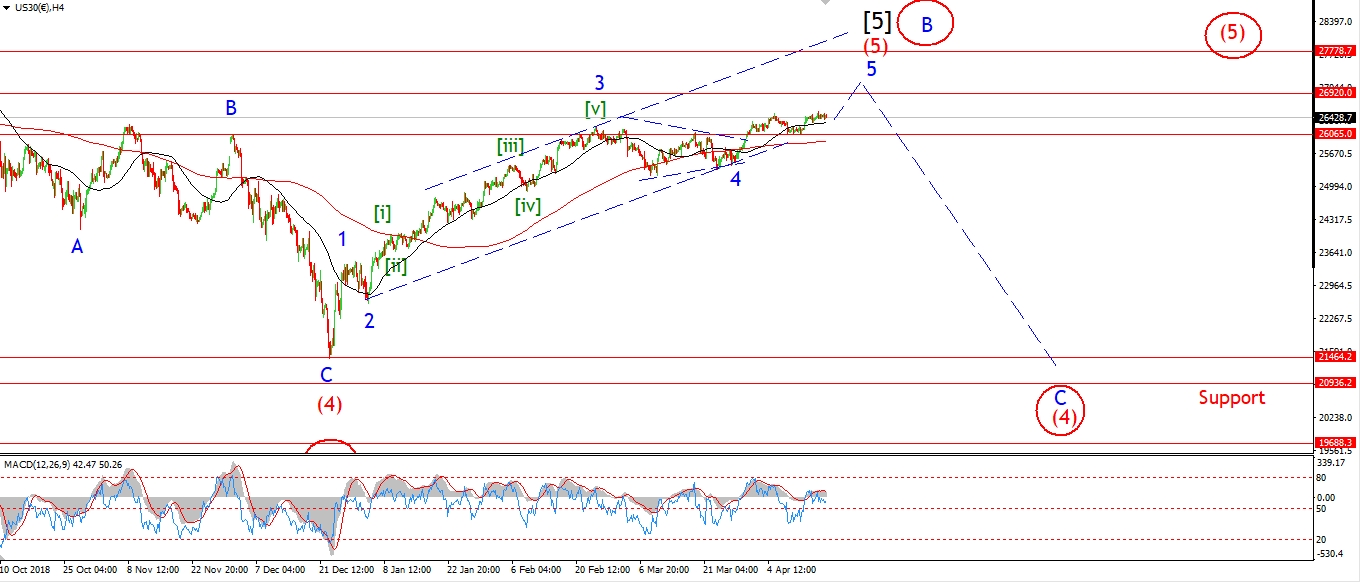 [/vc_column_text][vc_custom_heading text=”Daily” use_theme_fonts=”yes”][vc_column_text]
 [/vc_column_text][/vc_column][/vc_row]
[vc_row][vc_column][vc_column_text]
The price took a dive out of the gate this morning!
Some bad earnings reports drove a spate of selling,
but the price has recovered most of the losses this evening.
I have altered the short term count slightly to account for this spike lower.
Todays low takes the wave (ii) label and wave (iii) of [iii] is now underway.
Tomorrow;
The decline today has set back the wave count by about a week or so.
Although I still expect a new high over the coming week in wave (iii).
watch for todays low at 26310 to hold.
Wave (iii) should continue higher for the next week or so to carry us to a new all time high.
[/vc_column_text][/vc_column][/vc_row]
[/_s2If]
[_s2If current_user_can(access_s2member_ccap_gold)]
[vc_row][vc_column][vc_separator border_width=”5″][/vc_column][/vc_row][vc_row][vc_column][vc_column_text]
GOLD
[/vc_column_text][/vc_column][/vc_row][vc_row][vc_column][vc_separator border_width=”5″][/vc_column][/vc_row][vc_row][vc_column width=”2/3″][vc_custom_heading text=”1 hr” use_theme_fonts=”yes”][vc_column_text]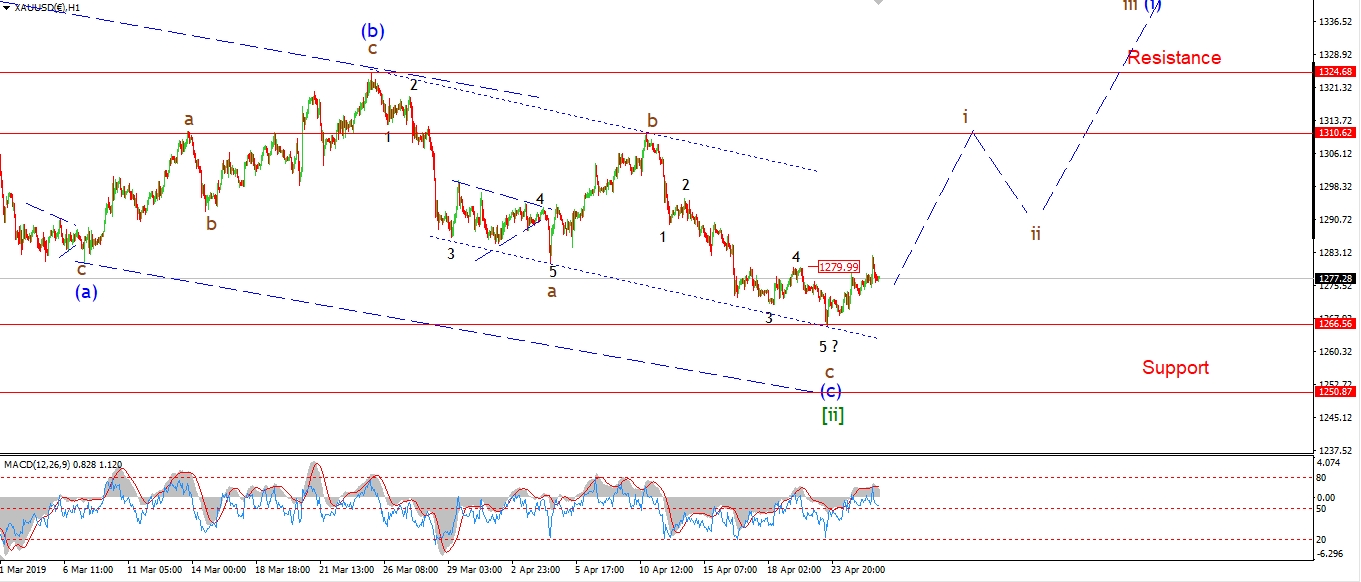 [/vc_column_text][/vc_column][vc_column width=”1/3″][vc_custom_heading text=”4 Hours” use_theme_fonts=”yes”][vc_column_text]
 [/vc_column_text][vc_custom_heading text=”Daily” use_theme_fonts=”yes”][vc_column_text]
 [/vc_column_text][/vc_column][/vc_row]
[vc_row][vc_column][vc_column_text]
GOLD is climbing off this weeks lows at 1266.56,
but the rally has not developed impulsively just yet.
We need this rally to continue in five waves and push back above 1300 over the coming week.
This action will definitely signal the bullish count is on.
Tomorrow;
Watch for the recent low at 1266.56 to hold,
Lets see if price can push above 1280 again tomorrow.
[/vc_column_text][/vc_column][/vc_row]
[/_s2If]
[_s2If current_user_can(access_s2member_ccap_crude)]
[vc_row][vc_column][vc_separator border_width=”5″][/vc_column][/vc_row][vc_row][vc_column][vc_column_text]
U.S CRUDE OIL
[/vc_column_text][/vc_column][/vc_row][vc_row][vc_column][vc_separator border_width=”5″][/vc_column][/vc_row][vc_row][vc_column width=”2/3″][vc_custom_heading text=”1 hr” use_theme_fonts=”yes”][vc_column_text]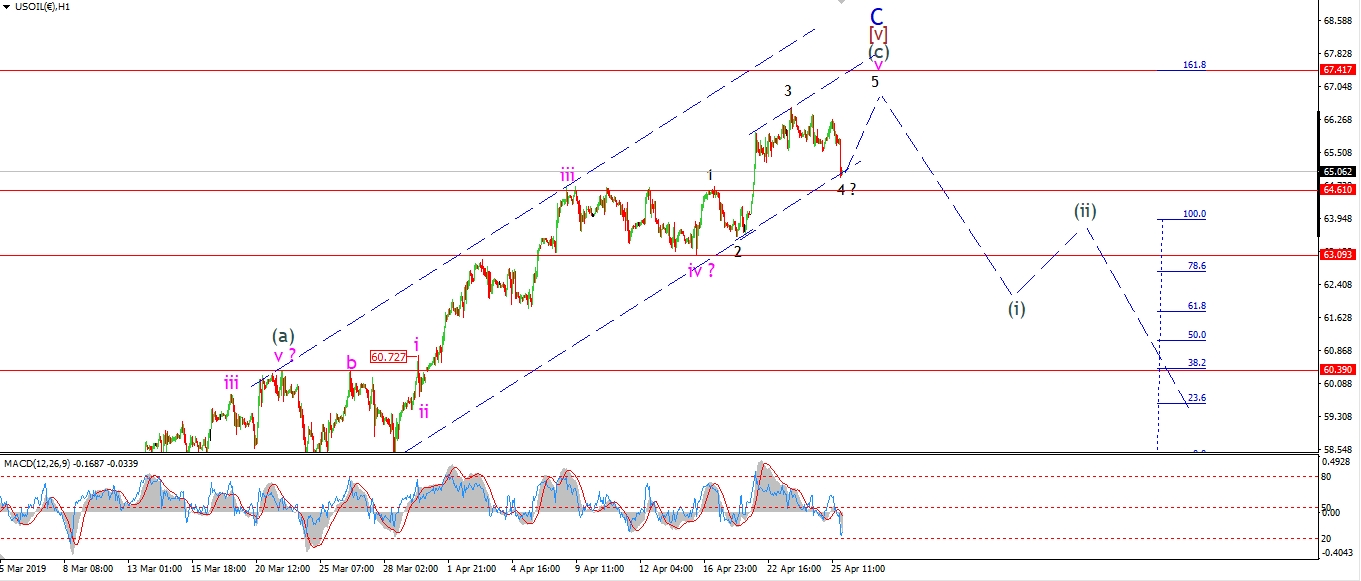 [/vc_column_text][/vc_column][vc_column width=”1/3″][vc_custom_heading text=”4 Hours” use_theme_fonts=”yes”][vc_column_text]
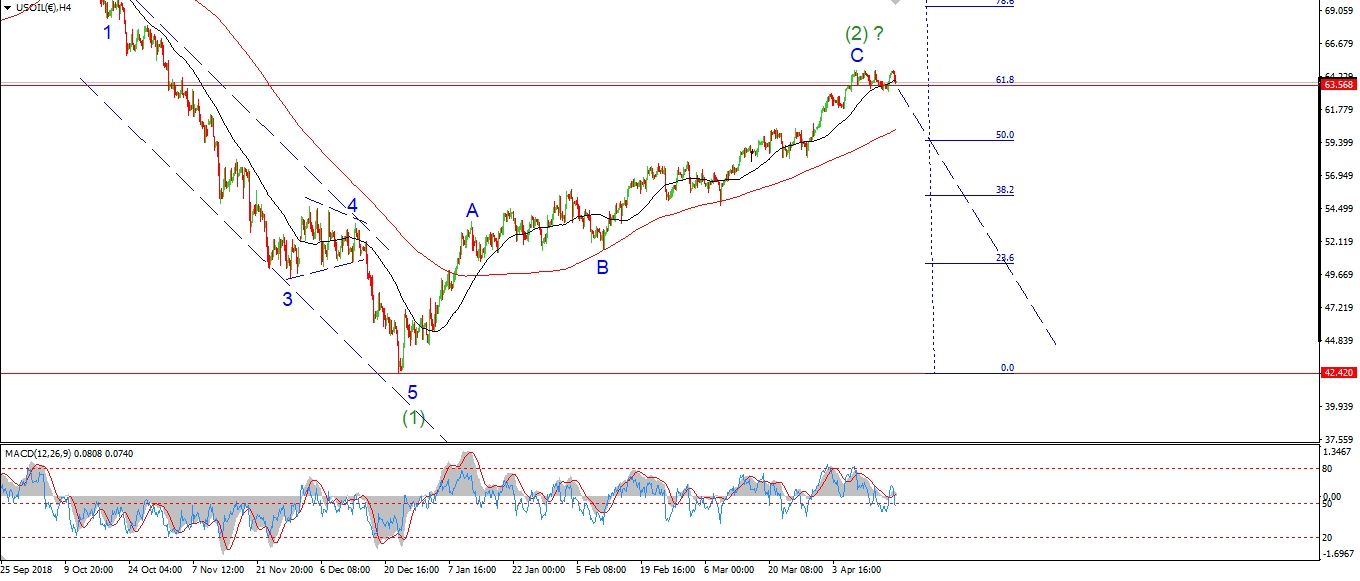 [/vc_column_text][vc_custom_heading text=”Daily” use_theme_fonts=”yes”][vc_column_text]
 [/vc_column_text][/vc_column][/vc_row]
[vc_row][vc_column][vc_column_text]
Crude is coming to the end of this large rally in wave (2) green.
Of this I am fairly confident.
The short term price action is harder to nail though.
Todays decline can be viewed as wave ‘4’ of ‘v’,
as shown on the short term chart.
This would allow for another high in wave ‘5’ to complete the structure.
There is always a caveat!
If the price continue to drop impulsively like today,
and breaks below the 63.00 handle again.
this will be clear signal that the top is in for crude in wave (2).
We can then work on wave wave (3) down again.
Tomorrow;
Watch for wave ‘4’ to hold above the high of wave ‘1’ at 64.61.
One more high in wave ‘5’ will close out wave ‘v’.
[/vc_column_text][/vc_column][/vc_row]
[/_s2If]
[_s2If current_user_can(access_s2member_ccap_us10yr)]
[vc_row][vc_column][vc_separator border_width=”5″][/vc_column][/vc_row][vc_row][vc_column][vc_column_text]
US 10 yr Treasuries.
[/vc_column_text][/vc_column][/vc_row][vc_row][vc_column][vc_separator border_width=”5″][/vc_column][/vc_row][vc_row][vc_column width=”2/3″][vc_custom_heading text=”1 hr” use_theme_fonts=”yes”][vc_column_text]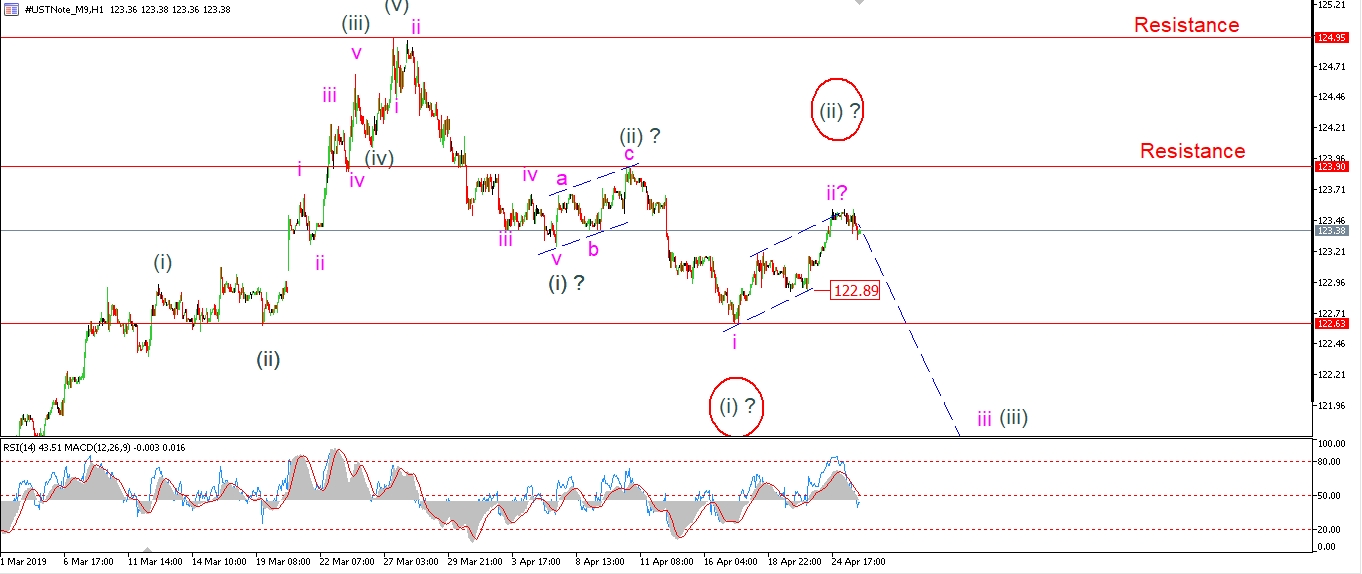 [/vc_column_text][/vc_column][vc_column width=”1/3″][vc_custom_heading text=”4 Hours” use_theme_fonts=”yes”][vc_column_text]
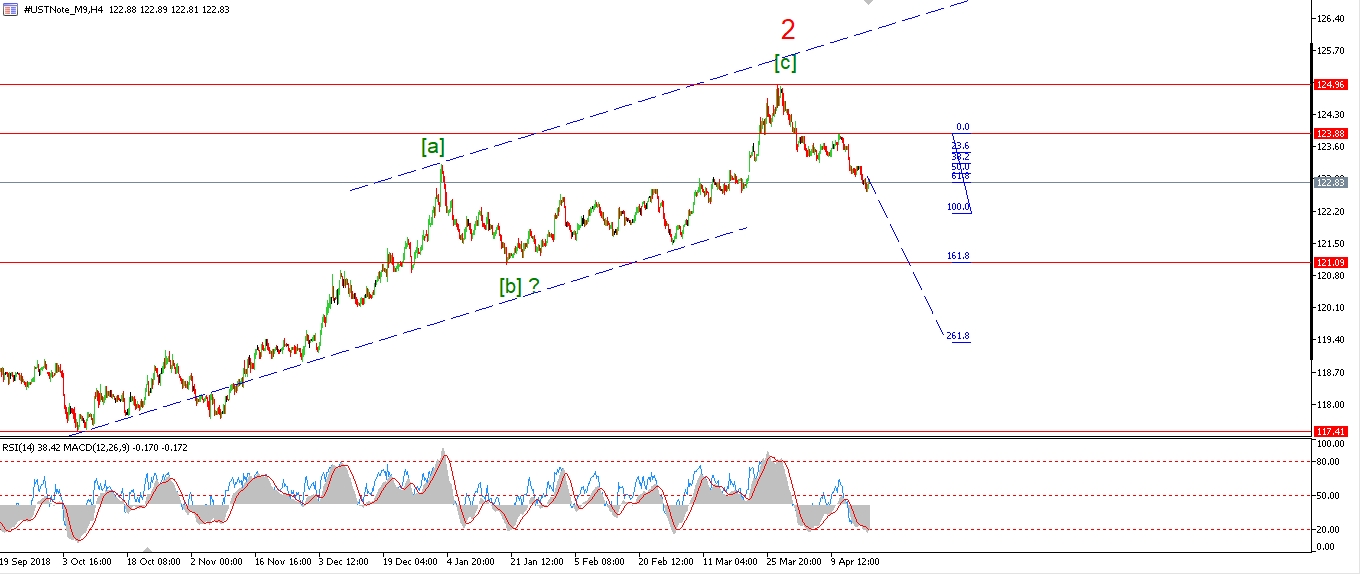 [/vc_column_text][vc_custom_heading text=”Daily” use_theme_fonts=”yes”][vc_column_text]
 [/vc_column_text][/vc_column][/vc_row]
[vc_row][vc_column][vc_column_text]
The price has drifted off the wave ‘ii’ high today
after completing a three wave correction this week.
The price must continue lower and break 122.89 again to signal wave ‘ii’ is complete.
A break of 122.63 again will confirm wave (iii) has begun.
Tomorrow;
Watch for wave (iii) to carry the price lower and begin to accelerate over the coming days.
Wave ‘iii’ of (iii) should hit 121.00 again with ease.
123.90 must hold from here.
[/vc_column_text][/vc_column][/vc_row]
[/_s2If]
[_s2If current_user_can(access_s2member_ccap_silver)]
[vc_row][vc_column][vc_separator border_width=”5″][/vc_column][/vc_row][vc_row][vc_column][vc_column_text]
SILVER
[/vc_column_text][/vc_column][/vc_row][vc_row][vc_column][vc_separator border_width=”5″][/vc_column][/vc_row][vc_row][vc_column width=”2/3″][vc_custom_heading text=”1 hr” use_theme_fonts=”yes”][vc_column_text]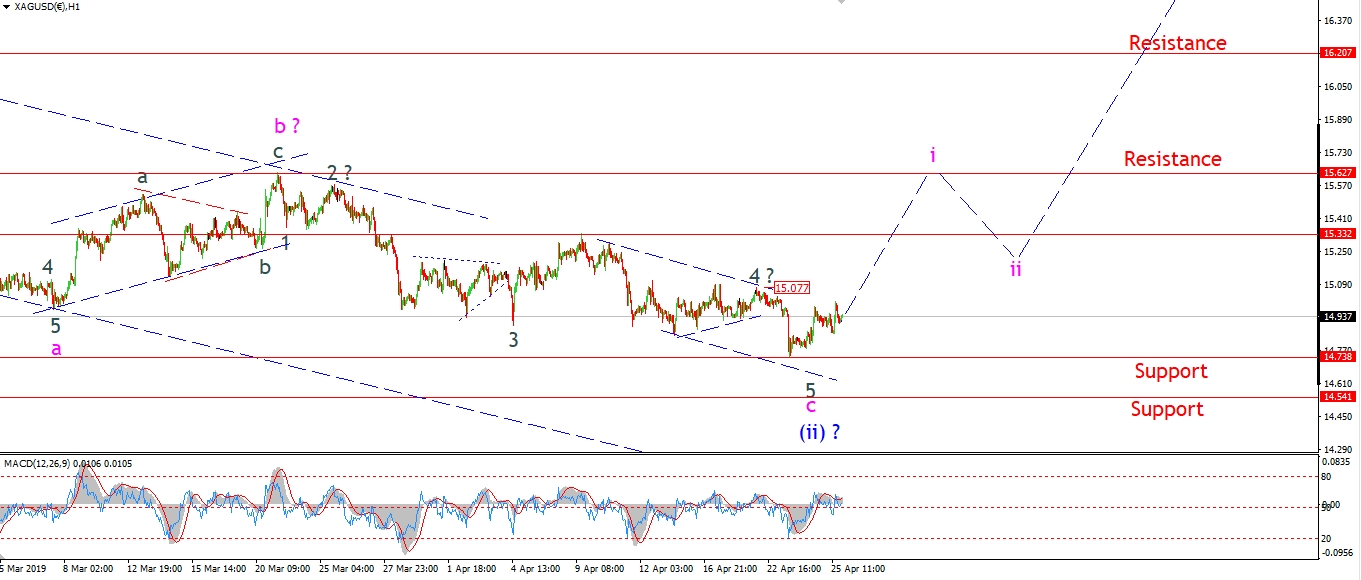 [/vc_column_text][/vc_column][vc_column width=”1/3″][vc_custom_heading text=”4 Hours” use_theme_fonts=”yes”][vc_column_text]
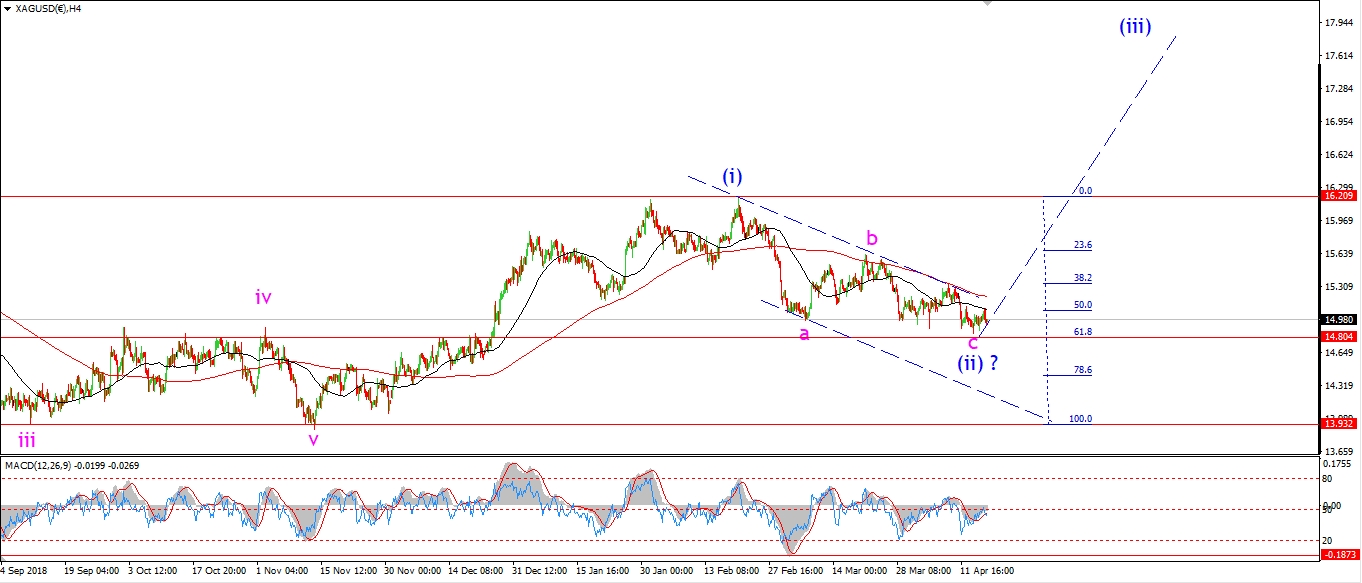 [/vc_column_text][vc_custom_heading text=”Daily” use_theme_fonts=”yes”][vc_column_text]
 [/vc_column_text][/vc_column][/vc_row]
[vc_row][vc_column][vc_column_text]
Silver is holding above the low at 14.73 so far.
I want to see a break above 15.07 again at the wave ‘4’ triangle.
This would add weight to the idea that the price has put in a significant low in wave (ii).
Tomorrow;
The price action has not developed impulsively yet,
so I want to see a further rally tomorrow in five waves.
If we see the correct action form,
then it is possible that next week will complete a bullish impulse wave,
And a bullish opportunity at the wave ‘ii’ low.
[/vc_column_text][/vc_column][/vc_row]
[/_s2If]
[_s2If current_user_can(access_s2member_ccap_sp500)]
[vc_row][vc_column][vc_separator border_width=”5″][/vc_column][/vc_row][vc_row][vc_column][vc_column_text]
S&P 500.
[/vc_column_text][/vc_column][/vc_row][vc_row][vc_column][vc_separator border_width=”5″][/vc_column][/vc_row][vc_row][vc_column width=”2/3″][vc_custom_heading text=”1 hr” use_theme_fonts=”yes”][vc_column_text]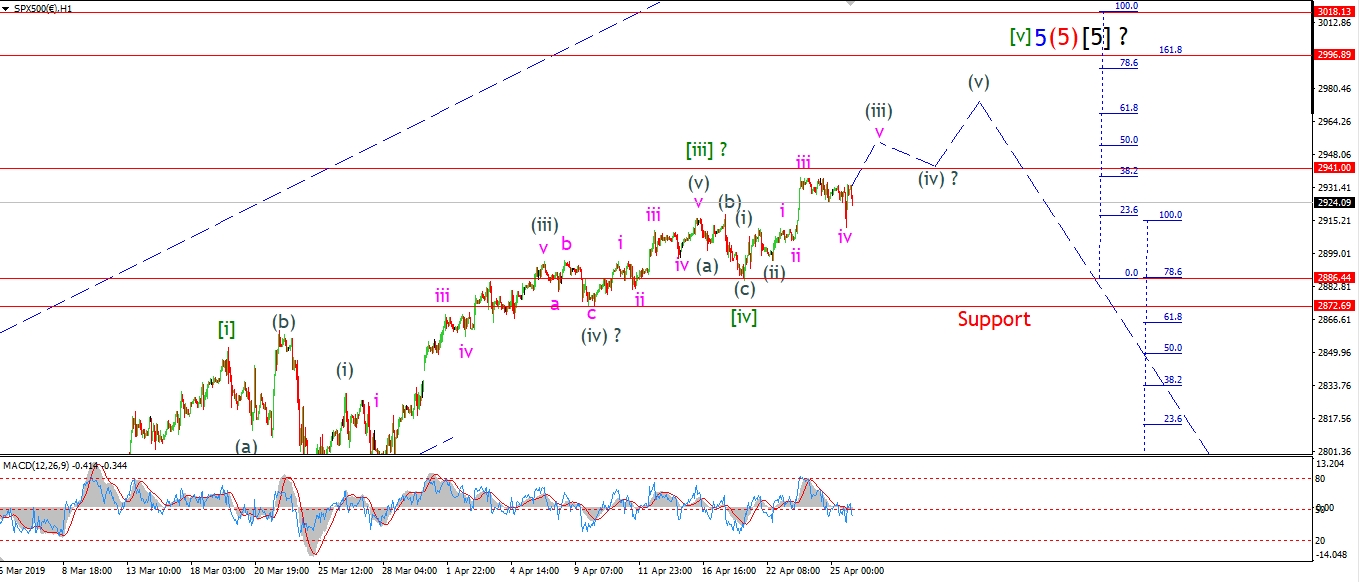 [/vc_column_text][/vc_column][vc_column width=”1/3″][vc_custom_heading text=”4 Hours” use_theme_fonts=”yes”][vc_column_text]
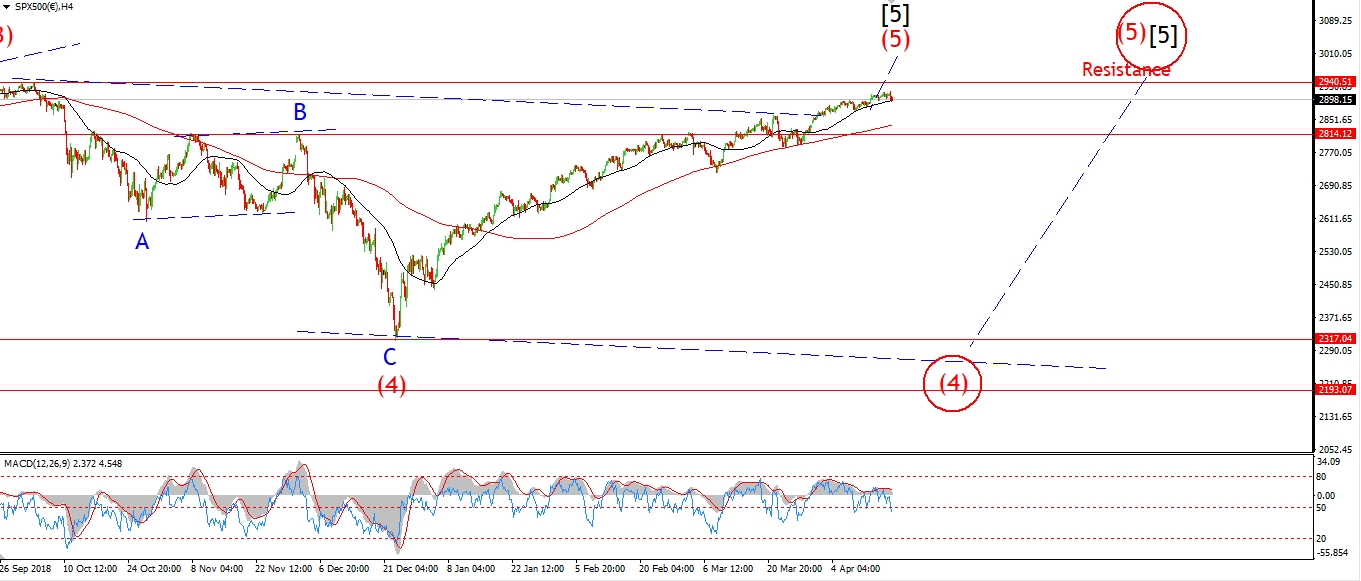 [/vc_column_text][vc_custom_heading text=”Daily” use_theme_fonts=”yes”][vc_column_text]
 [/vc_column_text][/vc_column][/vc_row]
[vc_row][vc_column][vc_column_text]
The S&P has recovered this mornings gap lower to close almost flat on the day.
This is a good sign that wave count is still on track for wave (iii).
This mornings low is viewed as wave ‘iv’ of (iii).
And the rebound rally this evening is labelled wave ‘v’.
the Nasdaq 100 made a new all time high today.
So the euphoria will probably spill over into the broader market also.
The price should continue to a new all time high over the coming week in wave (iii) of [v].
Tomorrow;
Watch for wave ‘v’ up to hold above 2913 and continue higher to complete the larger wave (iii).
[/vc_column_text][/vc_column][/vc_row]
[/_s2If]
[vc_row][vc_column][vc_column_text]
[/vc_column_text][/vc_column][/vc_row]
[vc_row][vc_column][vc_separator border_width=”5″][/vc_column][/vc_row]