
[vc_row][vc_column][vc_separator border_width=”5″][/vc_column][/vc_row]
[vc_row][vc_column][vc_column_text]
Hi everyone.
[/vc_column_text][/vc_column][/vc_row]
[_s2If current_user_can(access_s2member_ccap_eurusd)]
[vc_row][vc_column][vc_separator border_width=”5″][/vc_column][/vc_row]
[vc_row][vc_column][vc_column_text]
EURUSD
[/vc_column_text][/vc_column][/vc_row]
[vc_row][vc_column][vc_separator border_width=”5″][/vc_column][/vc_row][vc_row][vc_column width=”2/3″][vc_custom_heading text=”1 hr” use_theme_fonts=”yes”][vc_column_text]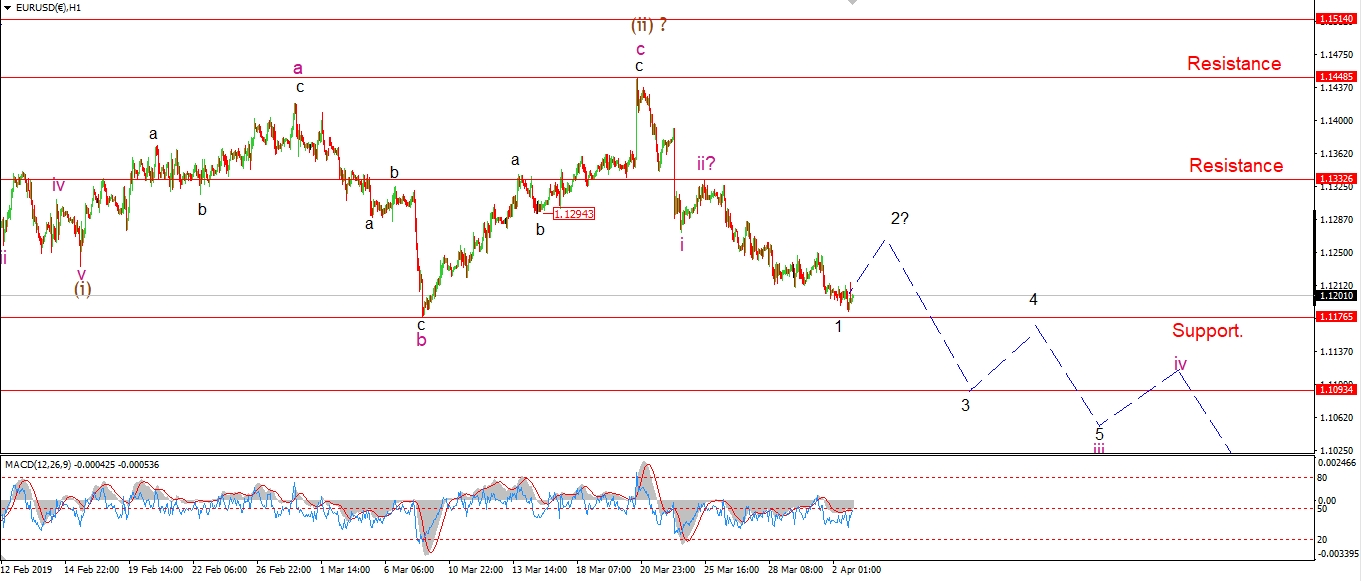 [/vc_column_text][/vc_column][vc_column width=”1/3″][vc_custom_heading text=”4 Hours” use_theme_fonts=”yes”][vc_column_text]
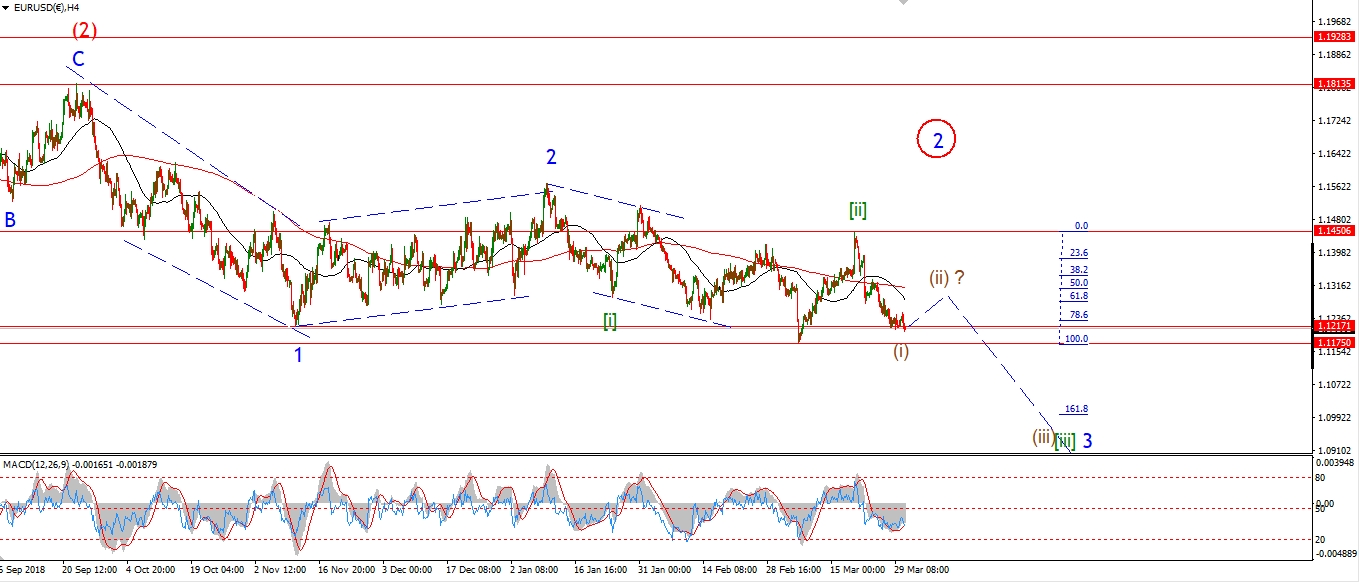 [/vc_column_text][vc_custom_heading text=”Daily” use_theme_fonts=”yes”][vc_column_text]
 [/vc_column_text][/vc_column][/vc_row]
[vc_row][vc_column][vc_column_text]
EURUSD continues to drift lower without any conviction today,
It’s almost like the market is on autopilot.
Give that I am expecting a drop in a third wave,
the action is not accelerating lower at all.
With that in mind,
I think we should allow for a larger correction higher in wave ‘2’ of ‘iii’
before the price breaks support and heads lower in ‘3’ of ‘iii’.
Tomorrow;
Watch for a further three wave correction higher in wave ‘2’ to complete below 1.1332.
[/vc_column_text][/vc_column][/vc_row]
[/_s2If]
[_s2If current_user_can(access_s2member_ccap_gbpusd)]
[vc_row][vc_column][vc_separator border_width=”5″][/vc_column][/vc_row][vc_row][vc_column][vc_column_text]
GBPUSD
[/vc_column_text][/vc_column][/vc_row][vc_row][vc_column][vc_separator border_width=”5″][/vc_column][/vc_row][vc_row][vc_column width=”2/3″][vc_custom_heading text=”1 hr” use_theme_fonts=”yes”][vc_column_text]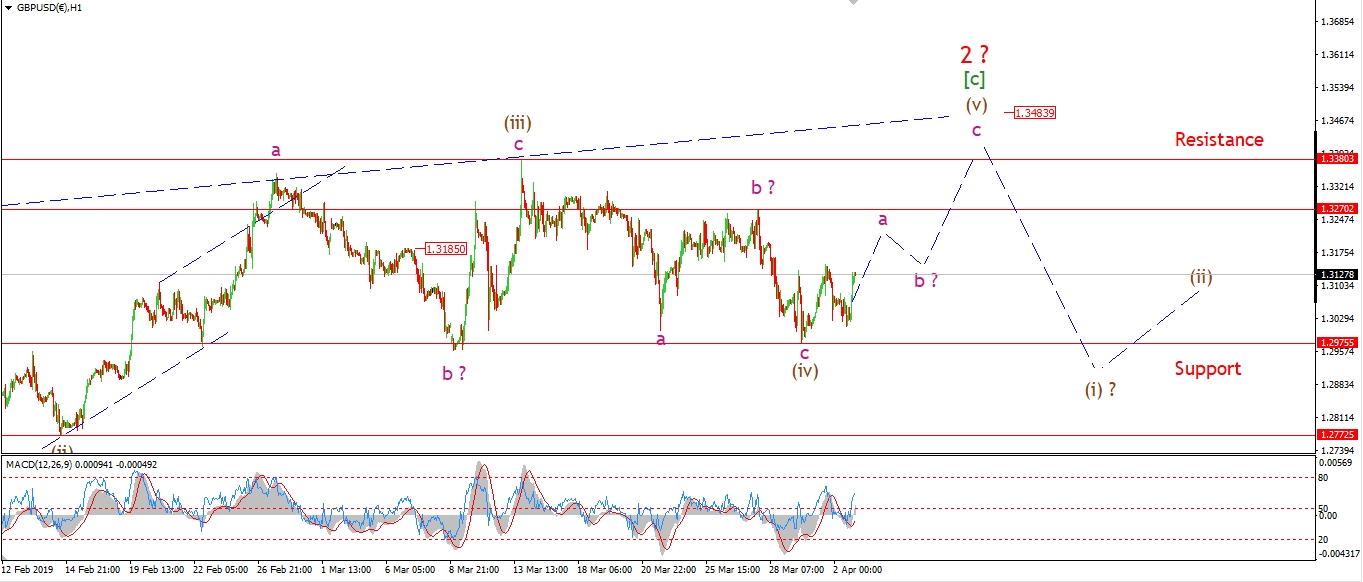 [/vc_column_text][/vc_column][vc_column width=”1/3″][vc_custom_heading text=”4 Hours” use_theme_fonts=”yes”][vc_column_text]
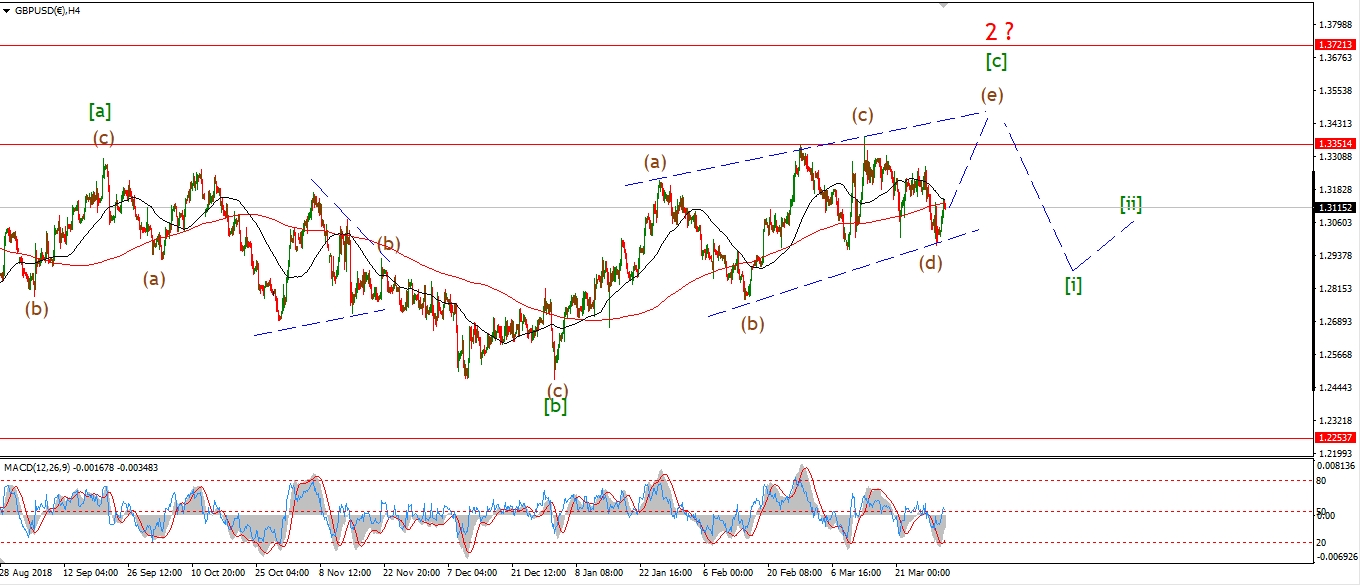 [/vc_column_text][vc_custom_heading text=”Daily” use_theme_fonts=”yes”][vc_column_text]
 [/vc_column_text][/vc_column][/vc_row]
[vc_row][vc_column][vc_column_text]
Cable dropped earlier today as part of a three wave structure higher in wave ‘a’ of (v).
If I am correct here,
Wave (v) will trace out a three wave flat.
And that flat pattern will take a 3,3,5 form higher.
Tomorrow;
support at 1.2975 must hold and wave (v) should continue higher in three waves.
[/vc_column_text][/vc_column][/vc_row]
[/_s2If]
[_s2If current_user_can(access_s2member_ccap_usdjpy)]
[vc_row][vc_column][vc_separator border_width=”5″][/vc_column][/vc_row][vc_row][vc_column][vc_column_text]
USDJPY
[/vc_column_text][/vc_column][/vc_row][vc_row][vc_column][vc_separator border_width=”5″][/vc_column][/vc_row][vc_row][vc_column width=”2/3″][vc_custom_heading text=”1 hr” use_theme_fonts=”yes”][vc_column_text]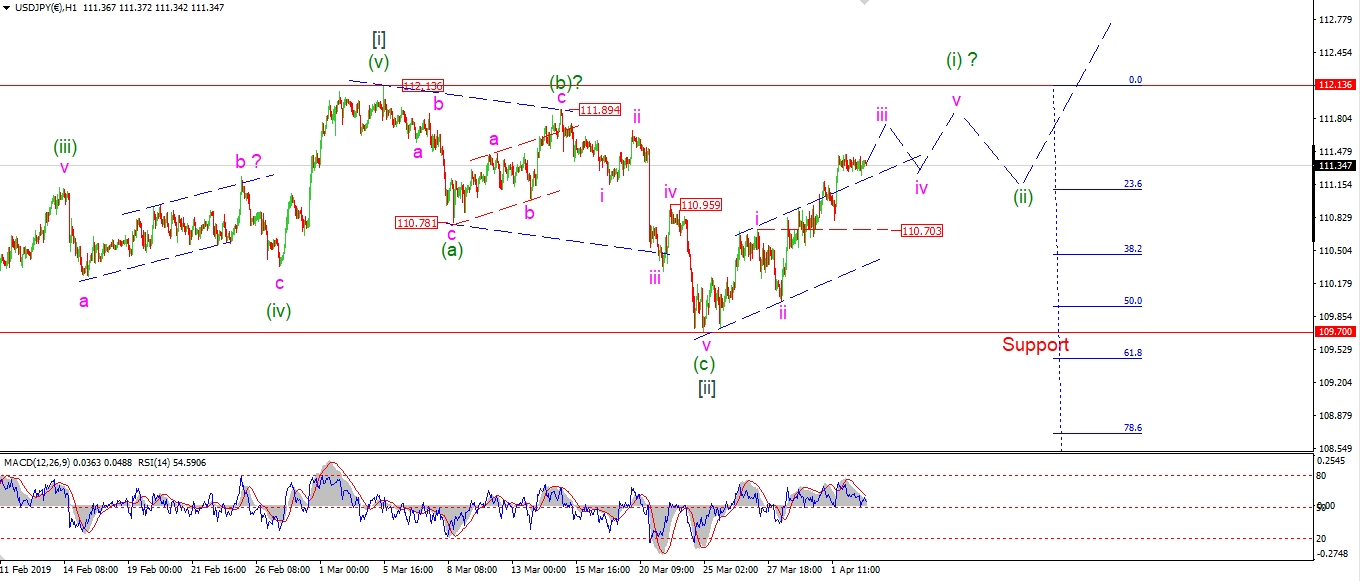 [/vc_column_text][/vc_column][vc_column width=”1/3″][vc_custom_heading text=”4 Hours” use_theme_fonts=”yes”][vc_column_text]
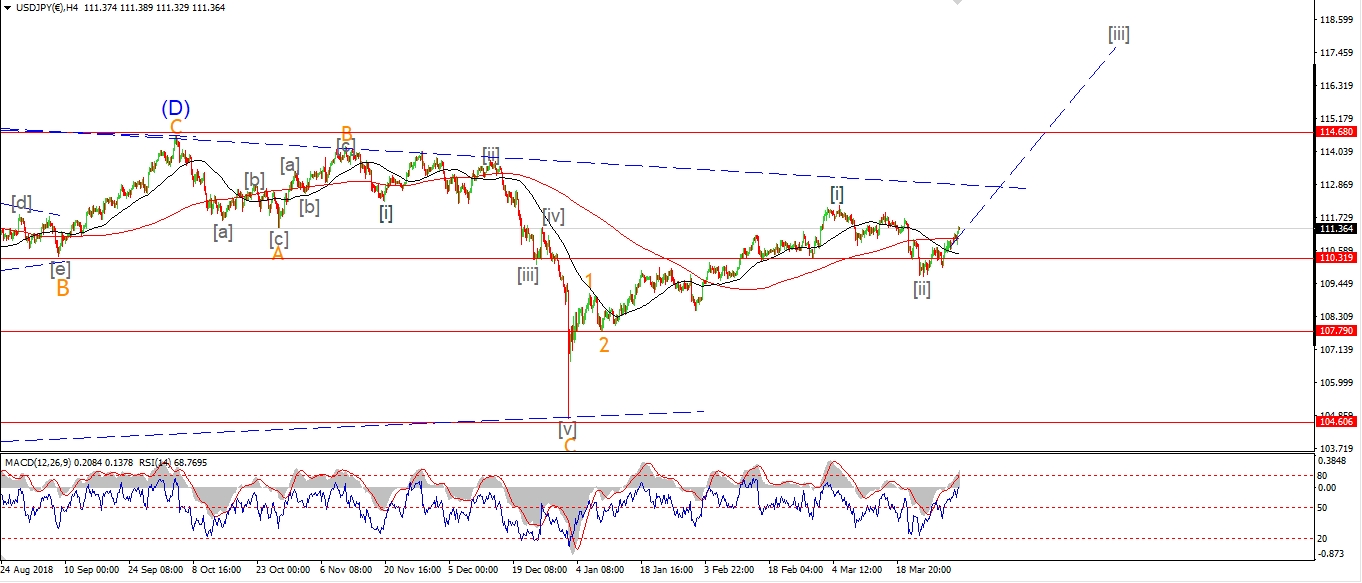 [/vc_column_text][vc_custom_heading text=”Daily” use_theme_fonts=”yes”][vc_column_text]
 [/vc_column_text][/vc_column][/vc_row]
[vc_row][vc_column][vc_column_text]
USDJPY has broke out above the rising trend channel off the lows at wave [ii].
The price is rising in a possible wave (i) of [iii].
And todays action is likely a corrective fourth wave within wave ‘iii’ of (i)!
Wave ‘iii’ should continue higher towards 112.00 before correcting in wave ‘iv’ of (i).
The price must hold above 110.70 for the remainder of wave (i).
Tomorrow;
Watch for wave ‘iii’ to complete at or near 112.00 and begin to correct in wave ‘iv’.
[/vc_column_text][/vc_column][/vc_row]
[/_s2If]
[_s2If current_user_can(access_s2member_ccap_dow_jones)]
[vc_row][vc_column][vc_separator border_width=”5″][/vc_column][/vc_row][vc_row][vc_column][vc_column_text]
DOW JONES INDUSTRIALS
[/vc_column_text][/vc_column][/vc_row][vc_row][vc_column][vc_separator border_width=”5″][/vc_column][/vc_row][vc_row][vc_column width=”2/3″][vc_custom_heading text=”1 hr” use_theme_fonts=”yes”][vc_column_text]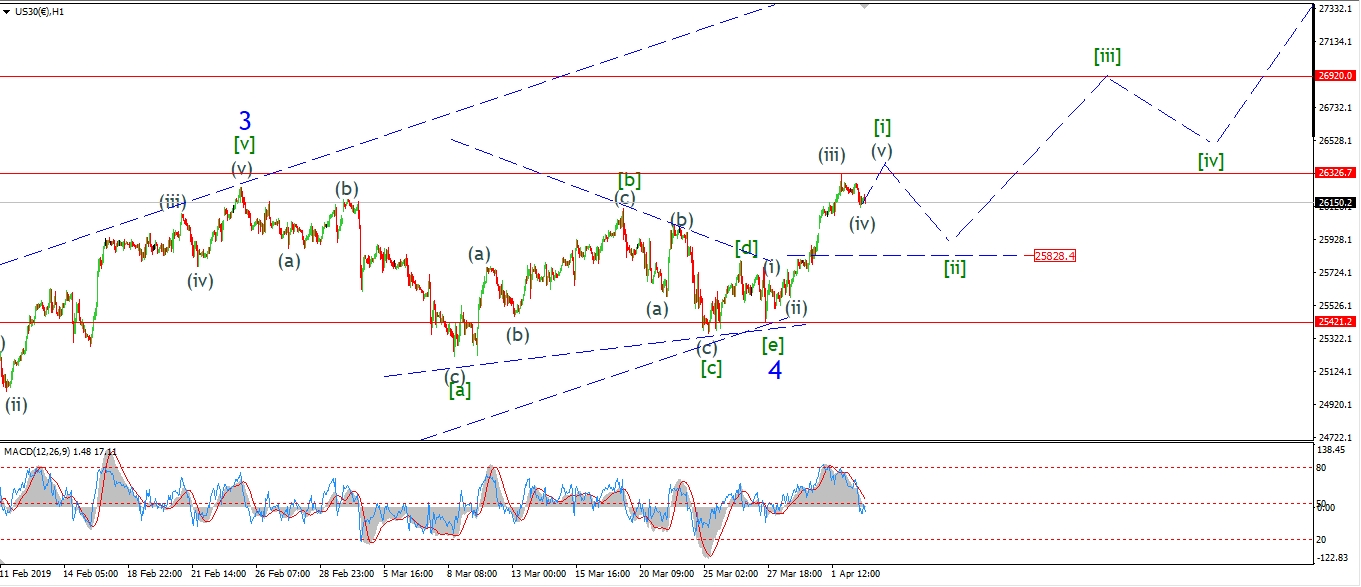 [/vc_column_text][/vc_column][vc_column width=”1/3″][vc_custom_heading text=”4 Hours” use_theme_fonts=”yes”][vc_column_text]
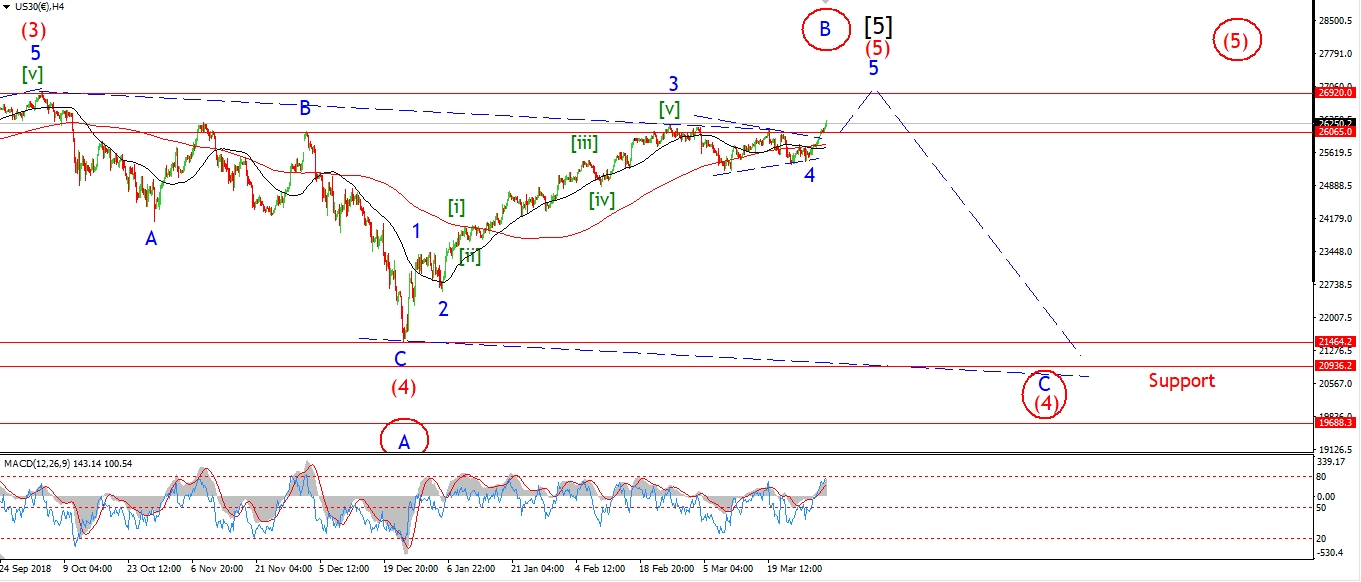 [/vc_column_text][vc_custom_heading text=”Daily” use_theme_fonts=”yes”][vc_column_text]
 [/vc_column_text][/vc_column][/vc_row]
[vc_row][vc_column][vc_column_text]
Todays downside action is in three waves off the wave (iii) high.
This is viewed as correction in wave (iv) of [i] of ‘5’.
Once wave (iv) completes,
then wave (v) should rally back towards 26500 to complete wave [i].
If the price continues this decline over the coming days
and reaches the 25800 area in a three wave form,
that will signal that wave [ii] is already complete.
And then we can prepare for a rally in wave [iii] of ‘5’ of (5) sooner than expected.
Either way,
the market is likely preparing for the final blow off high now
to put in the final top of the whole bull market.
It been 10 years in the making,
whats another few weeks!
Tomorrow;
Watch for wave (v) of [i] to begin and rally above 26326 again.
[/vc_column_text][/vc_column][/vc_row]
[/_s2If]
[_s2If current_user_can(access_s2member_ccap_gold)]
[vc_row][vc_column][vc_separator border_width=”5″][/vc_column][/vc_row][vc_row][vc_column][vc_column_text]
GOLD
[/vc_column_text][/vc_column][/vc_row][vc_row][vc_column][vc_separator border_width=”5″][/vc_column][/vc_row][vc_row][vc_column width=”2/3″][vc_custom_heading text=”1 hr” use_theme_fonts=”yes”][vc_column_text]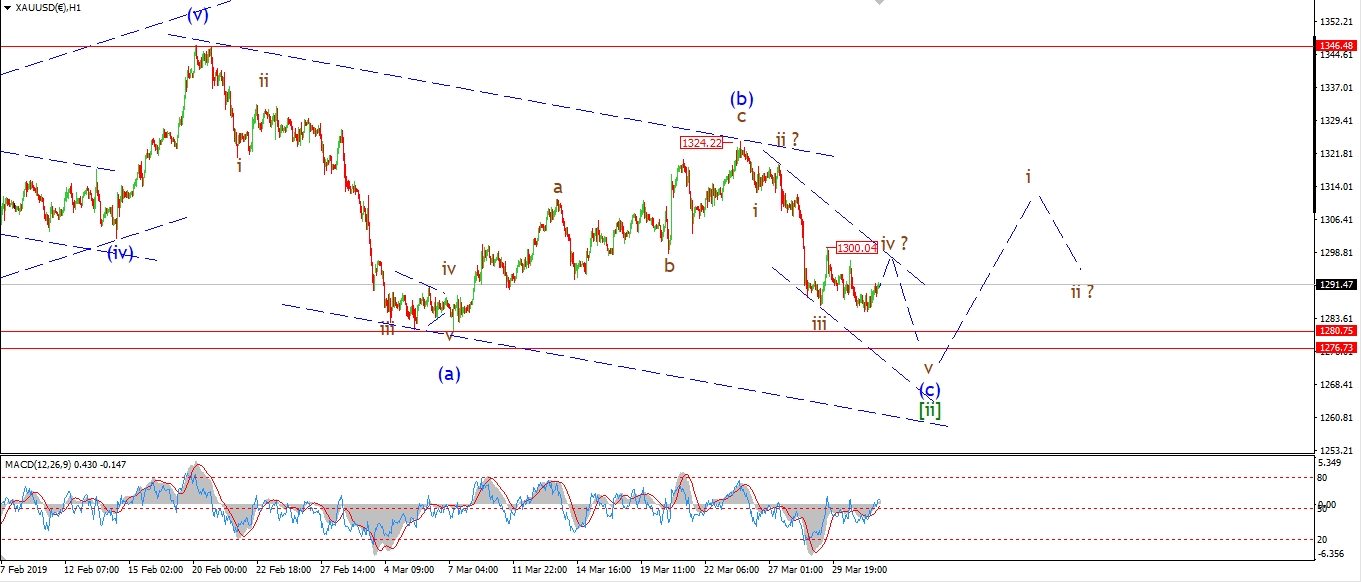 [/vc_column_text][/vc_column][vc_column width=”1/3″][vc_custom_heading text=”4 Hours” use_theme_fonts=”yes”][vc_column_text]
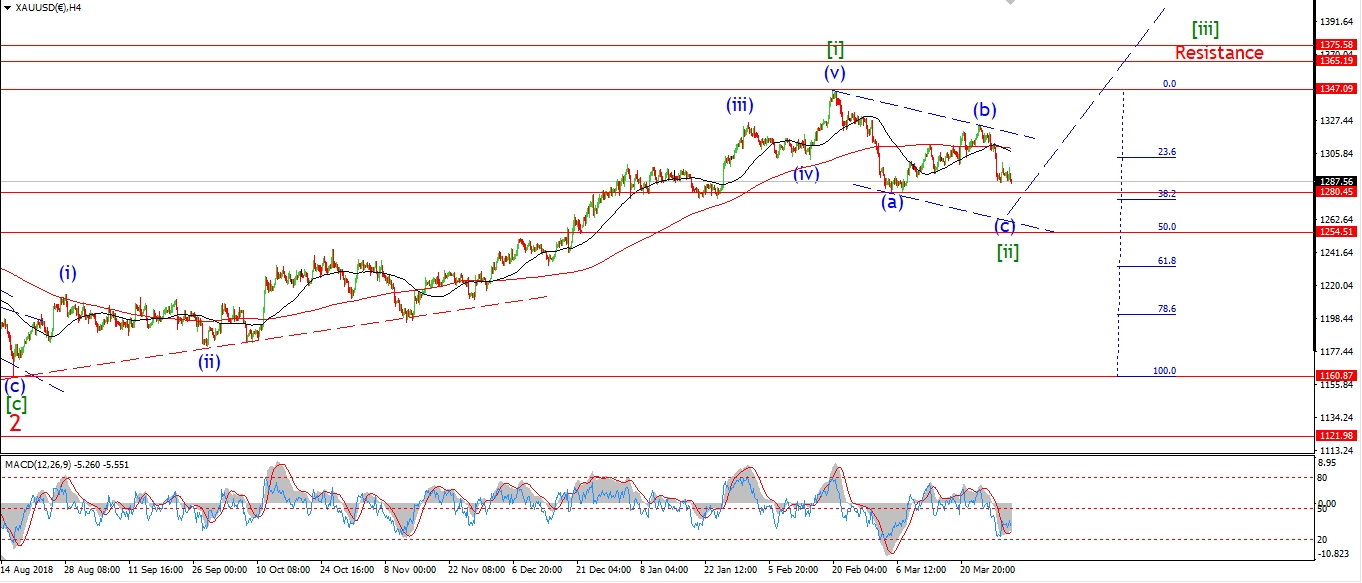 [/vc_column_text][vc_custom_heading text=”Daily” use_theme_fonts=”yes”][vc_column_text]
 [/vc_column_text][/vc_column][/vc_row]
[vc_row][vc_column][vc_column_text]
The price has fallen in three waves off 1300 over the last few days.
This suggests wave ‘iv’ is still underway.
And the decline off 1300 is an internal ‘b’ wave,
with another rise in wave ‘c’ of ‘iv’ left before completing.
Wave ‘v’ down is still expected to make a final low in the area of 1280 to complete wave (c),
but for now,
Wave ‘iv’ is still in force.
Tomorrow;
Watch for an expanded flat correction in wave ‘iv’ to hit 1300 again before turning down in wave ‘v’.
[/vc_column_text][/vc_column][/vc_row]
[/_s2If]
[_s2If current_user_can(access_s2member_ccap_crude)]
[vc_row][vc_column][vc_separator border_width=”5″][/vc_column][/vc_row][vc_row][vc_column][vc_column_text]
U.S CRUDE OIL
[/vc_column_text][/vc_column][/vc_row][vc_row][vc_column][vc_separator border_width=”5″][/vc_column][/vc_row][vc_row][vc_column width=”2/3″][vc_custom_heading text=”1 hr” use_theme_fonts=”yes”][vc_column_text]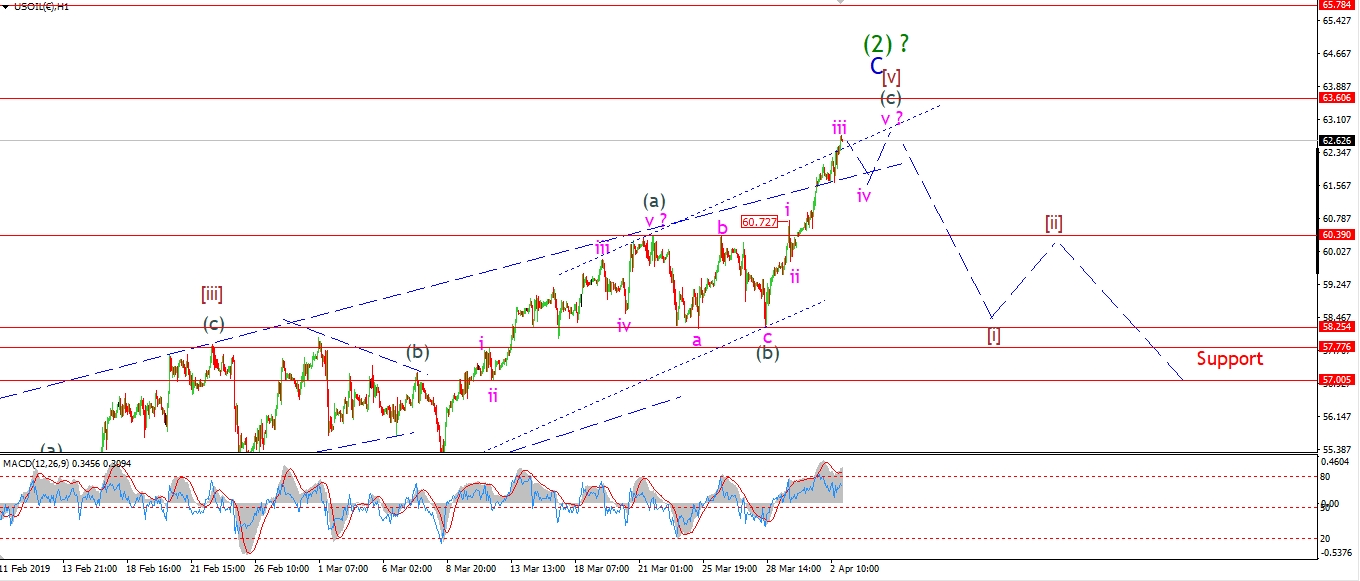 [/vc_column_text][/vc_column][vc_column width=”1/3″][vc_custom_heading text=”4 Hours” use_theme_fonts=”yes”][vc_column_text]
 [/vc_column_text][vc_custom_heading text=”Daily” use_theme_fonts=”yes”][vc_column_text]
 [/vc_column_text][/vc_column][/vc_row]
[vc_row][vc_column][vc_column_text]
Crude is racing towards that Fibonacci retracement level at 63.60.
the market had another up day in wave ‘iii’ of (c) of [v].
The price broke out above two trend lines today.
This should not be mistaken as a ‘break out day’ for crude,
although I’m sure that it exactly what the news will interpret the action as.
Rather,
todays is a maximum upside momentum day in the final leg of a correction.
The market should begin to form a rolling top again on the hourly chart.
As we cycle through waves ‘iv’ and ‘v’ of (c).
Tomorrow;
Watch for a cooling off in wave ‘iv’ tomorrow,
this correction should hold above 60.72 at the wave ‘i’ high.
[/vc_column_text][/vc_column][/vc_row]
[/_s2If]
[_s2If current_user_can(access_s2member_ccap_us10yr)]
[vc_row][vc_column][vc_separator border_width=”5″][/vc_column][/vc_row][vc_row][vc_column][vc_column_text]
US 10 yr Treasuries.
[/vc_column_text][/vc_column][/vc_row][vc_row][vc_column][vc_separator border_width=”5″][/vc_column][/vc_row][vc_row][vc_column width=”2/3″][vc_custom_heading text=”1 hr” use_theme_fonts=”yes”][vc_column_text]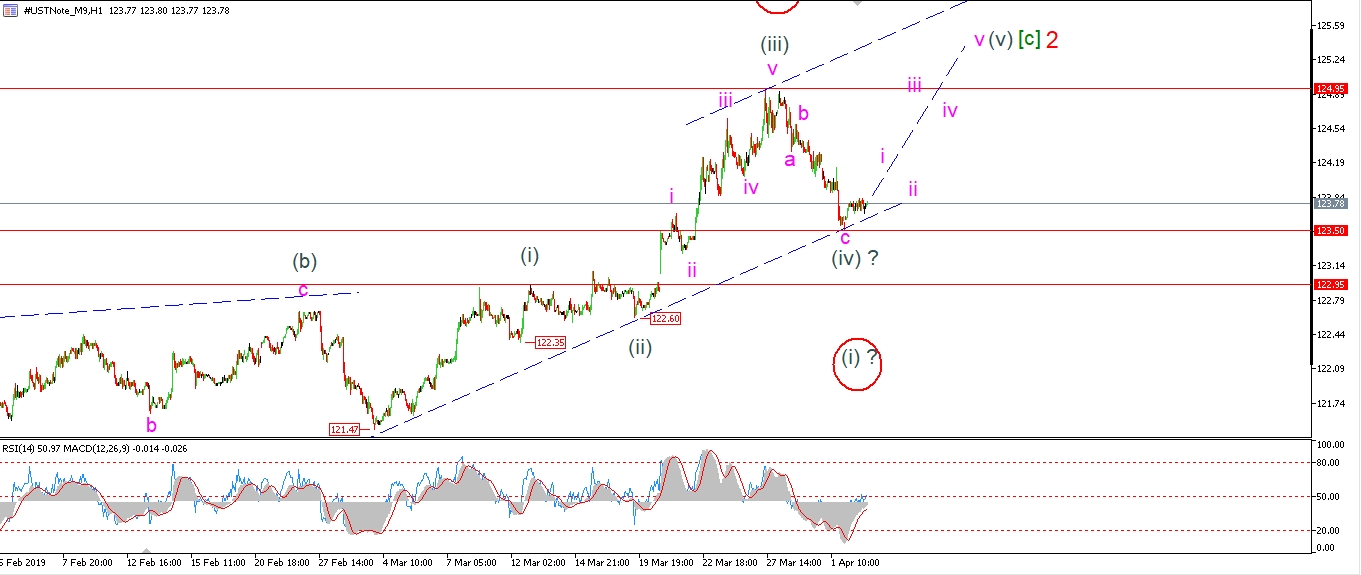 [/vc_column_text][/vc_column][vc_column width=”1/3″][vc_custom_heading text=”4 Hours” use_theme_fonts=”yes”][vc_column_text]
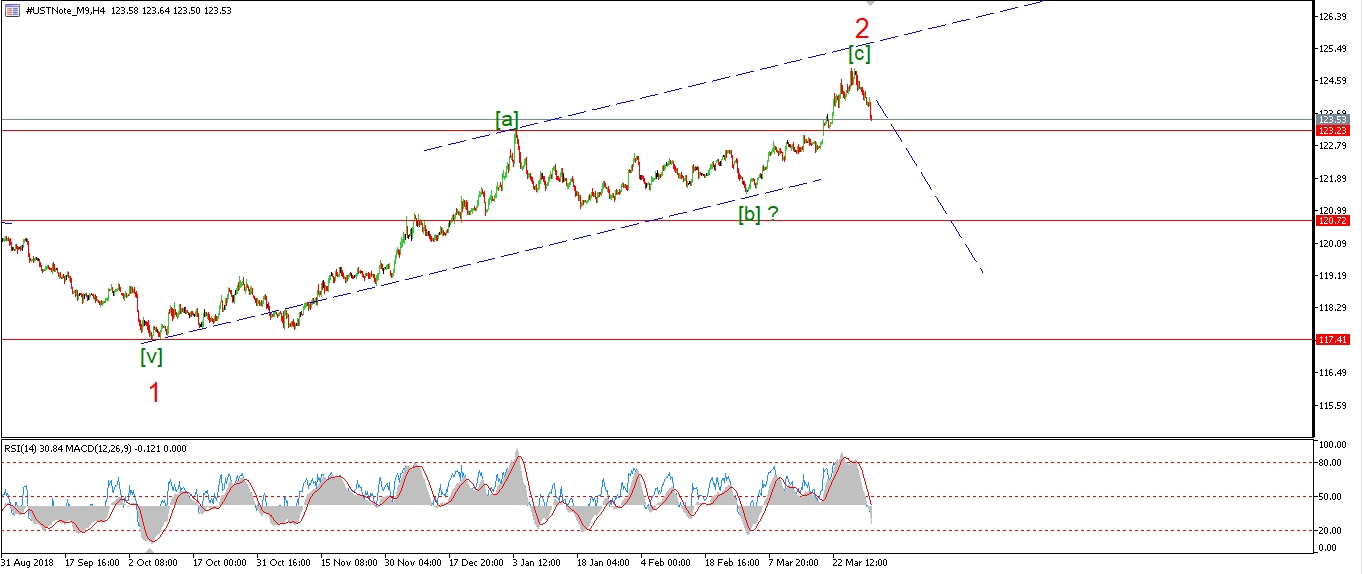 [/vc_column_text][vc_custom_heading text=”Daily” use_theme_fonts=”yes”][vc_column_text]
 [/vc_column_text][/vc_column][/vc_row]
[vc_row][vc_column][vc_column_text]
We are going to have to see a larger move higher off wave (iv) over the coming days
to stick with the idea of another high in wave (v) to complete wave ‘2’.
Bonds were flat today off the recent low,
And if we see another drop to the low 123’s over the coming days,
that will really favor the alternate count.
A corrective rally in three waves
off these lows will confirm the alternate count.
And we can then expect a larger decline in wave ‘3’ to begin finally!
Tomorrow;
A push back above 124.00 in wave ‘i’ will save the current wave count for now.
watch for 123.50 to hold.
[/vc_column_text][/vc_column][/vc_row]
[/_s2If]
[_s2If current_user_can(access_s2member_ccap_silver)]
[vc_row][vc_column][vc_separator border_width=”5″][/vc_column][/vc_row][vc_row][vc_column][vc_column_text]
SILVER
[/vc_column_text][/vc_column][/vc_row][vc_row][vc_column][vc_separator border_width=”5″][/vc_column][/vc_row][vc_row][vc_column width=”2/3″][vc_custom_heading text=”1 hr” use_theme_fonts=”yes”][vc_column_text]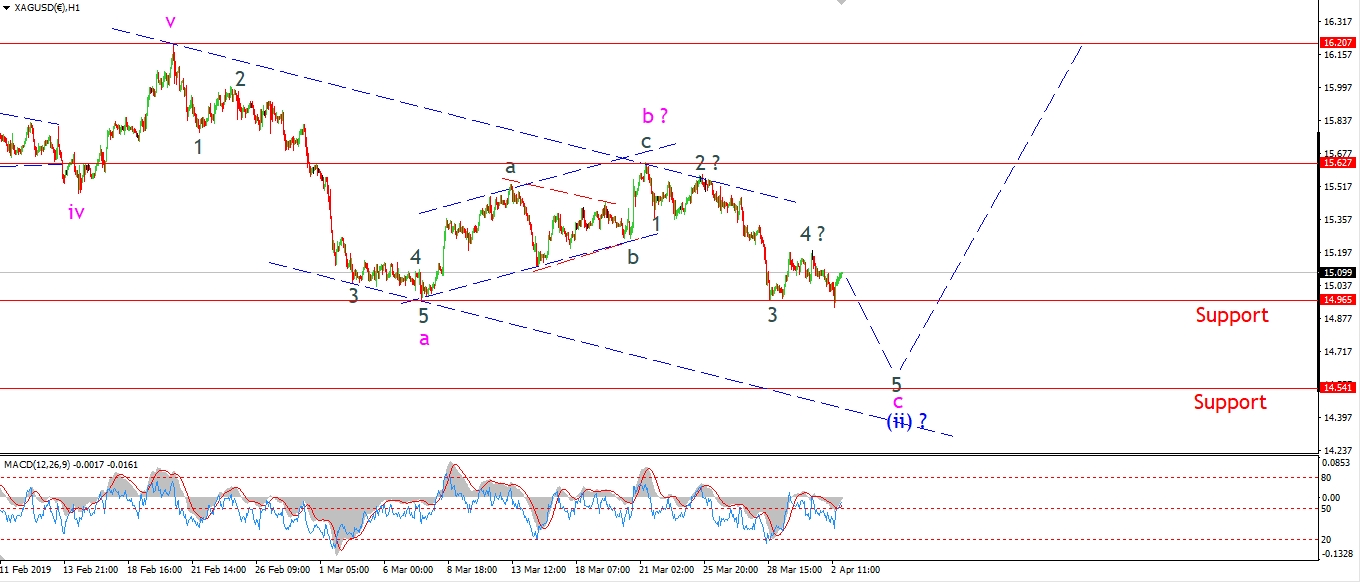 [/vc_column_text][/vc_column][vc_column width=”1/3″][vc_custom_heading text=”4 Hours” use_theme_fonts=”yes”][vc_column_text]
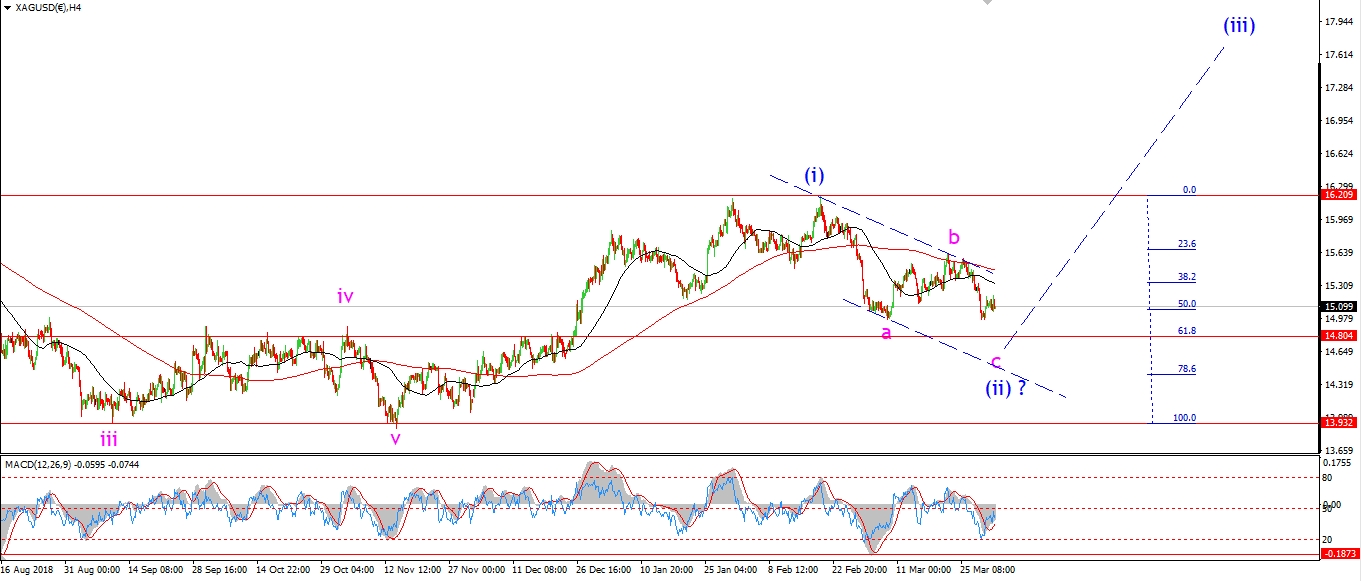 [/vc_column_text][vc_custom_heading text=”Daily” use_theme_fonts=”yes”][vc_column_text]
 [/vc_column_text][/vc_column][/vc_row]
[vc_row][vc_column][vc_column_text]
Silver may now be moving lower in wave ‘5’ of ‘c’ of (ii)
after a drop below the recent wave ‘3’ low at 14.96 today.
We have reached the minimum target at todays lows with a break of that previous wave ‘a’ low,
But I suspect wave ‘5’ will continue lower tomorrow,
towards that lower trend channel line again to finish the pattern.
I will note that 4hr momentum has already created a double bottom at the extreme oversold level.
And is moving higher again.
the price should follow soon enough.
Tomorrow;
watch for wave ‘5’ to drop into about 14.50 over the coming days.
[/vc_column_text][/vc_column][/vc_row]
[/_s2If]
[_s2If current_user_can(access_s2member_ccap_sp500)]
[vc_row][vc_column][vc_separator border_width=”5″][/vc_column][/vc_row][vc_row][vc_column][vc_column_text]
S&P 500.
[/vc_column_text][/vc_column][/vc_row][vc_row][vc_column][vc_separator border_width=”5″][/vc_column][/vc_row][vc_row][vc_column width=”2/3″][vc_custom_heading text=”1 hr” use_theme_fonts=”yes”][vc_column_text]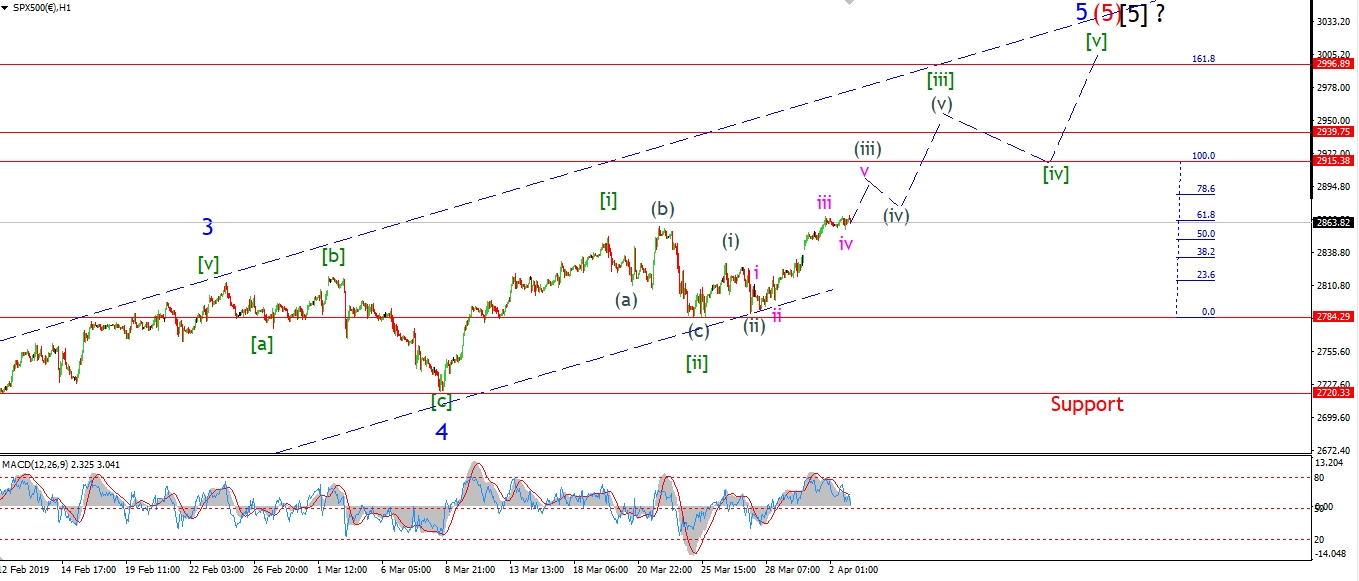 [/vc_column_text][/vc_column][vc_column width=”1/3″][vc_custom_heading text=”4 Hours” use_theme_fonts=”yes”][vc_column_text]
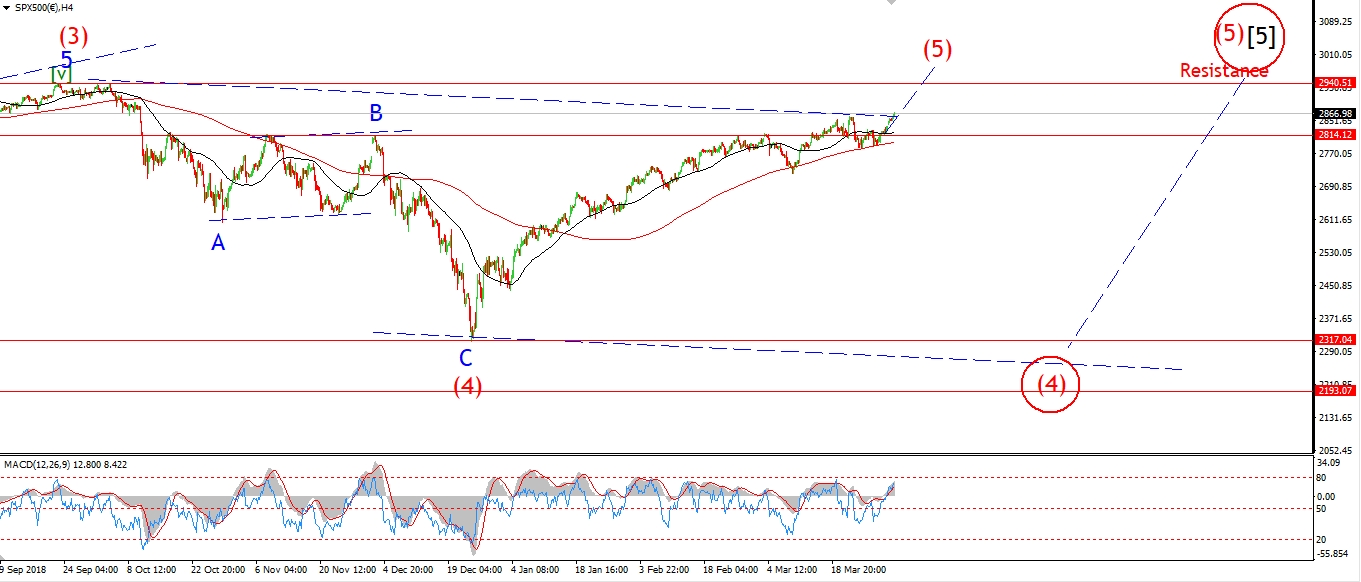 [/vc_column_text][vc_custom_heading text=”Daily” use_theme_fonts=”yes”][vc_column_text]
 [/vc_column_text][/vc_column][/vc_row]
[vc_row][vc_column][vc_column_text]
I have labelled todays small sideways correction as wave ‘iv’ of (iii) of [iii].
the market should now begin a series of fourth and fifth waves over the coming weeks.
this will carry the market higher,
but will also serve to kill upside momentum completely on the 4hr chart.
Wave (iii) of [iii] needs another push up to 2900 again to complete a five wave form.
That should happen by Friday.
The minimum target for wave [iii] at one larger degree lies at 2915,
this is where wave [iii] reaches equality with wave [i].
Tomorrow;
Watch for another push higher in wave ‘v’ to complete wave (iii).
[/vc_column_text][/vc_column][/vc_row]
[/_s2If]
[vc_row][vc_column][vc_column_text]
[/vc_column_text][/vc_column][/vc_row]
[vc_row][vc_column][vc_separator border_width=”5″][/vc_column][/vc_row]