
[vc_row][vc_column][vc_separator border_width=”5″][/vc_column][/vc_row]
[vc_row][vc_column][vc_column_text]
Hello everyone.
Here is the best bubble story of the year so far.
This one has froth pouring out over the rim!
Uber to Seal $3.1 Billion Deal to Buy Careem This Week
Careem is a taxi app.
As far as I can see, the company does not make a profit.
In fact they don’t come anywhere near making a profit, going on the amount of money they continually have to raise in round after round of funding.
They had to tap investors for another 200M last October!
Heres the fun part;
they are being bought by UBER.
Now UBER only lost 1.8 Billion in 2018,
but that is better than 2017 where they only lost 2.2 billion.
Which is very good, according to the generally accepted bubble standards set forth by the FED each year!
So to sum it all up.
One multi billion $ loss making company buys another multi hundred million $ loss making company for the bargain sum of $3.1 Billion.
The more you loose, the bigger the valuation your company gets.
Now UBER plans to go public on the Nasdaq later this year where they are set to raise another chunk of billions that they plan to lose next year!
What could possibly go wrong with this match made in bubble heaven.
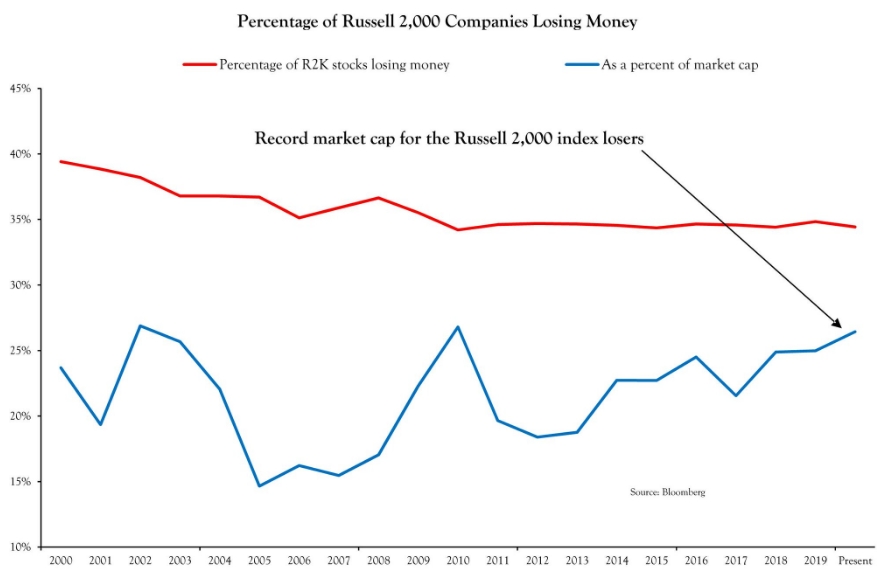
Now check out this chart showing a record market cap for companies that loose money in the Russell 2000.
This mania is ending,
like all other manias before it have ended.
I for one, am not looking forward to the reckoning…….
[/vc_column_text][/vc_column][/vc_row]
[_s2If current_user_can(access_s2member_ccap_eurusd)]
[vc_row][vc_column][vc_separator border_width=”5″][/vc_column][/vc_row]
[vc_row][vc_column][vc_column_text]
EURUSD
[/vc_column_text][/vc_column][/vc_row]
[vc_row][vc_column][vc_separator border_width=”5″][/vc_column][/vc_row][vc_row][vc_column width=”2/3″][vc_custom_heading text=”1 hr” use_theme_fonts=”yes”][vc_column_text]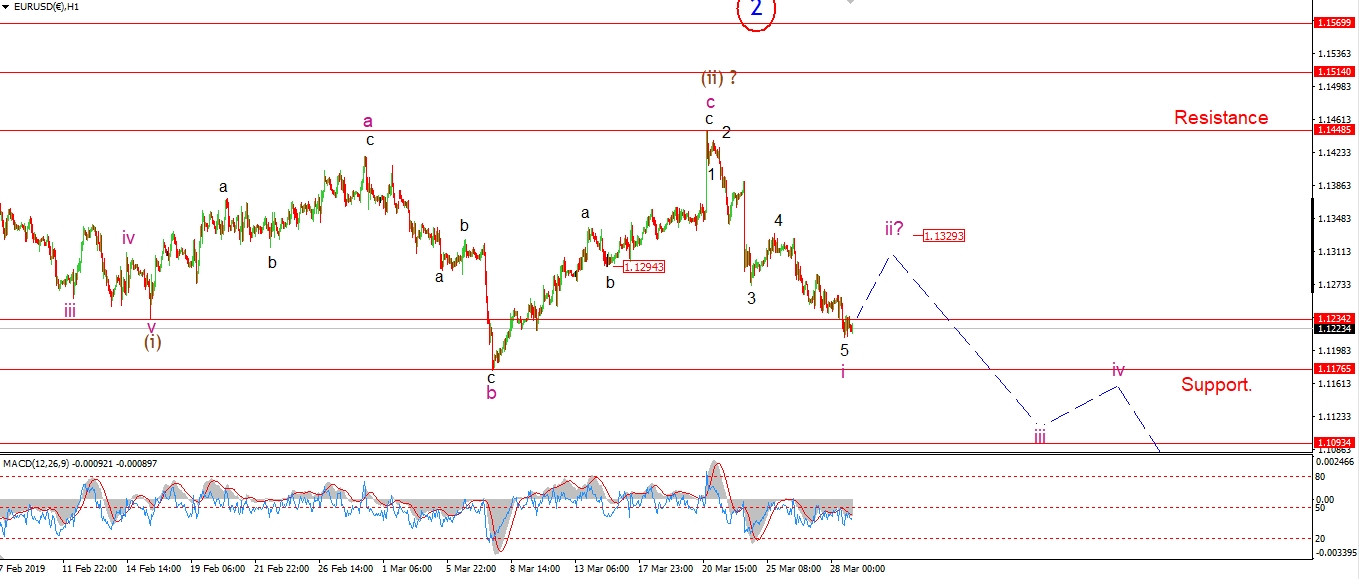 [/vc_column_text][/vc_column][vc_column width=”1/3″][vc_custom_heading text=”4 Hours” use_theme_fonts=”yes”][vc_column_text]
 [/vc_column_text][vc_custom_heading text=”Daily” use_theme_fonts=”yes”][vc_column_text]
 [/vc_column_text][/vc_column][/vc_row]
[vc_row][vc_column][vc_column_text]
The decline continues today in EURUSD,
but I think we are at an end to wave ‘i’ down now.
The price action is starting to look a little undecided and short term momentum is diverging.
So we are likely to see a counter trend rally in wave ‘ii’ begin tomorrow.
This rise should be in three waves and hit the price area of the previous fourth wave at about 1.1330 to complete.
Tomorrow;
Watch for a rise back above 1.1270 again in wave ‘a’ of ‘ii’.
Wave ‘b’ and ‘c’ will probably extend into next Monday to complete the correction.
[/vc_column_text][/vc_column][/vc_row]
[/_s2If]
[_s2If current_user_can(access_s2member_ccap_gbpusd)]
[vc_row][vc_column][vc_separator border_width=”5″][/vc_column][/vc_row][vc_row][vc_column][vc_column_text]
GBPUSD
[/vc_column_text][/vc_column][/vc_row][vc_row][vc_column][vc_separator border_width=”5″][/vc_column][/vc_row][vc_row][vc_column width=”2/3″][vc_custom_heading text=”1 hr” use_theme_fonts=”yes”][vc_column_text]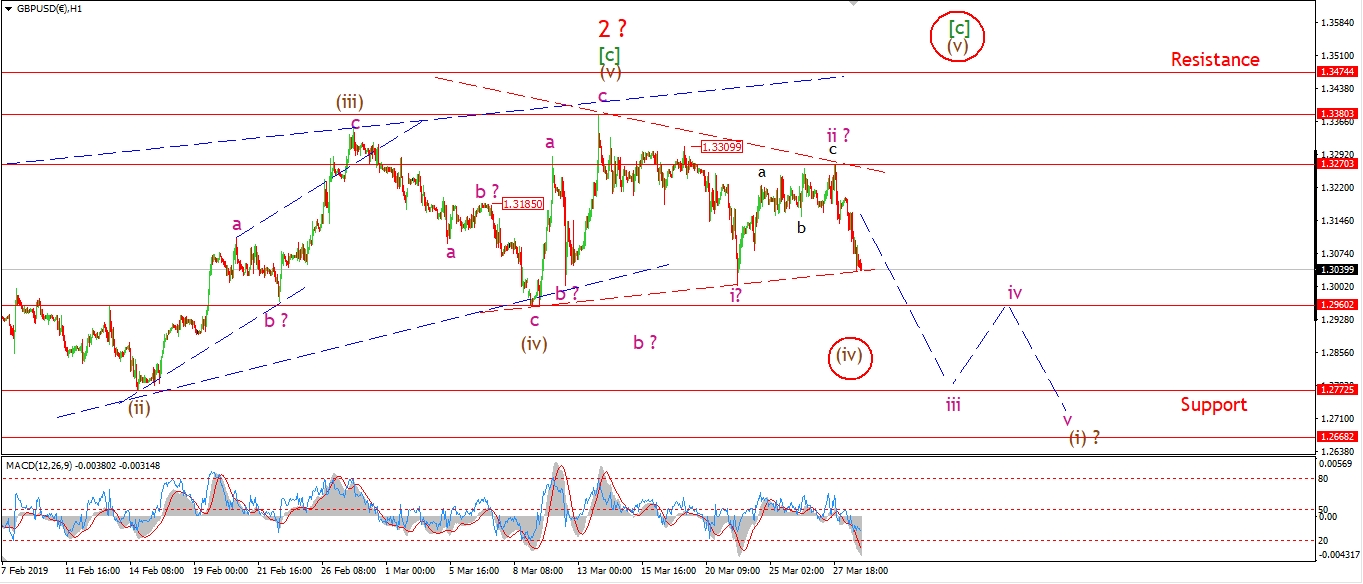 [/vc_column_text][/vc_column][vc_column width=”1/3″][vc_custom_heading text=”4 Hours” use_theme_fonts=”yes”][vc_column_text]
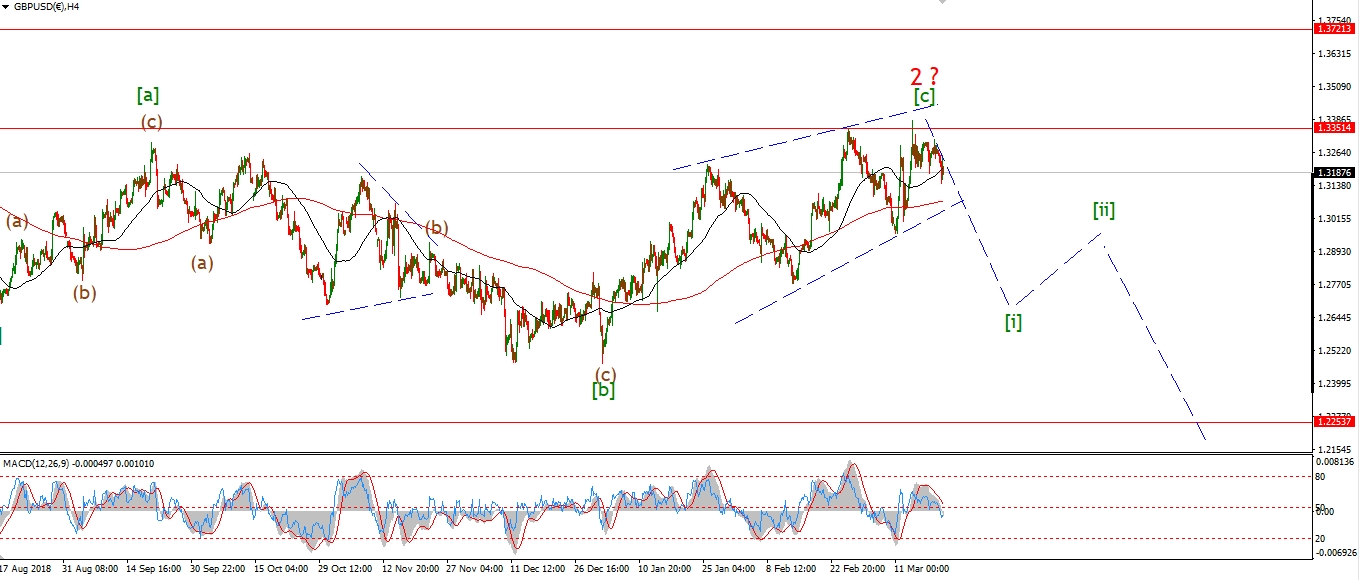 [/vc_column_text][vc_custom_heading text=”Daily” use_theme_fonts=”yes”][vc_column_text]
 [/vc_column_text][/vc_column][/vc_row]
[vc_row][vc_column][vc_column_text]
Cable has dropped today to begin a possible third wave down labelled wave ‘iii’ of (i).
The price must break 1.2960 to signal wave ‘iii’ has begun.
That should be an easy task tomorrow,
and when that happens it will rule out the alternate count.
As for the alternate count shown in red.
The price has now reached the lower trend line of that possible triangle.
If we see a rebound back above 1.3270 tomorrow,
that will trigger the alternate count.
The top in wave ‘2’ will then be postponed for another week or so.
Tomorrow;
Watch for a break of 1.2960 to confirm wave ‘iii’ of (i) ans rule out the alternate count.
[/vc_column_text][/vc_column][/vc_row]
[/_s2If]
[_s2If current_user_can(access_s2member_ccap_usdjpy)]
[vc_row][vc_column][vc_separator border_width=”5″][/vc_column][/vc_row][vc_row][vc_column][vc_column_text]
USDJPY
[/vc_column_text][/vc_column][/vc_row][vc_row][vc_column][vc_separator border_width=”5″][/vc_column][/vc_row][vc_row][vc_column width=”2/3″][vc_custom_heading text=”1 hr” use_theme_fonts=”yes”][vc_column_text]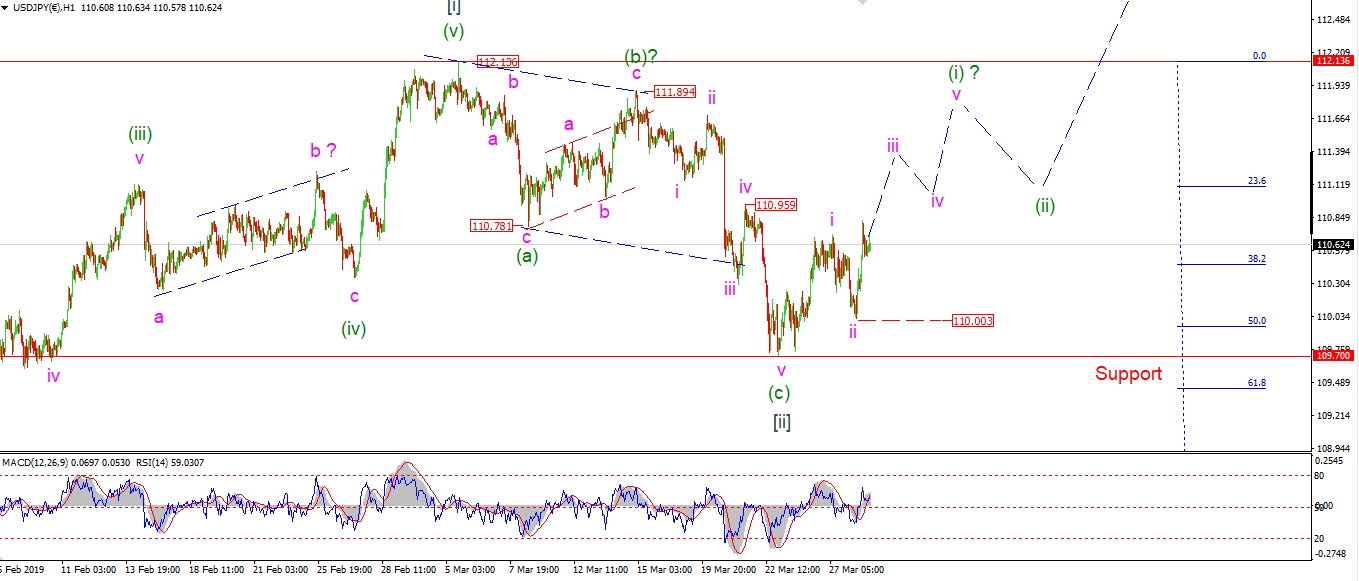 [/vc_column_text][/vc_column][vc_column width=”1/3″][vc_custom_heading text=”4 Hours” use_theme_fonts=”yes”][vc_column_text]
 [/vc_column_text][vc_custom_heading text=”Daily” use_theme_fonts=”yes”][vc_column_text]
 [/vc_column_text][/vc_column][/vc_row]
[vc_row][vc_column][vc_column_text]
USDJPY threw a fit overnight and forced a change in the short term wave count.
The drop off Wednesdays high is in three waves
and is now viewed as wave ‘ii’ complete.
The internal contraction is a minor triangle ‘b’ wave followed be wave ‘c’ of ‘ii’ to a higher low.
The rebound off the lows is viewed as the beginning of wave ‘iii’ up.
And wave ‘iii’ should carry up to about 111.40 tomorrow.
Next weeks action should complete a clear five wave pattern up in wave (i).
Tomorrow;
The wave ‘ii’ low lies at 110.003.
This level must hold to remain bullish in the short term.
[/vc_column_text][/vc_column][/vc_row]
[/_s2If]
[_s2If current_user_can(access_s2member_ccap_dow_jones)]
[vc_row][vc_column][vc_separator border_width=”5″][/vc_column][/vc_row][vc_row][vc_column][vc_column_text]
DOW JONES INDUSTRIALS
[/vc_column_text][/vc_column][/vc_row][vc_row][vc_column][vc_separator border_width=”5″][/vc_column][/vc_row][vc_row][vc_column width=”2/3″][vc_custom_heading text=”1 hr” use_theme_fonts=”yes”][vc_column_text]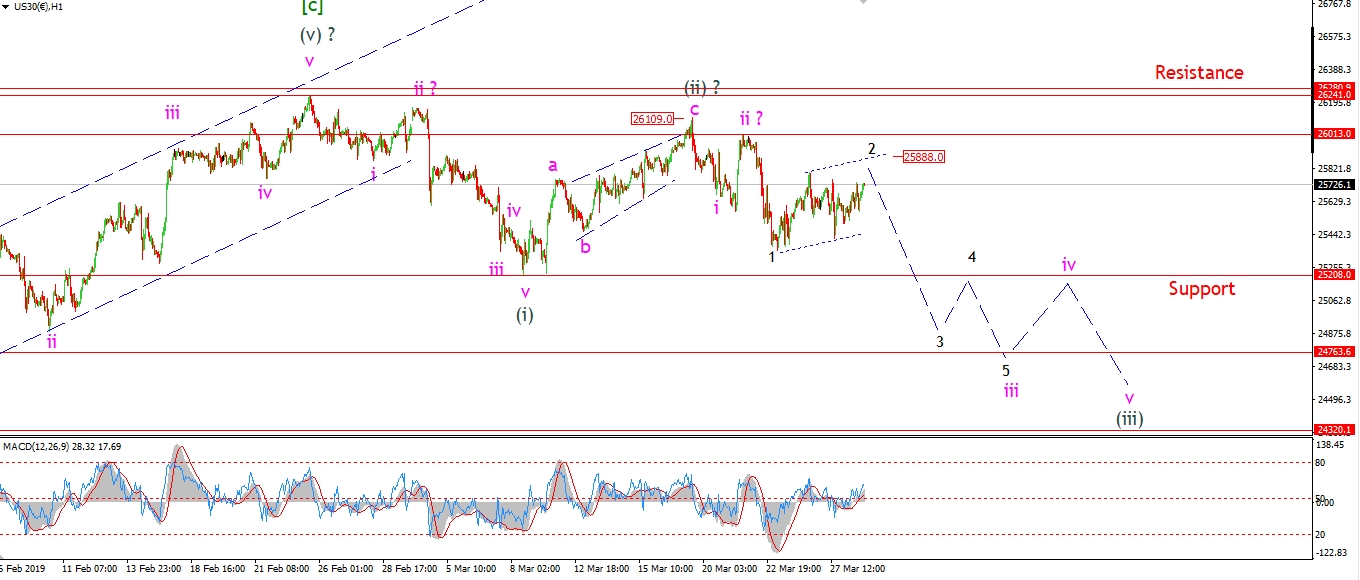 [/vc_column_text][/vc_column][vc_column width=”1/3″][vc_custom_heading text=”4 Hours” use_theme_fonts=”yes”][vc_column_text]
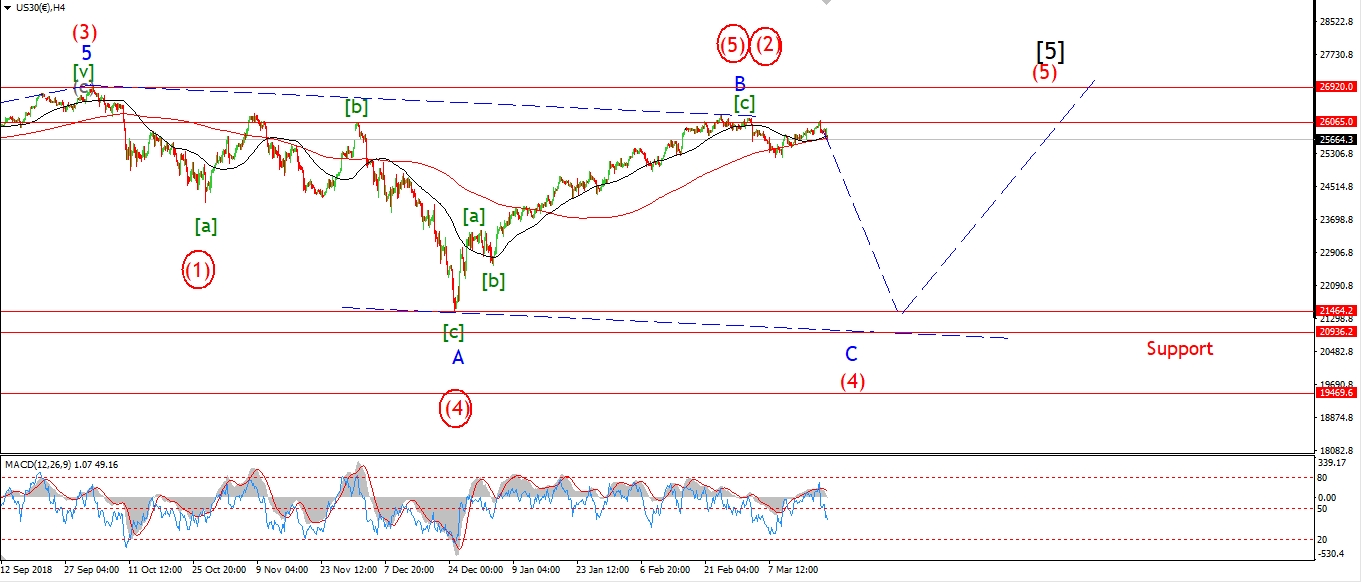 [/vc_column_text][vc_custom_heading text=”Daily” use_theme_fonts=”yes”][vc_column_text]
 [/vc_column_text][/vc_column][/vc_row]
[vc_row][vc_column][vc_column_text]
Stocks are again fairly flat today without making a new high in wave ‘2’ just yet.
Of course if the price turns lower immediately tomorrow,
and breaks 25350 again at the wave ‘1’ low.
That will signal that wave ‘3’ down has arrived ahead of schedule.
All the better if it does go that way as far as I’m concerned!
On the 4hr chart,
The 50 and 200 MA lines are flirting with a death cross at the moment.
The 50 has crossed beneath the 200,
but without any major decline,
yet……………..
Price is sitting just below the 200MA at the moment.
A drop in wave ‘iii’ of (iii) will trigger an MA and momentum sell signal.
It is a case of buyer be ware right now.
Tomorrow;
Watch for wave ‘2’ to complete a three wave correction at 25880.
Price should then turn lower into wave ‘3’ of ‘iii’ of (iii).
[/vc_column_text][/vc_column][/vc_row]
[/_s2If]
[_s2If current_user_can(access_s2member_ccap_gold)]
[vc_row][vc_column][vc_separator border_width=”5″][/vc_column][/vc_row][vc_row][vc_column][vc_column_text]
GOLD
[/vc_column_text][/vc_column][/vc_row][vc_row][vc_column][vc_separator border_width=”5″][/vc_column][/vc_row][vc_row][vc_column width=”2/3″][vc_custom_heading text=”1 hr” use_theme_fonts=”yes”][vc_column_text]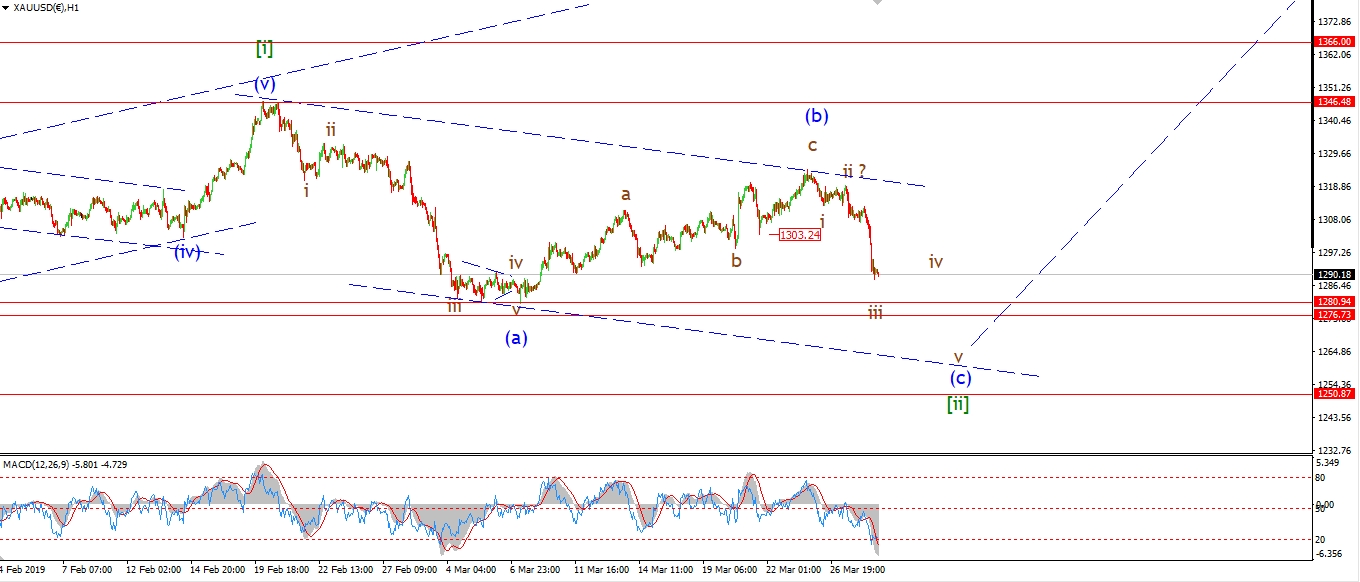 [/vc_column_text][/vc_column][vc_column width=”1/3″][vc_custom_heading text=”4 Hours” use_theme_fonts=”yes”][vc_column_text]
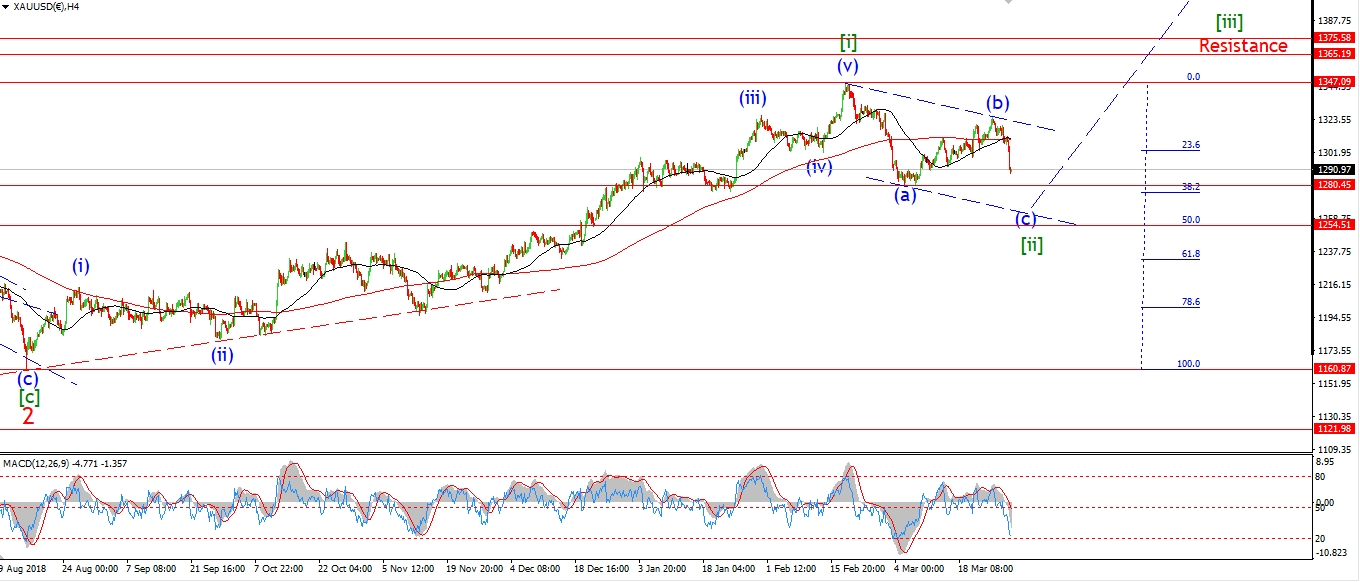 [/vc_column_text][vc_custom_heading text=”Daily” use_theme_fonts=”yes”][vc_column_text]
 [/vc_column_text][/vc_column][/vc_row]
[vc_row][vc_column][vc_column_text]
GOLD is where all the action is today!
The short term action has not developed impulsively as expected.
The price broke that key 1303 level with a sharp decline this morning
and with that,
we have to rethink the wave count.
I am still a long term bull on GOLD,
But for now we will have to endure a larger than expected correction.
The new count is best viewed on the 4hr chart.
You can see that the recent high at 1346 is now viewed as wave [i] up.
This completed in five waves,
with an extension in wave (iii).
The current decline is a three wave correction in wave [ii].
When this completes,
we will have a large degree bullish impulse wave complete.
Most people will view todays declines as a ‘death knell’ for the GOLD rally.
I think we are fast approaching a seriously bullish opportunity!
Wave [iii] up should be quite something.
The short term count shows a three wave decline and wave (c) is already most of the way there.
The minimum target for wave (c) lies at 1280,
where the low of wave (a) will be broken.
Tomorrow;
Watch for wave (c) to continue lower in five waves as shown.
The lower trend line will be met at 1254.
this also happens to be the 50% retracement of the rally in wave [i].
[/vc_column_text][/vc_column][/vc_row]
[/_s2If]
[_s2If current_user_can(access_s2member_ccap_crude)]
[vc_row][vc_column][vc_separator border_width=”5″][/vc_column][/vc_row][vc_row][vc_column][vc_column_text]
U.S CRUDE OIL
[/vc_column_text][/vc_column][/vc_row][vc_row][vc_column][vc_separator border_width=”5″][/vc_column][/vc_row][vc_row][vc_column width=”2/3″][vc_custom_heading text=”1 hr” use_theme_fonts=”yes”][vc_column_text]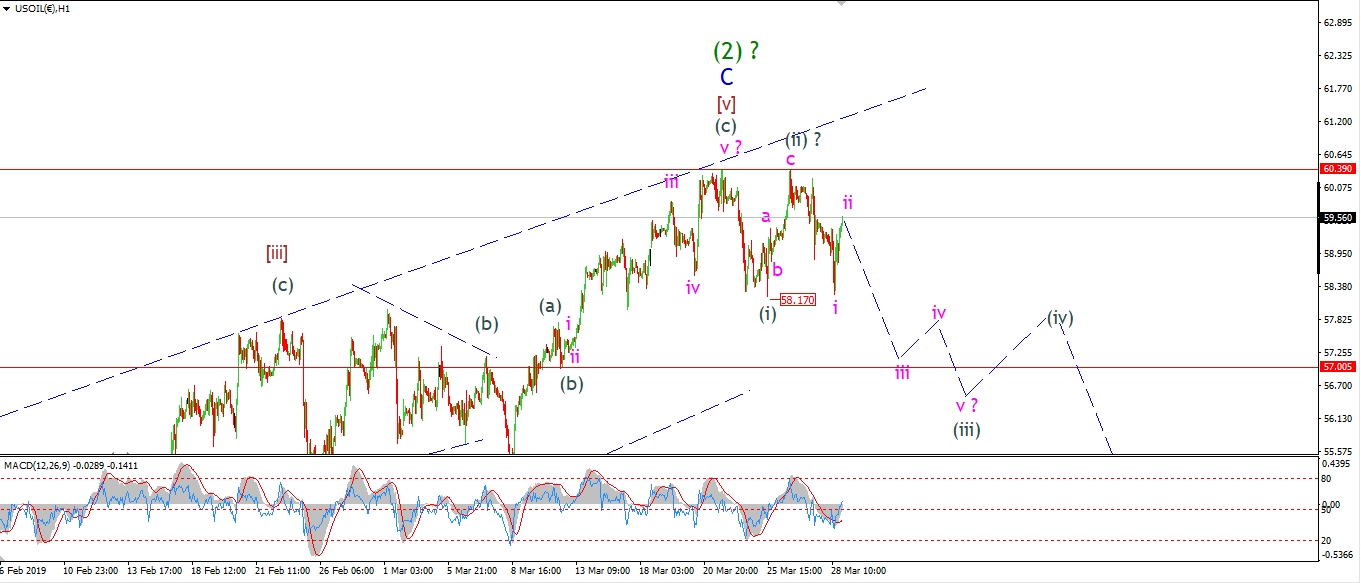 [/vc_column_text][/vc_column][vc_column width=”1/3″][vc_custom_heading text=”4 Hours” use_theme_fonts=”yes”][vc_column_text]
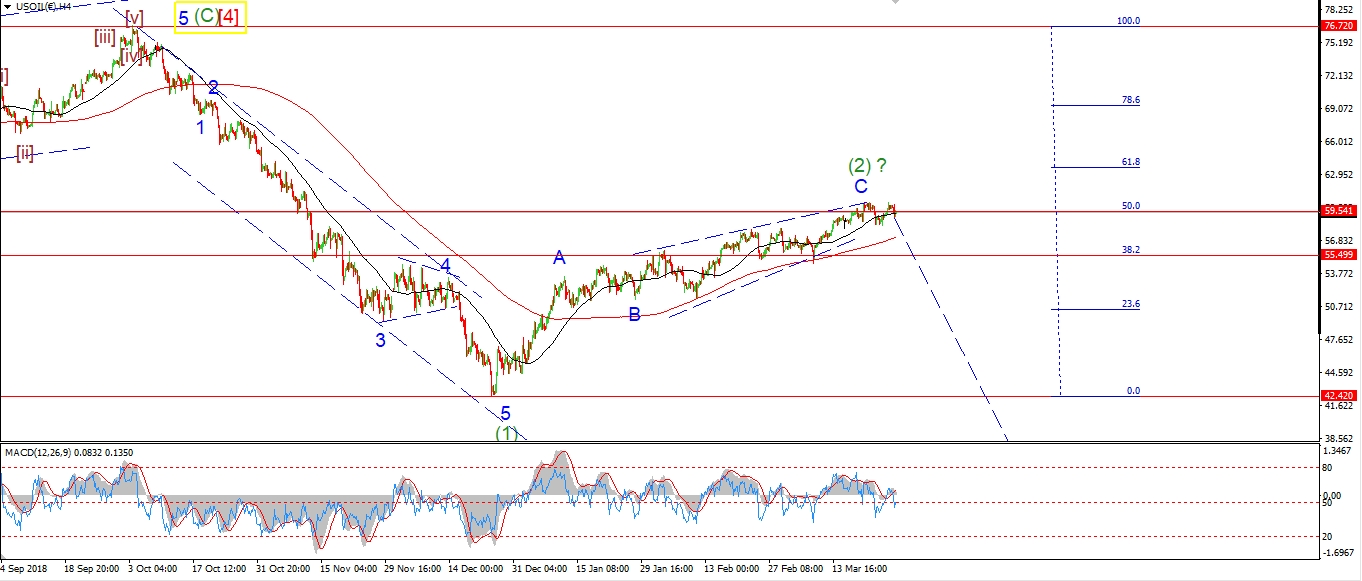 [/vc_column_text][vc_custom_heading text=”Daily” use_theme_fonts=”yes”][vc_column_text]
 [/vc_column_text][/vc_column][/vc_row]
[vc_row][vc_column][vc_column_text]
A sharp spike lower and rebound in crude has raised the possibility of a larger ‘i’ ‘ii’ pattern in play.
The drop off wave (ii) is in five waves.
This is labelled as wave ‘i’ of (iii).
Wave ‘ii’ must complete below 60.00,
and then a drop in wave ‘iii’ down should take us back below 58.00 for good.
The larger wave (iii) down must take over tomorrow and force prices lower.
If we dont see that action tomorrow,
then I will have to rethink the wave ‘C’ ending diagonal.
Tomorrow;
Watch for 60.39 to again hold the price as wave ‘ii’ completes.
Wave (iii) down must now begin to turn the tide on this rally.
[/vc_column_text][/vc_column][/vc_row]
[/_s2If]
[_s2If current_user_can(access_s2member_ccap_us10yr)]
[vc_row][vc_column][vc_separator border_width=”5″][/vc_column][/vc_row][vc_row][vc_column][vc_column_text]
US 10 yr Treasuries.
[/vc_column_text][/vc_column][/vc_row][vc_row][vc_column][vc_separator border_width=”5″][/vc_column][/vc_row][vc_row][vc_column width=”2/3″][vc_custom_heading text=”1 hr” use_theme_fonts=”yes”][vc_column_text]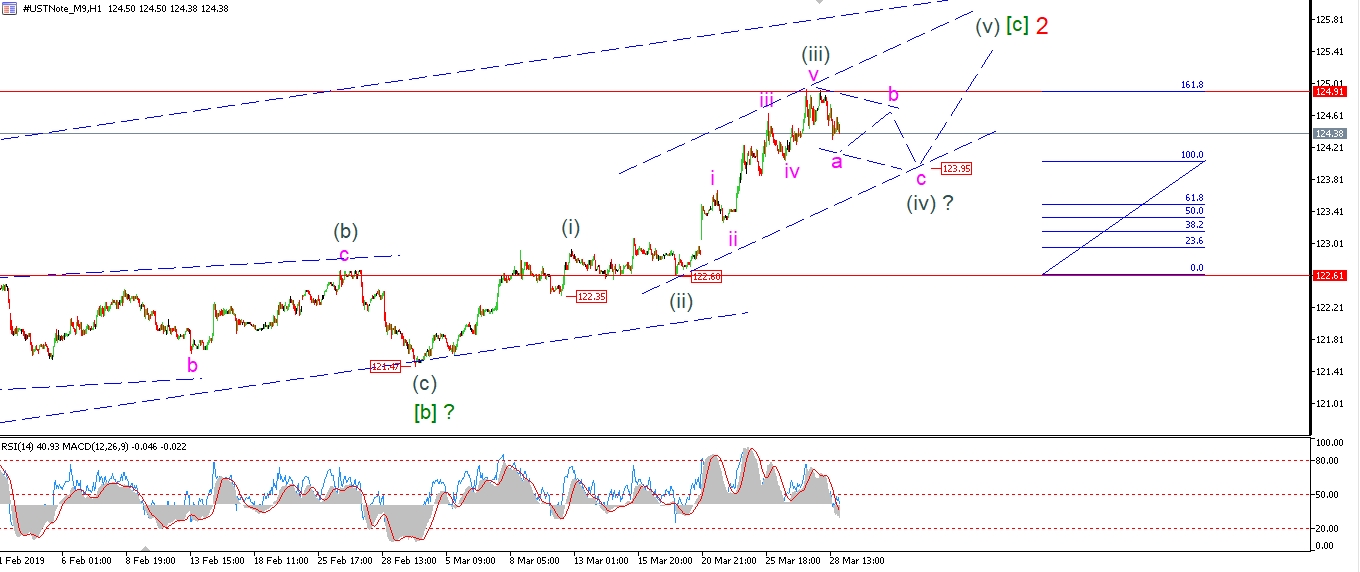 [/vc_column_text][/vc_column][vc_column width=”1/3″][vc_custom_heading text=”4 Hours” use_theme_fonts=”yes”][vc_column_text]
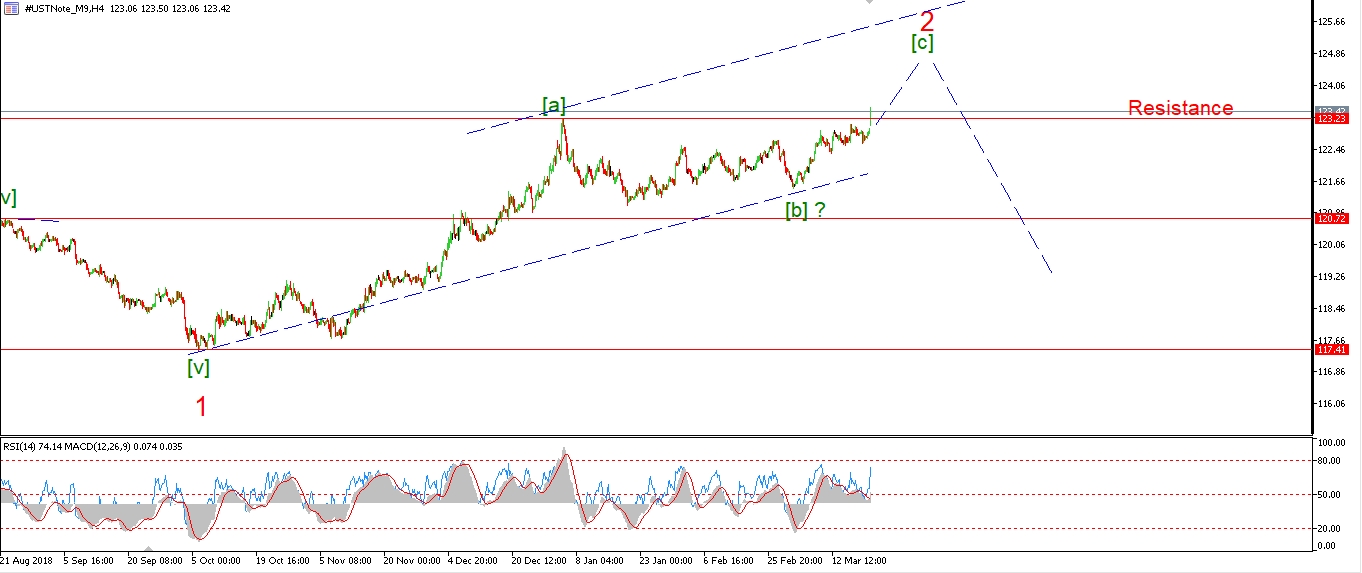 [/vc_column_text][vc_custom_heading text=”Daily” use_theme_fonts=”yes”][vc_column_text]
 [/vc_column_text][/vc_column][/vc_row]
[vc_row][vc_column][vc_column_text]
The 10YR has dropped off the high of wave (iii) in wave ‘a’ of (iv) today.
Wave ‘a’ may have a little more to go before turning higher into wave ‘b’ again.
But I expect wave ‘b’ to begin tomorrow.
The whole correction in wave (iv) should drop back below 124.00 again when complete.
Tomorrow;
Watch for wave ‘a’ to find a low above 124.00 and wave ‘b’ to create a lower high.
[/vc_column_text][/vc_column][/vc_row]
[/_s2If]
[_s2If current_user_can(access_s2member_ccap_silver)]
[vc_row][vc_column][vc_separator border_width=”5″][/vc_column][/vc_row][vc_row][vc_column][vc_column_text]
SILVER
[/vc_column_text][/vc_column][/vc_row][vc_row][vc_column][vc_separator border_width=”5″][/vc_column][/vc_row][vc_row][vc_column width=”2/3″][vc_custom_heading text=”1 hr” use_theme_fonts=”yes”][vc_column_text]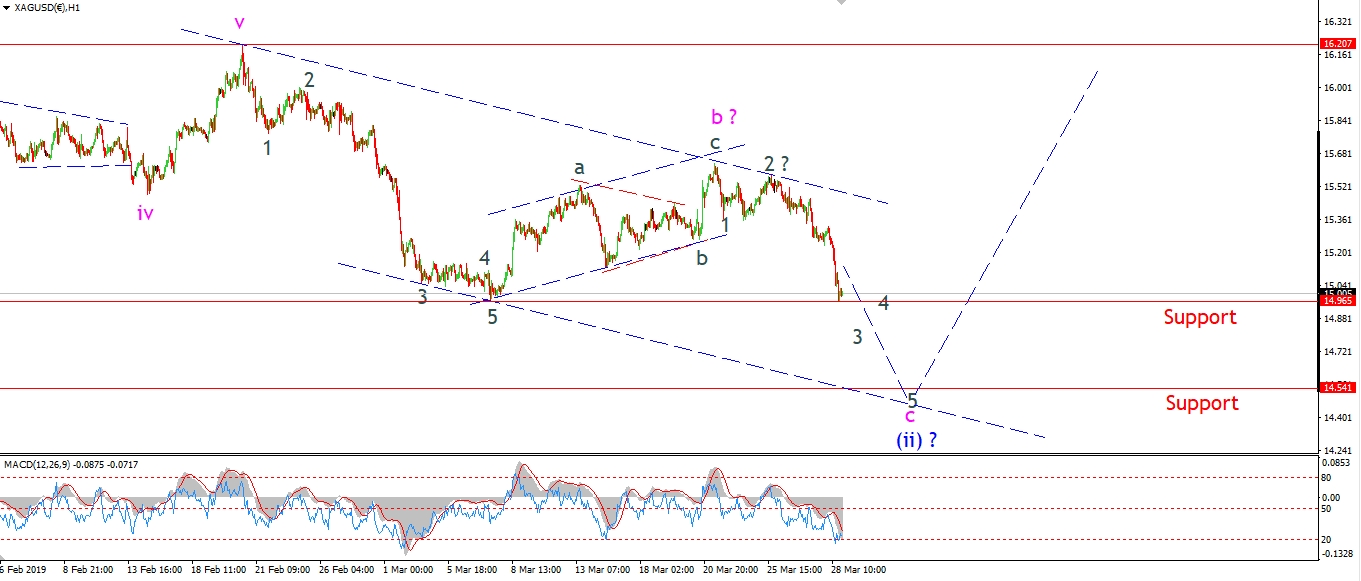 [/vc_column_text][/vc_column][vc_column width=”1/3″][vc_custom_heading text=”4 Hours” use_theme_fonts=”yes”][vc_column_text]
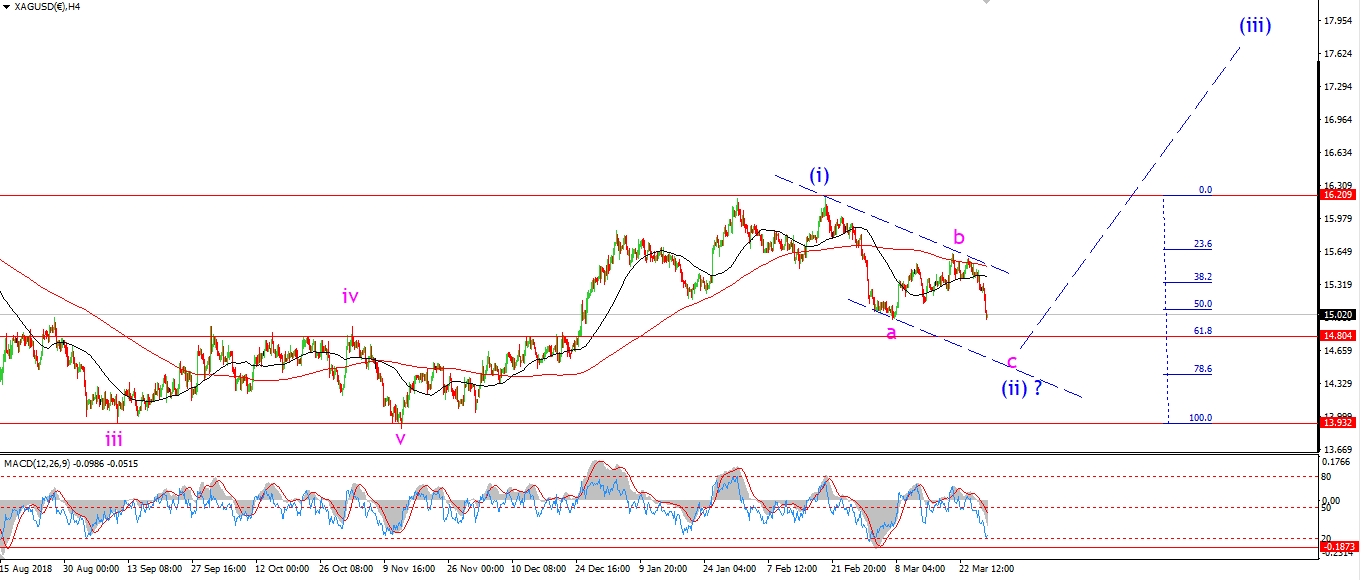 [/vc_column_text][vc_custom_heading text=”Daily” use_theme_fonts=”yes”][vc_column_text]
 [/vc_column_text][/vc_column][/vc_row]
[vc_row][vc_column][vc_column_text]
Silver has dropped further today and ruled out the hopefull bullish count shown recently.
We were too close for comfort for the last week,
and todays drop has triggered the alternate count.
This is again best viewed on the 4hr chart.
The correction is viewed as a larger zigzag wave (ii) as shown.
The price has completed waves ‘a’ and ‘b’,
with wave ‘c’ now underway.
the initial target lies at 14.80, the 61.8% retracement of wave (i).
Tomorrow;
The short term chart shows that wave ‘c’ of (ii) is already well underway.
Watch for a five wave pattern to complete in wave ‘c’.
Target ranges from 14.50 at the lower trendline up to 14.80 at the 62% retracement.
[/vc_column_text][/vc_column][/vc_row]
[/_s2If]
[_s2If current_user_can(access_s2member_ccap_sp500)]
[vc_row][vc_column][vc_separator border_width=”5″][/vc_column][/vc_row][vc_row][vc_column][vc_column_text]
S&P 500.
[/vc_column_text][/vc_column][/vc_row][vc_row][vc_column][vc_separator border_width=”5″][/vc_column][/vc_row][vc_row][vc_column width=”2/3″][vc_custom_heading text=”1 hr” use_theme_fonts=”yes”][vc_column_text]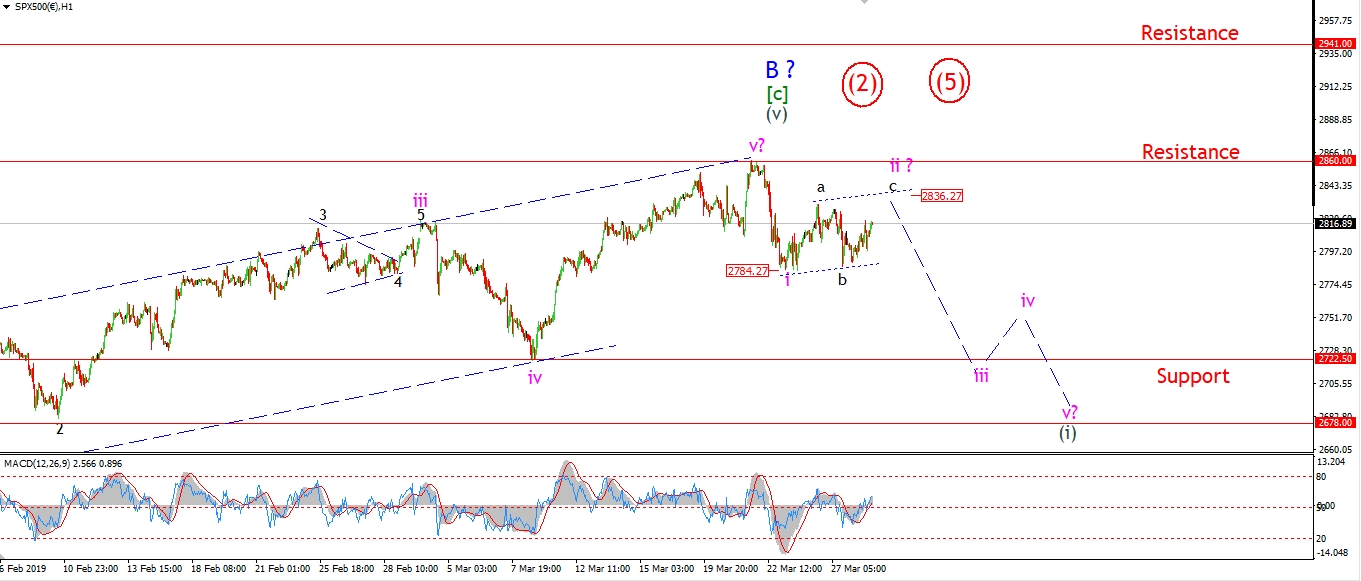 [/vc_column_text][/vc_column][vc_column width=”1/3″][vc_custom_heading text=”4 Hours” use_theme_fonts=”yes”][vc_column_text]
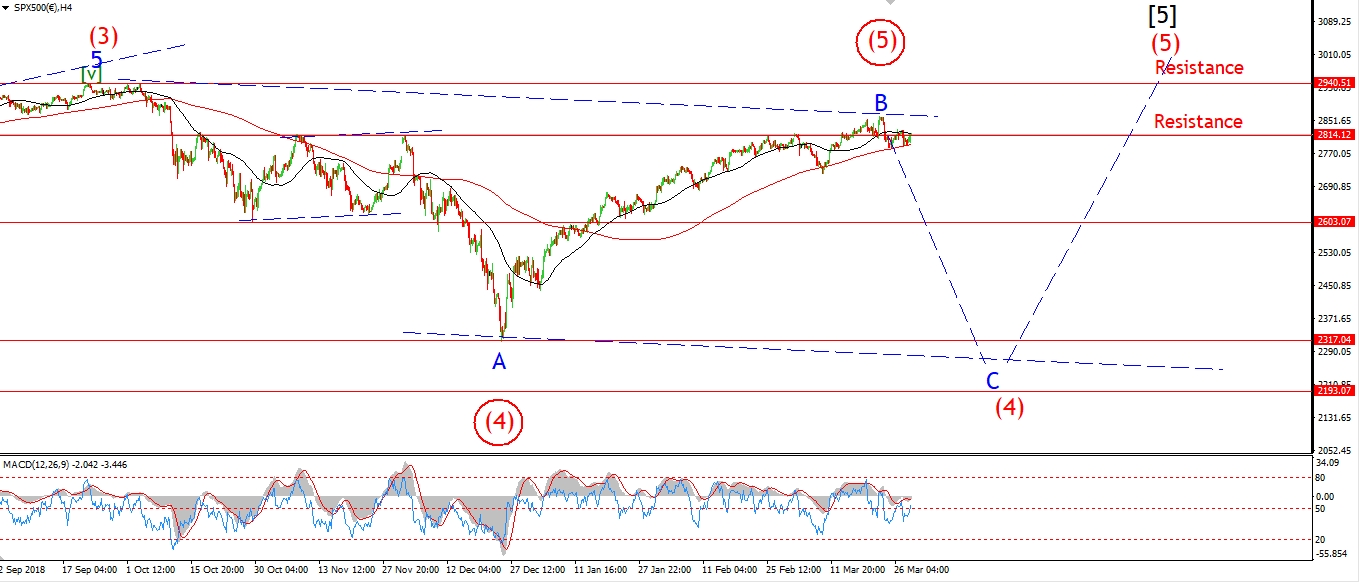 [/vc_column_text][vc_custom_heading text=”Daily” use_theme_fonts=”yes”][vc_column_text]
 [/vc_column_text][/vc_column][/vc_row]
[vc_row][vc_column][vc_column_text]
The S&P has not created a five wave rise in wave ‘c’ as you might expect.
This does open the possibility that wave ‘iii’ down has already started.
A break of 2784 tomorrow will confirm that idea.
So far the impulsive drop off the highs has not been answered in any significant way.
The current action is corrective to the upside.
And with the larger wave count expecting at least a decline in wave ‘C’ to 2100.
Then the latest drop gets even more interesting.
An impulse wave down to begin wave ‘C’ is now a real possibility.
Tomorrow;
Watch for wave ‘c’ to complete at 2836
and then the price should return lower to break 2784 in wave ‘iii’ down.
[/vc_column_text][/vc_column][/vc_row]
[/_s2If]
[vc_row][vc_column][vc_column_text]
[/vc_column_text][/vc_column][/vc_row]
[vc_row][vc_column][vc_separator border_width=”5″][/vc_column][/vc_row]