
[vc_row][vc_column][vc_separator border_width=”5″][/vc_column][/vc_row]
[vc_row][vc_column][vc_column_text]
Hello everyone.
[/vc_column_text][/vc_column][/vc_row]
[_s2If current_user_can(access_s2member_ccap_eurusd)]
[vc_row][vc_column][vc_separator border_width=”5″][/vc_column][/vc_row]
[vc_row][vc_column][vc_column_text]
EURUSD
[/vc_column_text][/vc_column][/vc_row]
[vc_row][vc_column][vc_separator border_width=”5″][/vc_column][/vc_row][vc_row][vc_column width=”2/3″][vc_custom_heading text=”1 hr” use_theme_fonts=”yes”][vc_column_text]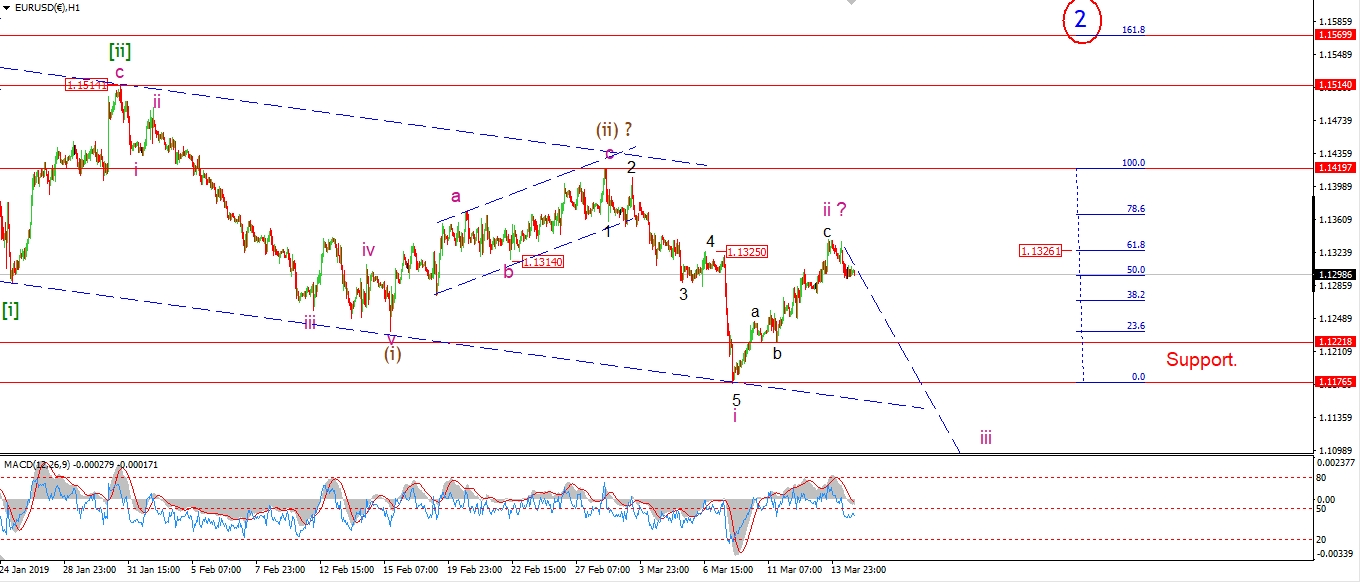 [/vc_column_text][/vc_column][vc_column width=”1/3″][vc_custom_heading text=”4 Hours” use_theme_fonts=”yes”][vc_column_text]
 [/vc_column_text][vc_custom_heading text=”Daily” use_theme_fonts=”yes”][vc_column_text]
 [/vc_column_text][/vc_column][/vc_row]
[vc_row][vc_column][vc_column_text]
EURUSD has been quiet today without the impulsive move lower that I expect.
the price has dropped off the wave ‘c’ high,
but this has not developed impulsively yet.
Wave ‘iii’ down should get underway quickly so if we dont see a decline tomorrow,
I will have to rethink the short term structure.
Tomorrow watch for wave ‘iii’ down to begin with a break of 1.1220.
[/vc_column_text][/vc_column][/vc_row]
[/_s2If]
[_s2If current_user_can(access_s2member_ccap_gbpusd)]
[vc_row][vc_column][vc_separator border_width=”5″][/vc_column][/vc_row][vc_row][vc_column][vc_column_text]
GBPUSD
[/vc_column_text][/vc_column][/vc_row][vc_row][vc_column][vc_separator border_width=”5″][/vc_column][/vc_row][vc_row][vc_column width=”2/3″][vc_custom_heading text=”1 hr” use_theme_fonts=”yes”][vc_column_text]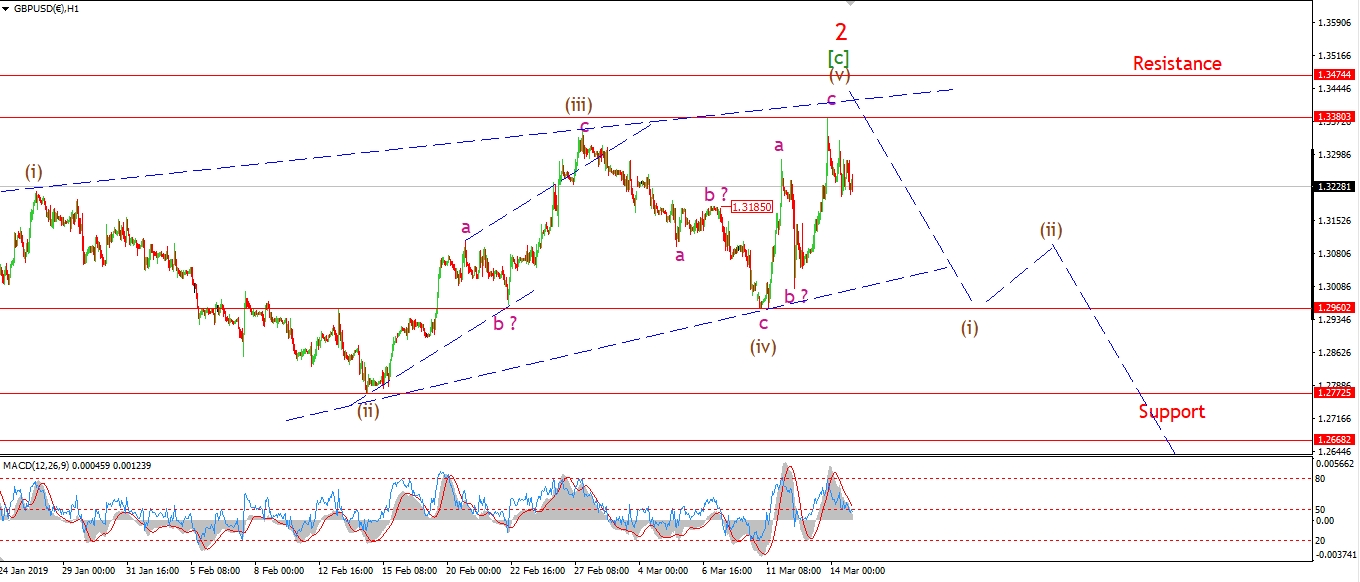 [/vc_column_text][/vc_column][vc_column width=”1/3″][vc_custom_heading text=”4 Hours” use_theme_fonts=”yes”][vc_column_text]
 [/vc_column_text][vc_custom_heading text=”Daily” use_theme_fonts=”yes”][vc_column_text]
 [/vc_column_text][/vc_column][/vc_row]
[vc_row][vc_column][vc_column_text]
Cable has dropped off the highs in three waves so far.
the decline may well develop into a five wave structure in wave (i) down as shown.
That should occur over the coming week.
A break of the wave (iv) low at 1.2960 will signal that the ending diagonal wave [c] of ‘2’ is complete
and the market has turned down into wave ‘3’.
Tomorrow;
Wave (v) has completed a three wave pattern at last nights highs,
So the ending diagonal should be complete.
Watch for wave (i) down to begin tomorrow.
1.3380 must hold for this to occur.
[/vc_column_text][/vc_column][/vc_row]
[/_s2If]
[_s2If current_user_can(access_s2member_ccap_usdjpy)]
[vc_row][vc_column][vc_separator border_width=”5″][/vc_column][/vc_row][vc_row][vc_column][vc_column_text]
USDJPY
[/vc_column_text][/vc_column][/vc_row][vc_row][vc_column][vc_separator border_width=”5″][/vc_column][/vc_row][vc_row][vc_column width=”2/3″][vc_custom_heading text=”1 hr” use_theme_fonts=”yes”][vc_column_text]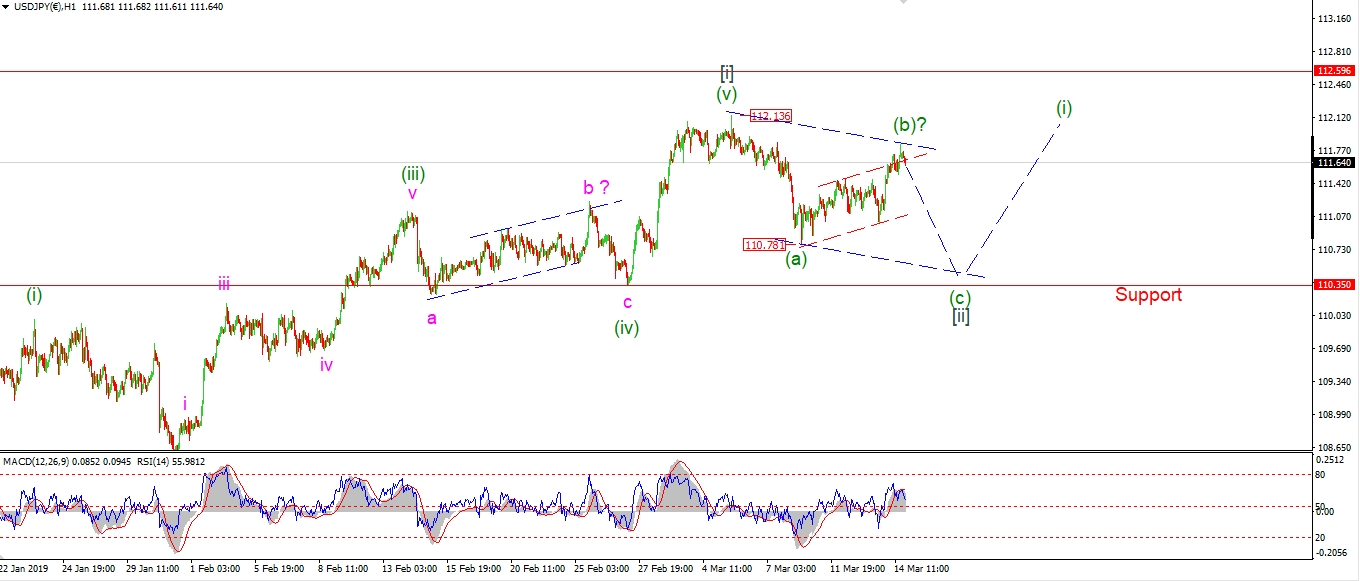 [/vc_column_text][/vc_column][vc_column width=”1/3″][vc_custom_heading text=”4 Hours” use_theme_fonts=”yes”][vc_column_text]
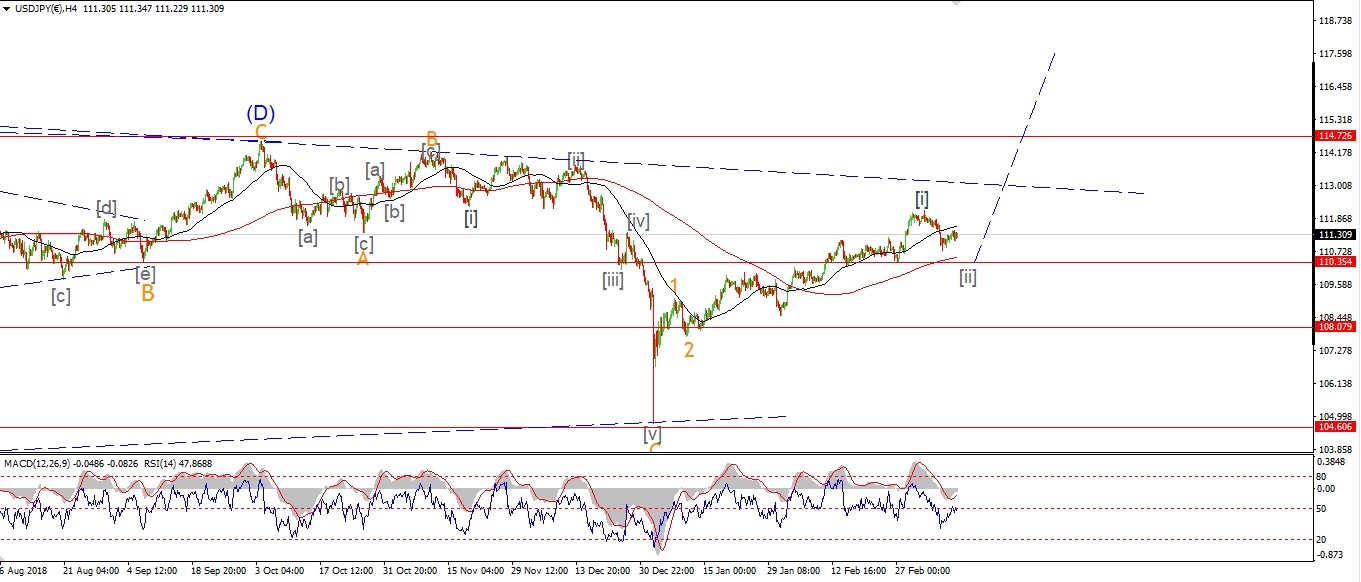 [/vc_column_text][vc_custom_heading text=”Daily” use_theme_fonts=”yes”][vc_column_text]
 [/vc_column_text][/vc_column][/vc_row]
[vc_row][vc_column][vc_column_text]
Wave (b) of [ii] pushed higher today and extended into a larger three wave pattern.
Wave (B) itself has now traced out a flat 3,3,5 structure.
And the price has filled a trend channel at todays highs.
Wave (c) down should commence overnight and carry below the wave (a) low at 110.78.
the fact that wave (b) has extended higher means that wave [ii] should be a shallower correction overall.
The lower target lies at 110.45.
Once wave [ii] completes,
the price should turn higher into wave [iii].
[/vc_column_text][/vc_column][/vc_row]
[/_s2If]
[_s2If current_user_can(access_s2member_ccap_dow_jones)]
[vc_row][vc_column][vc_separator border_width=”5″][/vc_column][/vc_row][vc_row][vc_column][vc_column_text]
DOW JONES INDUSTRIALS
[/vc_column_text][/vc_column][/vc_row][vc_row][vc_column][vc_separator border_width=”5″][/vc_column][/vc_row][vc_row][vc_column width=”2/3″][vc_custom_heading text=”1 hr” use_theme_fonts=”yes”][vc_column_text]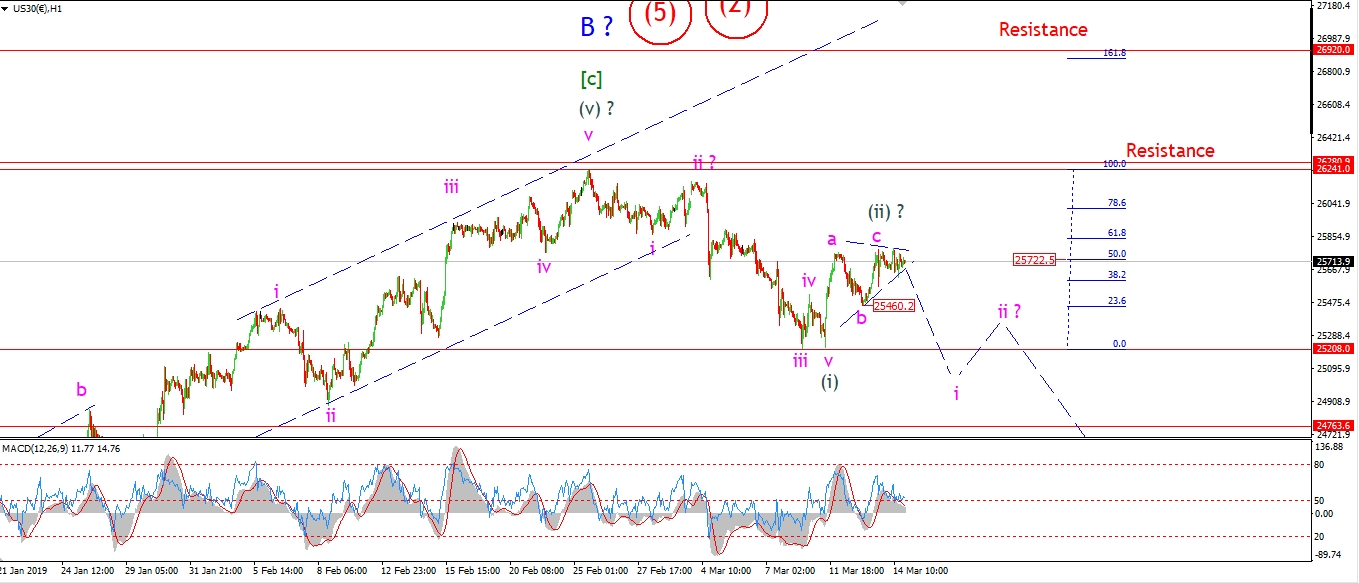 [/vc_column_text][/vc_column][vc_column width=”1/3″][vc_custom_heading text=”4 Hours” use_theme_fonts=”yes”][vc_column_text]
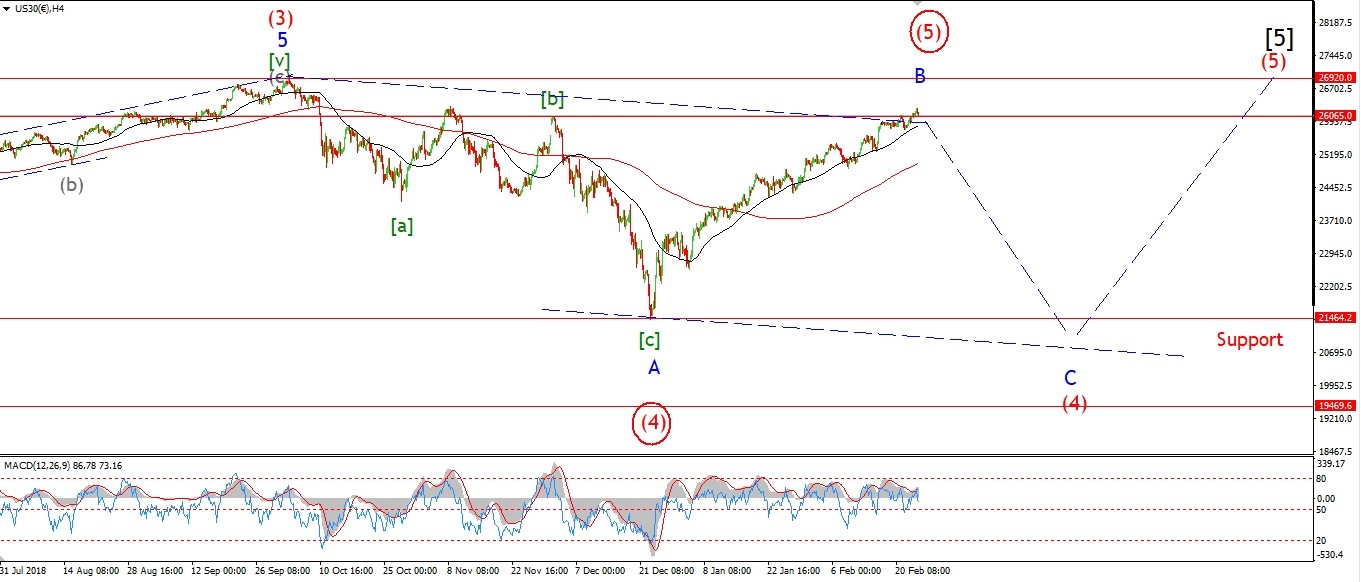 [/vc_column_text][vc_custom_heading text=”Daily” use_theme_fonts=”yes”][vc_column_text]
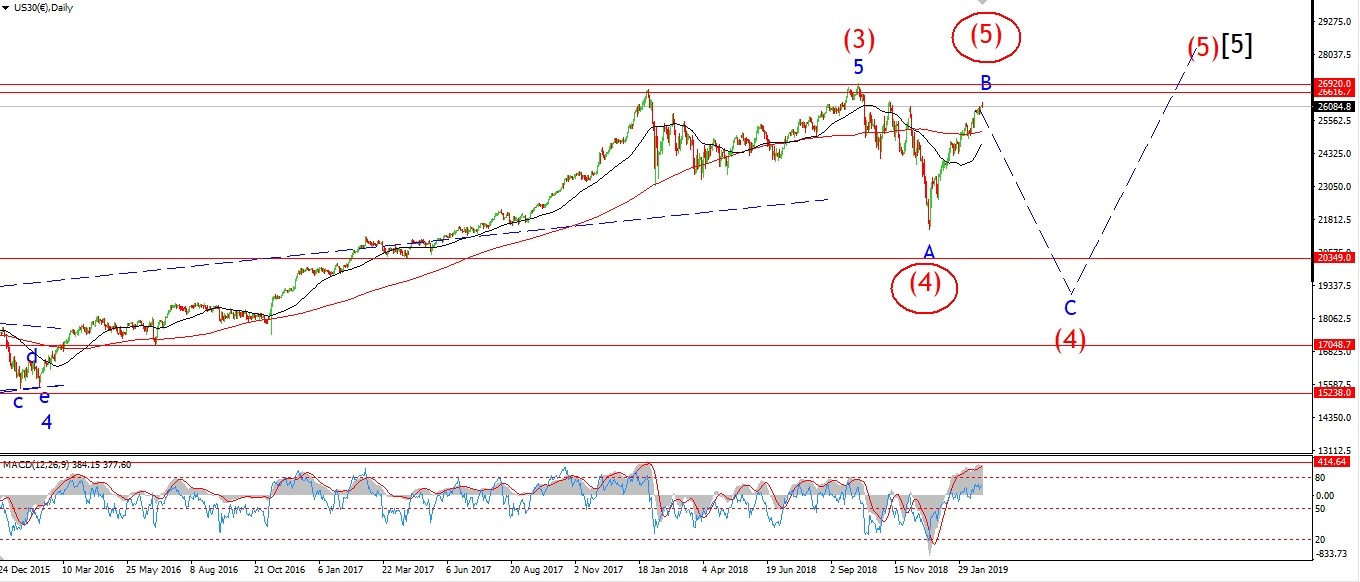 [/vc_column_text][/vc_column][/vc_row]
[vc_row][vc_column][vc_column_text]
The DOW is hanging right at the highs of the week this evening.
The action this week has created a three wave rally off the wave (i) low.
So,
wave (ii) could be complete at 25776.
If the price falls below 25460 tomorrow,
that will signal wave (ii) is done and wave (iii) down is beginning.
The alternate view for wave (ii):
The contraction in range over the week can also be viewed as barrier triangle wave ‘b’.
A spike above 25776 tomorrow will trigger that alternate wave ‘c’
and that too should complete quickly.
Tomorrow;
Whatever happens for wave ‘c’,
If the price drops below 25460 marked wave ‘b’,
Then the market should continue lower into wave (iii).
[/vc_column_text][/vc_column][/vc_row]
[/_s2If]
[_s2If current_user_can(access_s2member_ccap_gold)]
[vc_row][vc_column][vc_separator border_width=”5″][/vc_column][/vc_row][vc_row][vc_column][vc_column_text]
GOLD
[/vc_column_text][/vc_column][/vc_row][vc_row][vc_column][vc_separator border_width=”5″][/vc_column][/vc_row][vc_row][vc_column width=”2/3″][vc_custom_heading text=”1 hr” use_theme_fonts=”yes”][vc_column_text]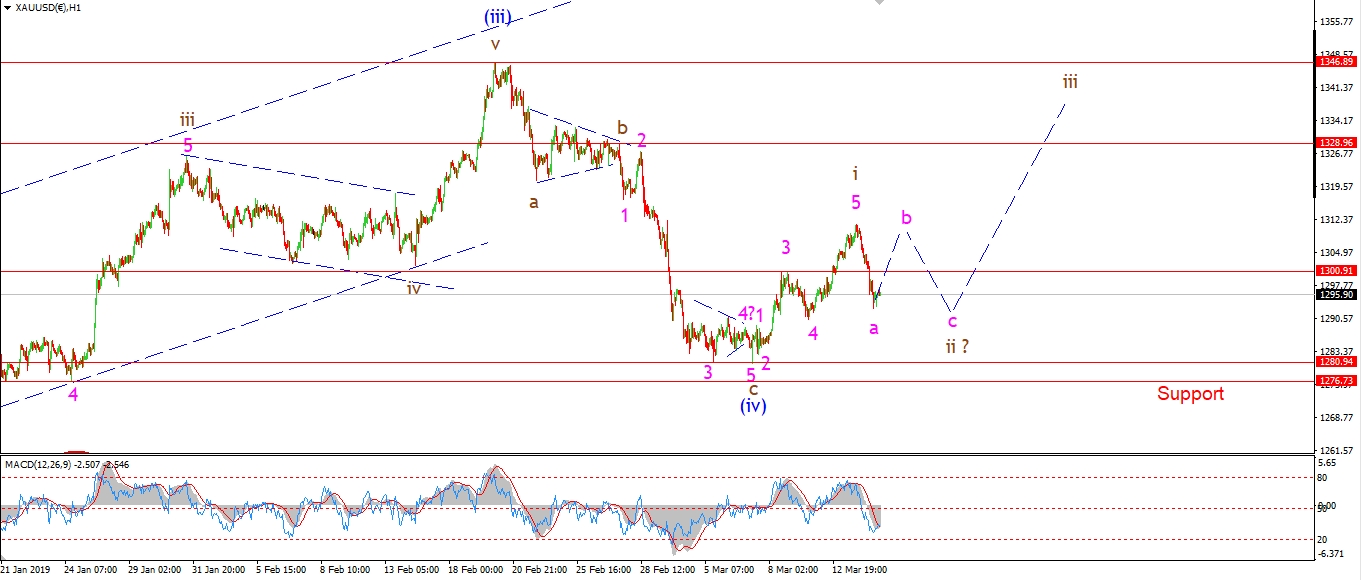 [/vc_column_text][/vc_column][vc_column width=”1/3″][vc_custom_heading text=”4 Hours” use_theme_fonts=”yes”][vc_column_text]
 [/vc_column_text][vc_custom_heading text=”Daily” use_theme_fonts=”yes”][vc_column_text]
 [/vc_column_text][/vc_column][/vc_row]
[vc_row][vc_column][vc_column_text]
Todays drop off the recent highs came in fast,
this rules out the larger wave ‘i’ that I had shown last night.
It is possible that wave ‘ii’ has now begun in a zigzag formation.
Price must hold above 1280 for this impulse wave to remain valid.
If 1280 breaks over the coming days,
That will indicate that wave (iv) is extending.
Tomorrow;
Watch for 1280 to hold as wave ‘ii’ completes in a three wave structure.
[/vc_column_text][/vc_column][/vc_row]
[/_s2If]
[_s2If current_user_can(access_s2member_ccap_crude)]
[vc_row][vc_column][vc_separator border_width=”5″][/vc_column][/vc_row][vc_row][vc_column][vc_column_text]
U.S CRUDE OIL
[/vc_column_text][/vc_column][/vc_row][vc_row][vc_column][vc_separator border_width=”5″][/vc_column][/vc_row][vc_row][vc_column width=”2/3″][vc_custom_heading text=”1 hr” use_theme_fonts=”yes”][vc_column_text]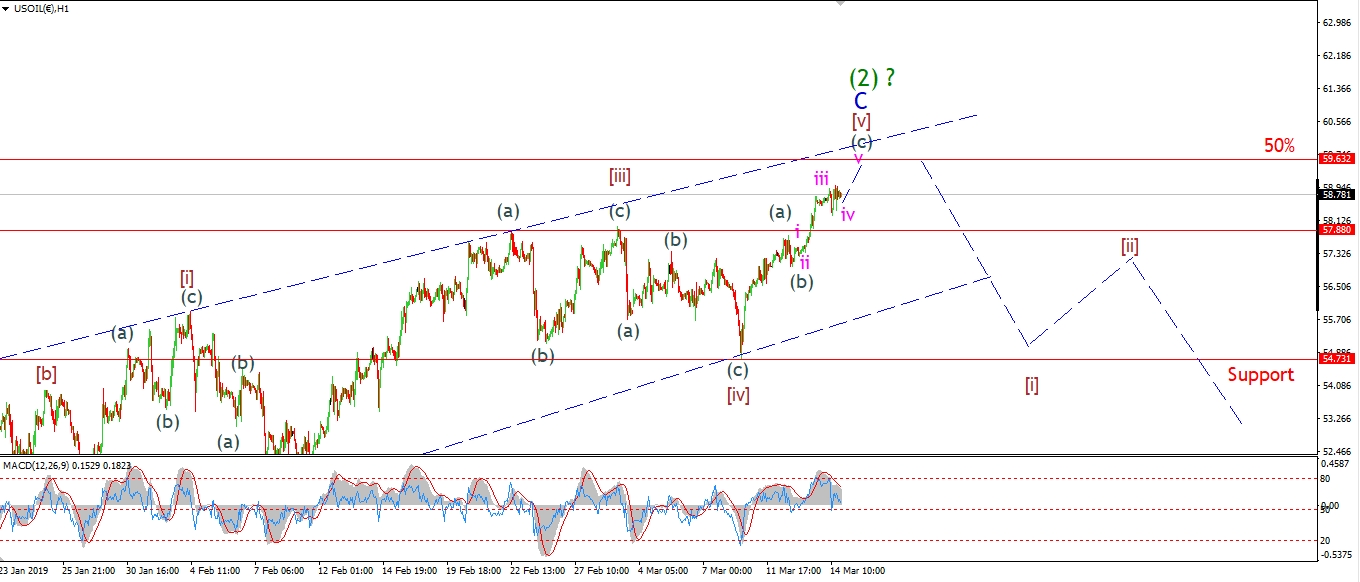 [/vc_column_text][/vc_column][vc_column width=”1/3″][vc_custom_heading text=”4 Hours” use_theme_fonts=”yes”][vc_column_text]
 [/vc_column_text][vc_custom_heading text=”Daily” use_theme_fonts=”yes”][vc_column_text]
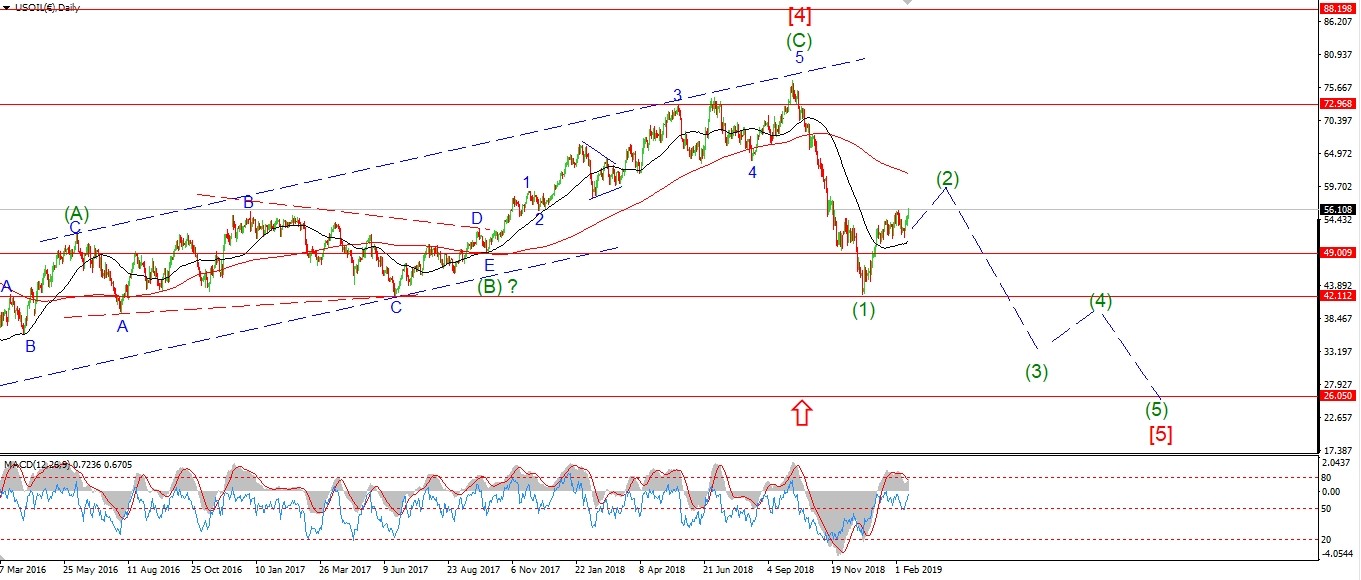 [/vc_column_text][/vc_column][/vc_row]
[vc_row][vc_column][vc_column_text]
Crude has spent the day overlapping and tightening almost to a stand still over the last few hours!
This action is labelled as a minor wave ‘iv’ within wave (c).
Wave ‘iv’ could be a triangle,
And this suggests another rise tomorrow in wave ‘v’.
Wave ‘v’ should hit the 50% retracement level at 59.60
and that will complete wave (c) of [v] of ‘C’ of (2).
The turning point that I am looking for now is at a very large degree as shown by the labeling.
Wave (3) down should hit the oil industry very hard.
And the damn cartel wont be long breaking,
As they start ramping up production again
to try to bolster their fast depleting govt revenues!
That game is yet to come though,
So back to the short term and this top in wave (2).
Tomorrow;
Price will hit the upper trendline at about 60.30.
Watch for a reaction lower off that trendline to begin wave [i] down.
[/vc_column_text][/vc_column][/vc_row]
[/_s2If]
[_s2If current_user_can(access_s2member_ccap_us10yr)]
[vc_row][vc_column][vc_separator border_width=”5″][/vc_column][/vc_row][vc_row][vc_column][vc_column_text]
US 10 yr Treasuries.
[/vc_column_text][/vc_column][/vc_row][vc_row][vc_column][vc_separator border_width=”5″][/vc_column][/vc_row][vc_row][vc_column width=”2/3″][vc_custom_heading text=”1 hr” use_theme_fonts=”yes”][vc_column_text]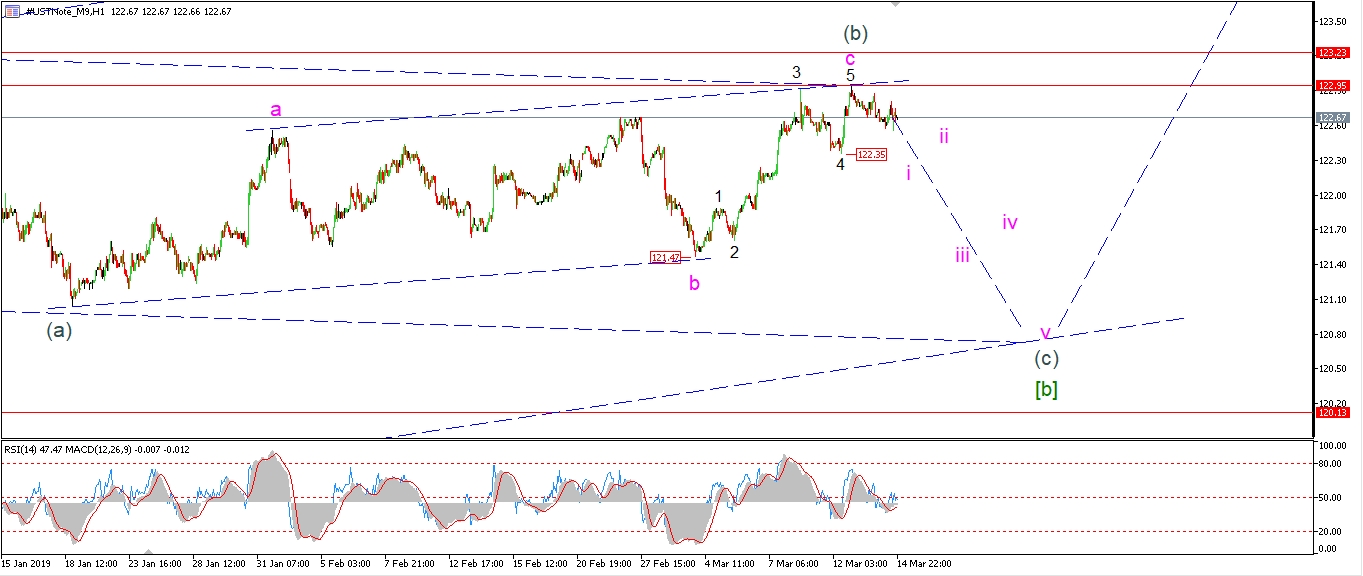 [/vc_column_text][/vc_column][vc_column width=”1/3″][vc_custom_heading text=”4 Hours” use_theme_fonts=”yes”][vc_column_text]
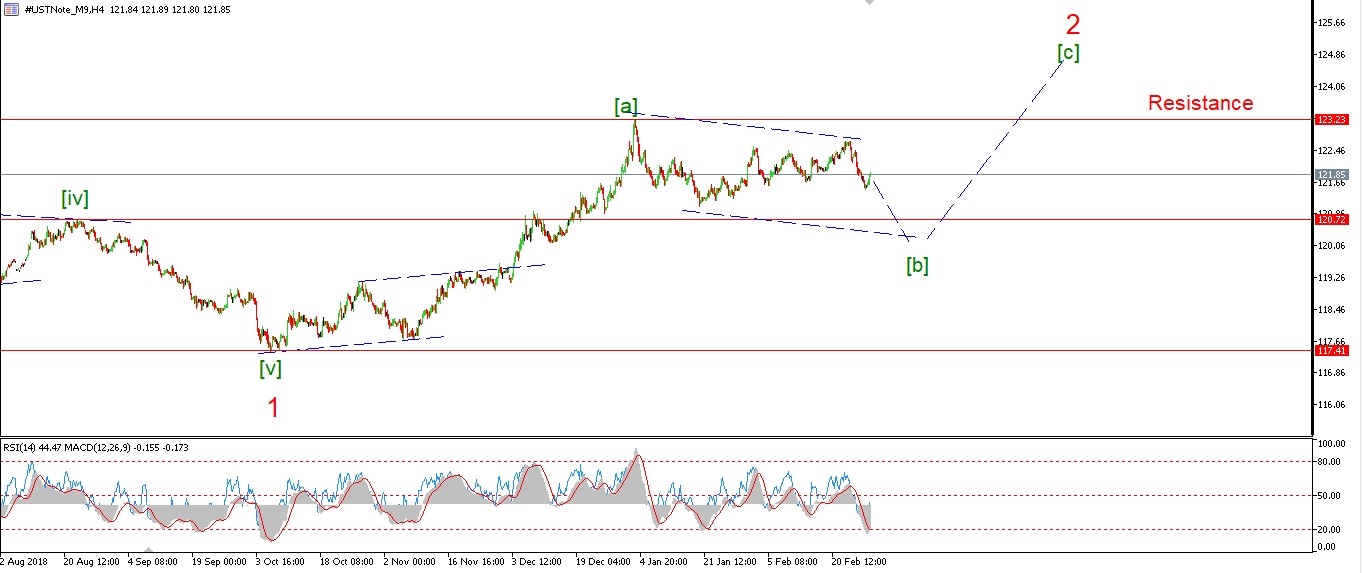 [/vc_column_text][vc_custom_heading text=”Daily” use_theme_fonts=”yes”][vc_column_text]
 [/vc_column_text][/vc_column][/vc_row]
[vc_row][vc_column][vc_column_text]
The 10YR is drifting aimlessly over the last few sessions.
This action is more like a correction rather than the beginning of a decline into wave (c).
It is possible wave wave (b) will pop to the trend channel line again
as a final subdivision in wave ‘c’ of (b).
If that happens,
it will be the last time as wave (c) is now overdue.
Tomorrow;
Watch for wave (c) to begin with a sharp push lower in wave ‘i’
A break of 122.35 will confirm it.
[/vc_column_text][/vc_column][/vc_row]
[/_s2If]
[_s2If current_user_can(access_s2member_ccap_silver)]
[vc_row][vc_column][vc_separator border_width=”5″][/vc_column][/vc_row][vc_row][vc_column][vc_column_text]
SILVER
[/vc_column_text][/vc_column][/vc_row][vc_row][vc_column][vc_separator border_width=”5″][/vc_column][/vc_row][vc_row][vc_column width=”2/3″][vc_custom_heading text=”1 hr” use_theme_fonts=”yes”][vc_column_text]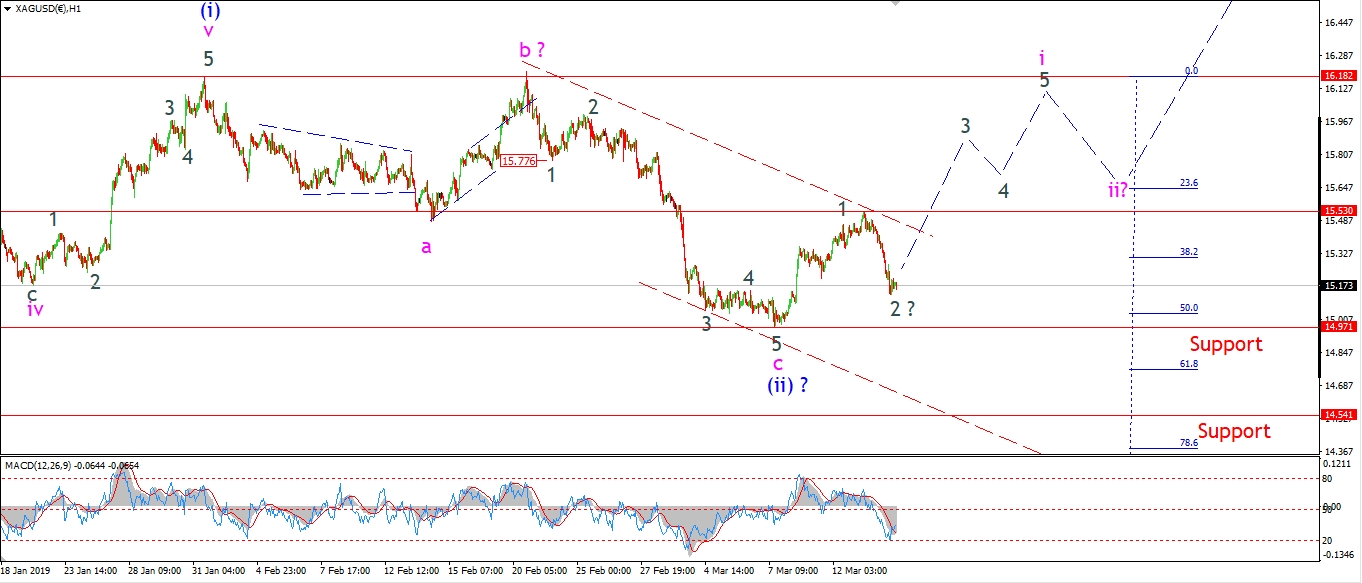 [/vc_column_text][/vc_column][vc_column width=”1/3″][vc_custom_heading text=”4 Hours” use_theme_fonts=”yes”][vc_column_text]
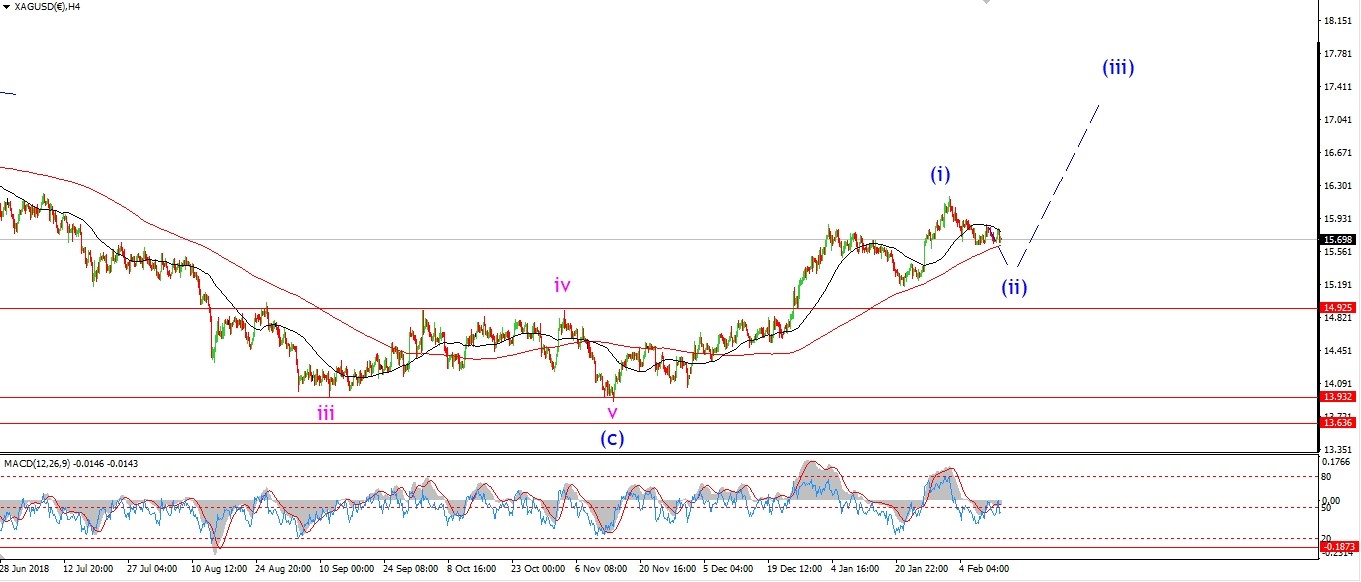 [/vc_column_text][vc_custom_heading text=”Daily” use_theme_fonts=”yes”][vc_column_text]
 [/vc_column_text][/vc_column][/vc_row]
[vc_row][vc_column][vc_column_text]
Silver has dropped sharply today in a possible wave ‘2’.
The price must not break support at 14.97 for this count to remain valid.
If 14.97 breaks,
That will signal that wave (ii) is extending.
But I would much prefer that not happen,
given that we have already reached the 50% retracement level of wave (i) at the recent lows.
Tomorrow;
Watch for wave ‘2’ to hold above 14.97 an wave ‘3’ to push higher again.
A break of 14.53 will confirm wave ‘3’.
[/vc_column_text][/vc_column][/vc_row]
[/_s2If]
[_s2If current_user_can(access_s2member_ccap_sp500)]
[vc_row][vc_column][vc_separator border_width=”5″][/vc_column][/vc_row][vc_row][vc_column][vc_column_text]
S&P 500.
[/vc_column_text][/vc_column][/vc_row][vc_row][vc_column][vc_separator border_width=”5″][/vc_column][/vc_row][vc_row][vc_column width=”2/3″][vc_custom_heading text=”1 hr” use_theme_fonts=”yes”][vc_column_text]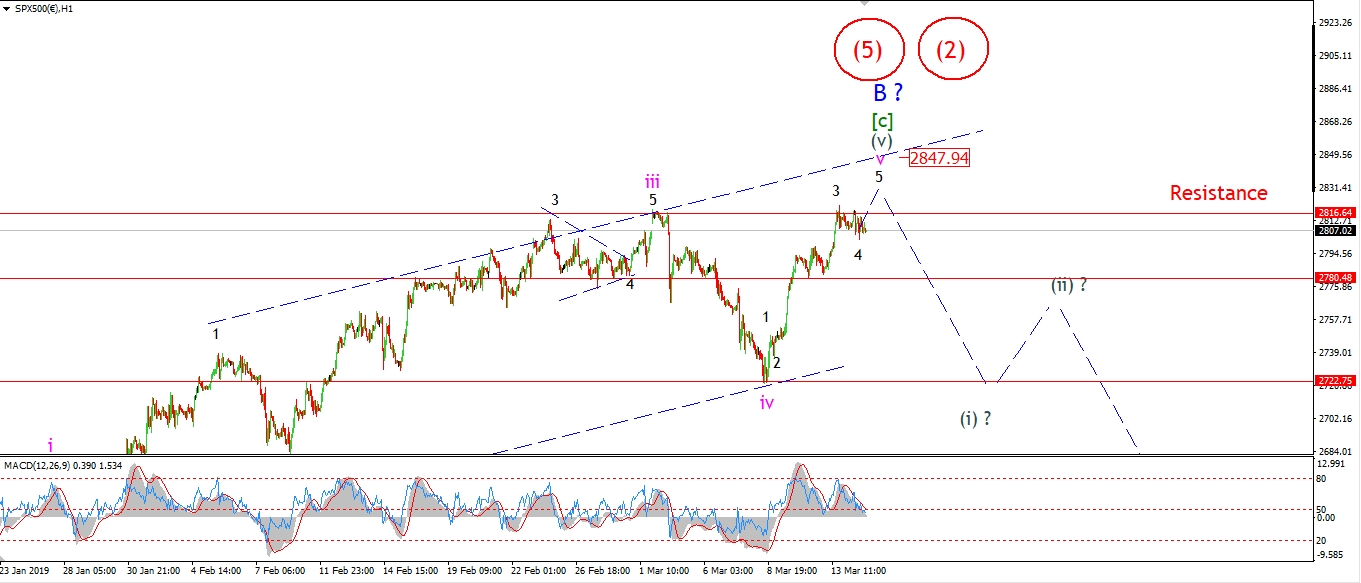 [/vc_column_text][/vc_column][vc_column width=”1/3″][vc_custom_heading text=”4 Hours” use_theme_fonts=”yes”][vc_column_text]
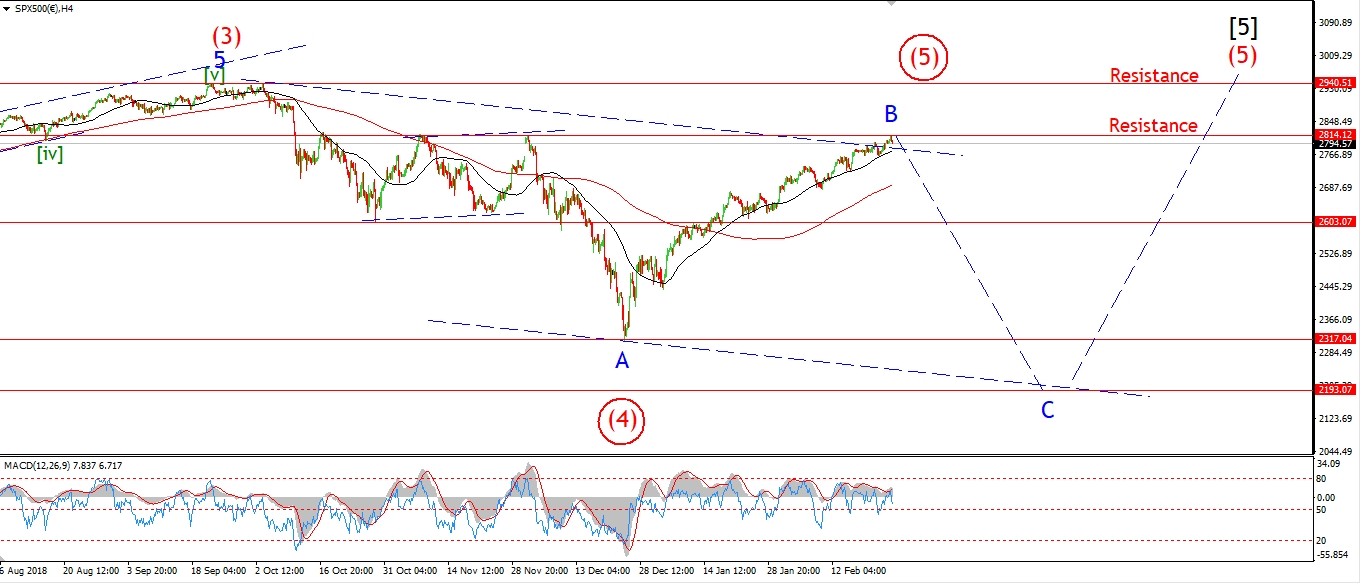 [/vc_column_text][vc_custom_heading text=”Daily” use_theme_fonts=”yes”][vc_column_text]
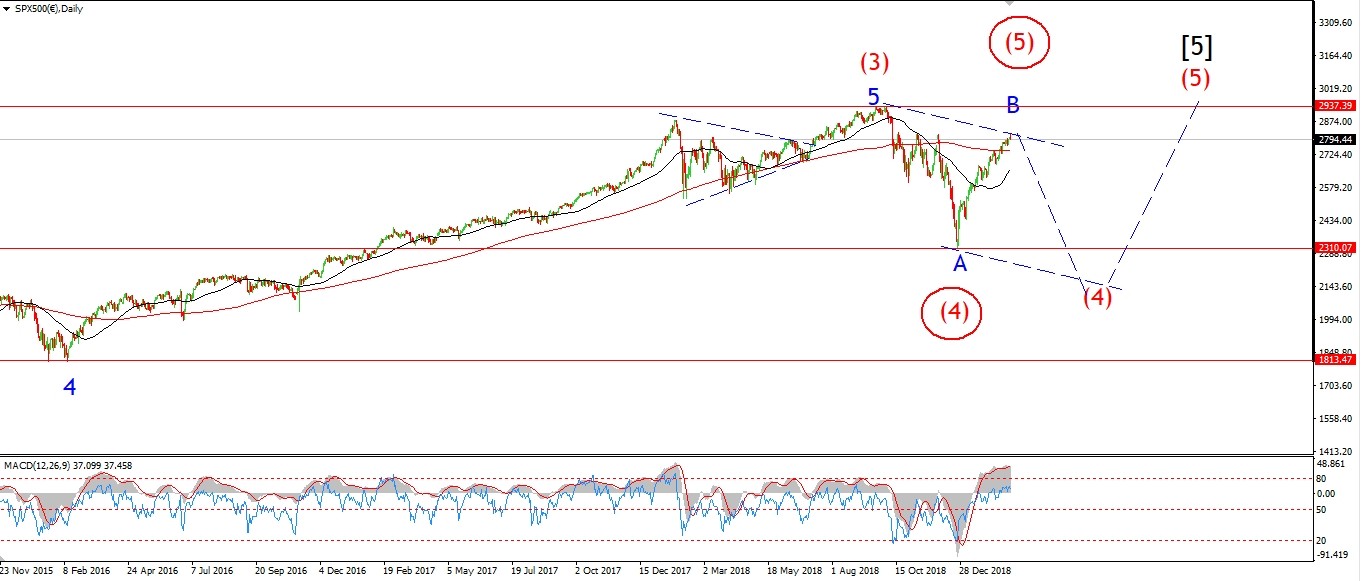 [/vc_column_text][/vc_column][/vc_row]
[vc_row][vc_column][vc_column_text]
Wave ‘v’ of (v) is nearing completion now.
The price has hit the 2816 wall again today
and the price seems to be correcting in a minor wave ‘4’ of ‘v’.
One more pop to about 2848 will hit the upper trend channel line again.
That will complete five waves up in wave [c],
and close out the long awaited top in wave ‘B’.
I have not discarded the alternate counts at all.
In fact,
given the general air of complete bullish abandon in the market,
the idea of a fifth wave in wave (5) fits just as well as a ‘B’ wave or even wave (2).
All of which point lower in a big way from these highs.
Tomorrow;
Wave ‘5’ should be a quick affair and we may even see it complete by tomorrow evening.
If the market hits that trendline and drops sharply below 2780 again.
That will be the first sign that wave (i) down has begun.
[/vc_column_text][/vc_column][/vc_row]
[/_s2If]
[vc_row][vc_column][vc_column_text]
[/vc_column_text][/vc_column][/vc_row]
[vc_row][vc_column][vc_separator border_width=”5″][/vc_column][/vc_row]