
[vc_row][vc_column][vc_separator border_width=”5″][/vc_column][/vc_row]
[vc_row][vc_column][vc_column_text]
Hello to one and all.
[/vc_column_text][/vc_column][/vc_row]
[_s2If current_user_can(access_s2member_ccap_eurusd)]
[vc_row][vc_column][vc_separator border_width=”5″][/vc_column][/vc_row]
[vc_row][vc_column][vc_column_text]
EURUSD
[/vc_column_text][/vc_column][/vc_row]
[vc_row][vc_column][vc_separator border_width=”5″][/vc_column][/vc_row][vc_row][vc_column width=”2/3″][vc_custom_heading text=”1 hr” use_theme_fonts=”yes”][vc_column_text]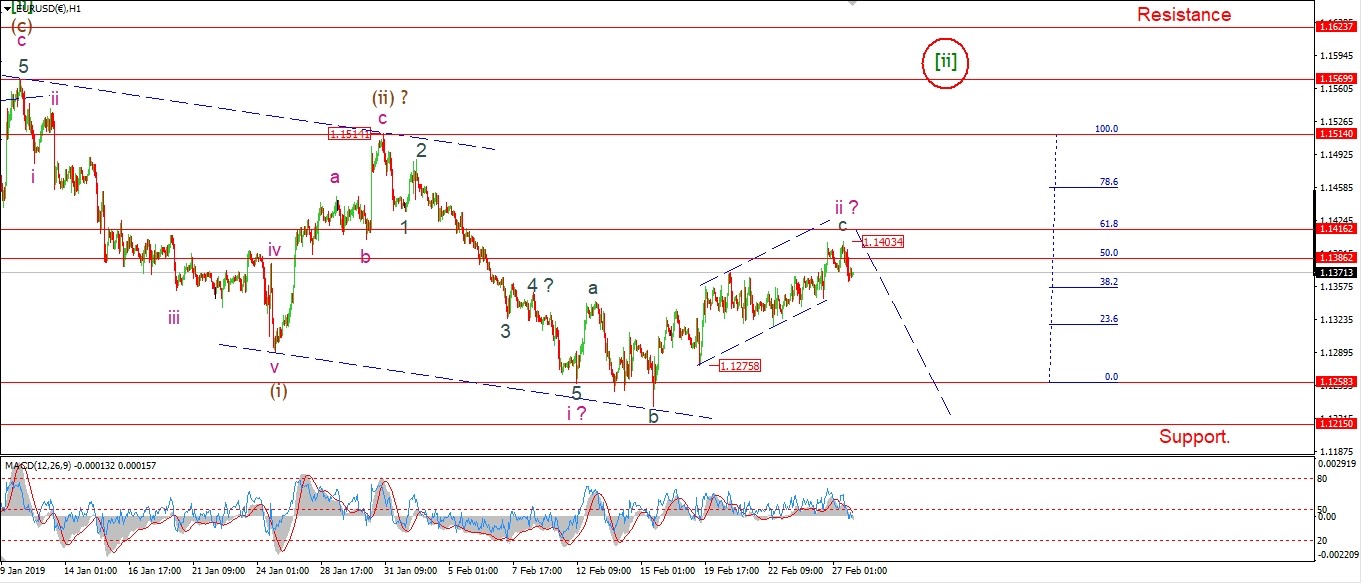 [/vc_column_text][/vc_column][vc_column width=”1/3″][vc_custom_heading text=”4 Hours” use_theme_fonts=”yes”][vc_column_text]
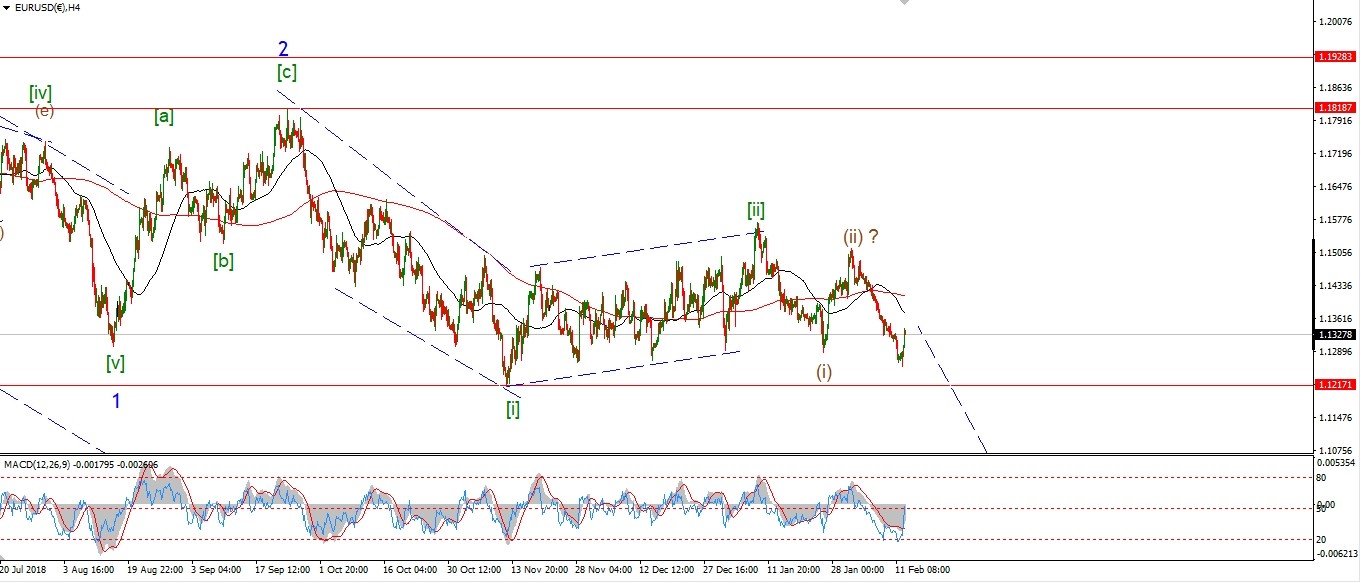 [/vc_column_text][vc_custom_heading text=”Daily” use_theme_fonts=”yes”][vc_column_text]
 [/vc_column_text][/vc_column][/vc_row]
[vc_row][vc_column][vc_column_text]
EURUSD dropped today but this does not yet look impulsive as a start to wave ‘iii’ down yet.
We need to see a drop towards support at 1.1258 again in a clear five waves to call wave ‘ii’ complete.
The alternate count will still allow for a push up to 1.1560 again in wave [ii] green.
But for the moment,
this is less likely now,
as the rise off the lows at 1.1258 has been very corrective looking.
Tomorrow;
Watch for todays high at 1.1405 to hold and wave ‘1’ of ‘iii’ to continue lower.
[/vc_column_text][/vc_column][/vc_row]
[/_s2If]
[_s2If current_user_can(access_s2member_ccap_gbpusd)]
[vc_row][vc_column][vc_separator border_width=”5″][/vc_column][/vc_row][vc_row][vc_column][vc_column_text]
GBPUSD
[/vc_column_text][/vc_column][/vc_row][vc_row][vc_column][vc_separator border_width=”5″][/vc_column][/vc_row][vc_row][vc_column width=”2/3″][vc_custom_heading text=”1 hr” use_theme_fonts=”yes”][vc_column_text]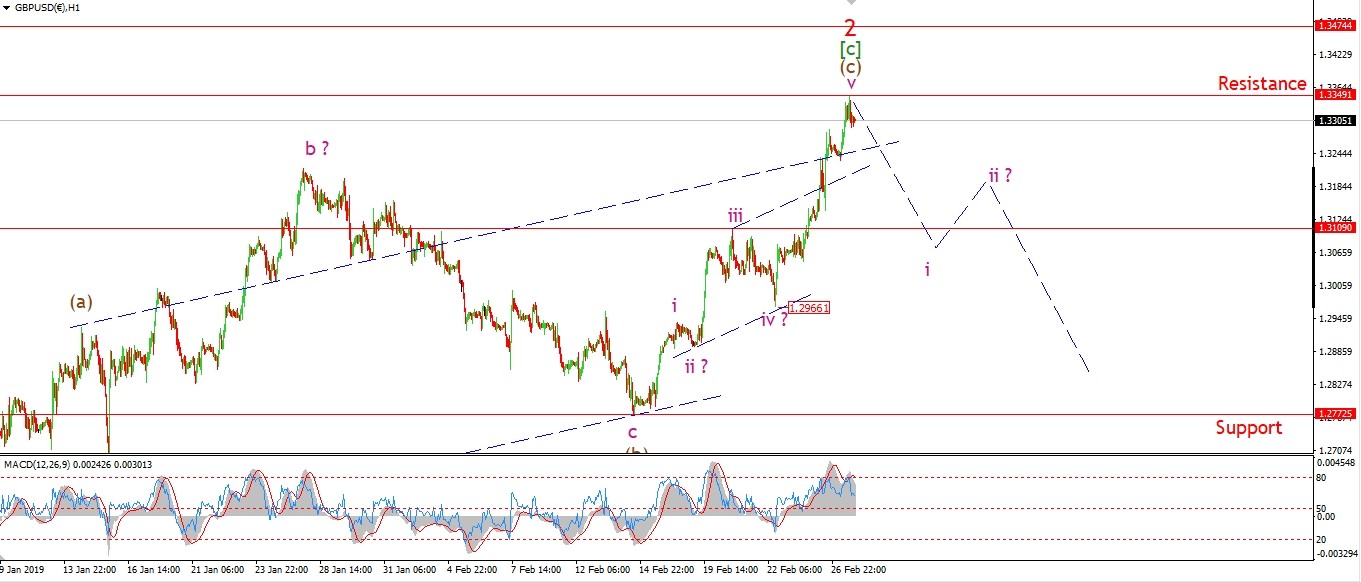 [/vc_column_text][/vc_column][vc_column width=”1/3″][vc_custom_heading text=”4 Hours” use_theme_fonts=”yes”][vc_column_text]
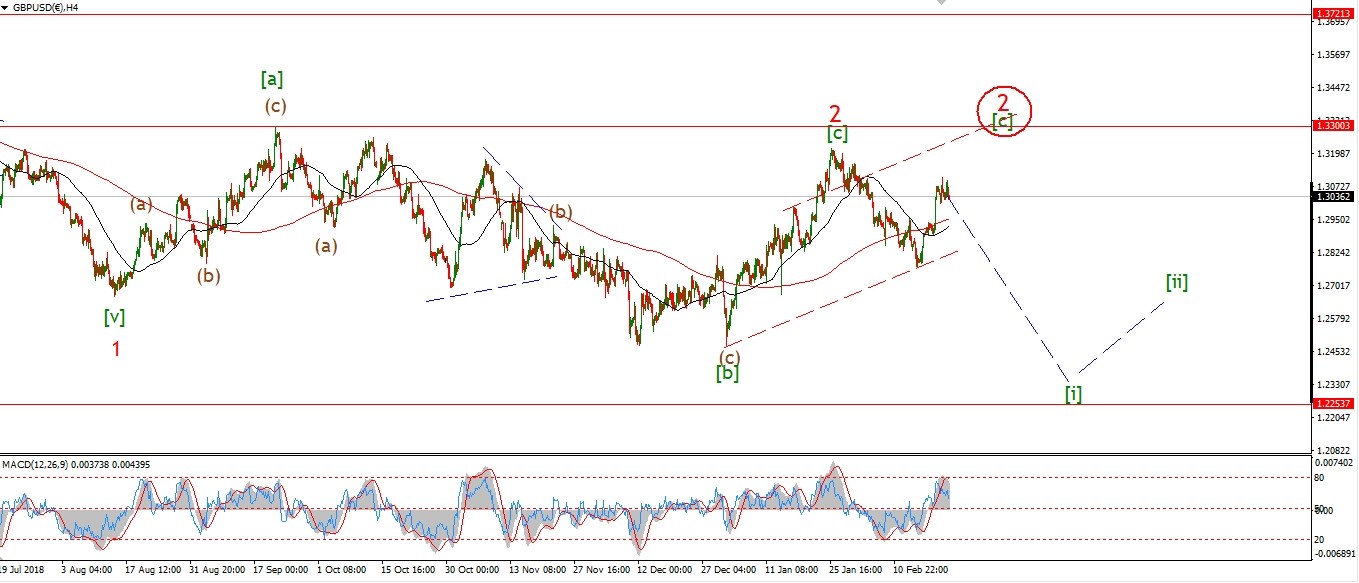 [/vc_column_text][vc_custom_heading text=”Daily” use_theme_fonts=”yes”][vc_column_text]
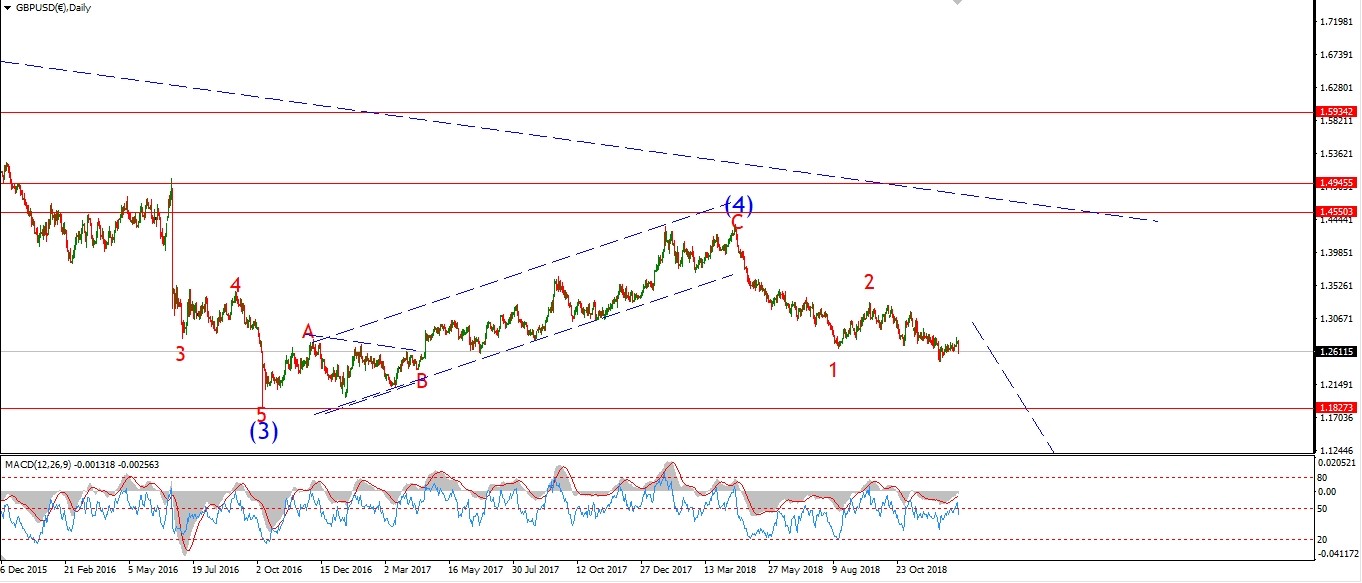 [/vc_column_text][/vc_column][/vc_row]
[vc_row][vc_column][vc_column_text]
Cable has created a throw-over above the upper trend channel line in wave [c] green.
Todays rally broke above the target at 1.3300,
and so far this evening the price has dropped off that level.
If this decline continues in five waves tomorrow and breaks the wave ‘iii’ high at 1.3109,
that will signal that wave ‘i’ down is underway.
Tomorrow;
Wave ‘2’ is now back at resistance again and completed a three wave rise.
so I expect that it we will see a turn lower to begin wave ‘3’ before the end of the week.
Watch for five waves down to begin.
[/vc_column_text][/vc_column][/vc_row]
[/_s2If]
[_s2If current_user_can(access_s2member_ccap_usdjpy)]
[vc_row][vc_column][vc_separator border_width=”5″][/vc_column][/vc_row][vc_row][vc_column][vc_column_text]
USDJPY
[/vc_column_text][/vc_column][/vc_row][vc_row][vc_column][vc_separator border_width=”5″][/vc_column][/vc_row][vc_row][vc_column width=”2/3″][vc_custom_heading text=”1 hr” use_theme_fonts=”yes”][vc_column_text]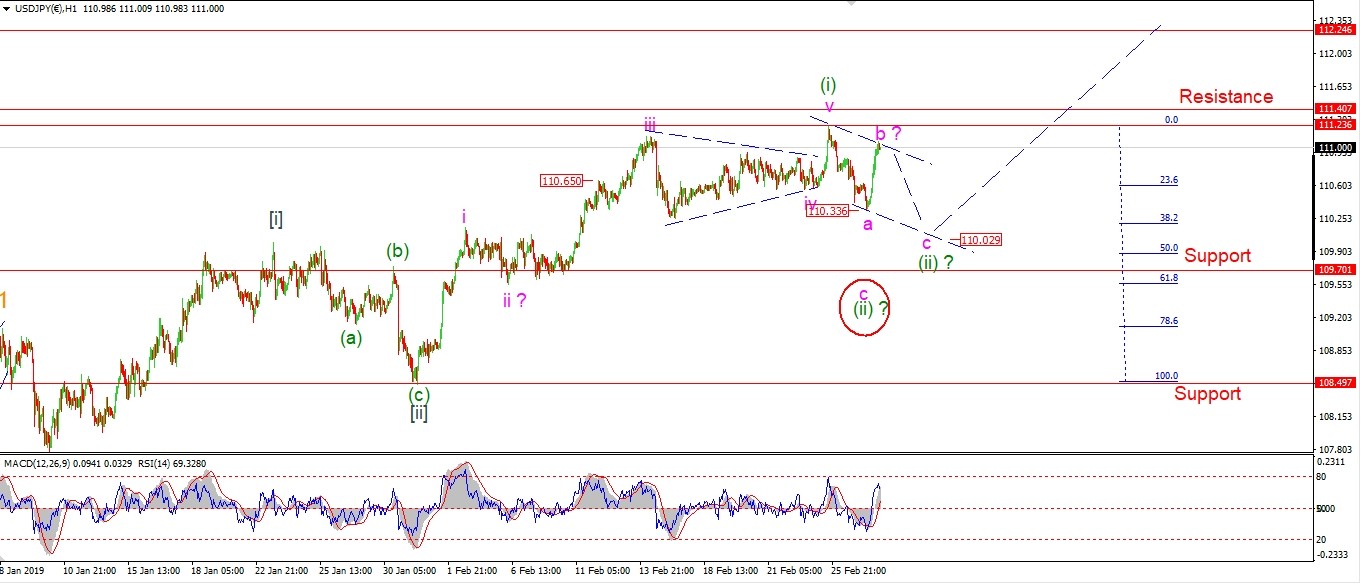 [/vc_column_text][/vc_column][vc_column width=”1/3″][vc_custom_heading text=”4 Hours” use_theme_fonts=”yes”][vc_column_text]
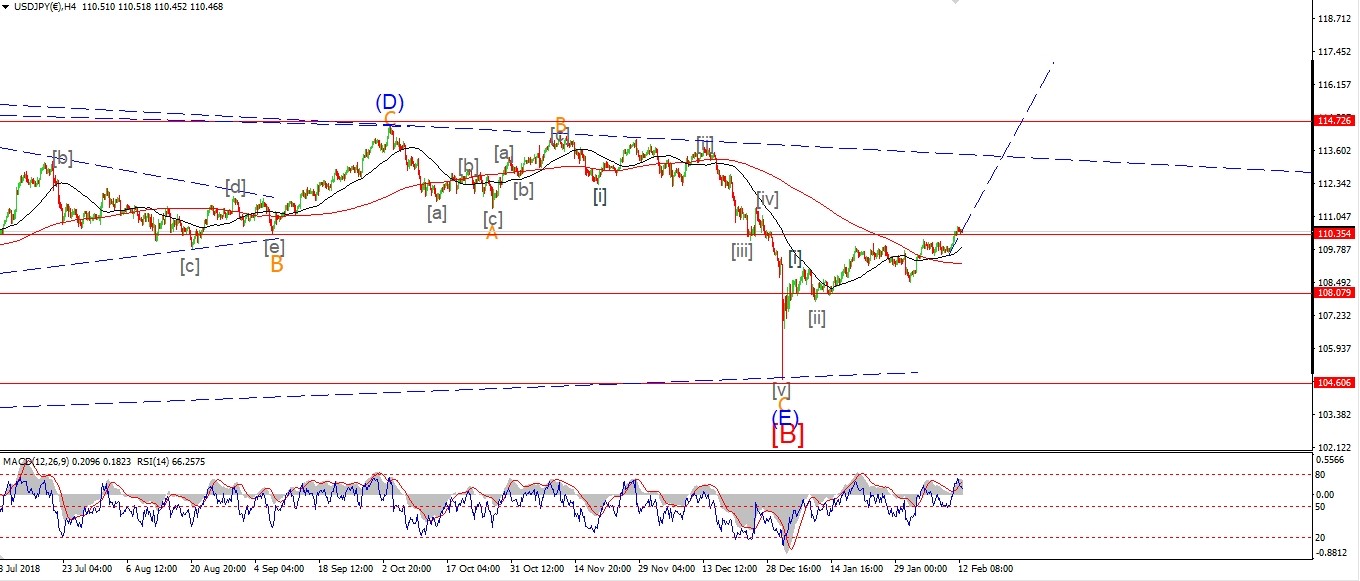 [/vc_column_text][vc_custom_heading text=”Daily” use_theme_fonts=”yes”][vc_column_text]
 [/vc_column_text][/vc_column][/vc_row]
[vc_row][vc_column][vc_column_text]
USDJPY rallied today to a lower high below the wave (i) high at 111.23.
This is labelled wave ‘b’ of (ii),
with wave ‘c’ left to drop back to about 110.00 again
to complete a three wave correction in wave (ii).
If we fail to drop in wave ‘c’ tomorrow,
Then it is possible that wave (ii) is already complete at 110.33.
This is the alternate count now.
This will be triggered if the market now creates a new impulse structure higher to begin wave (iii) green.
Tomorrow;
Watch for wave ‘c’ to decline with a minimum target at 110.33.
[/vc_column_text][/vc_column][/vc_row]
[/_s2If]
[_s2If current_user_can(access_s2member_ccap_dow_jones)]
[vc_row][vc_column][vc_separator border_width=”5″][/vc_column][/vc_row][vc_row][vc_column][vc_column_text]
DOW JONES INDUSTRIALS
[/vc_column_text][/vc_column][/vc_row][vc_row][vc_column][vc_separator border_width=”5″][/vc_column][/vc_row][vc_row][vc_column width=”2/3″][vc_custom_heading text=”1 hr” use_theme_fonts=”yes”][vc_column_text]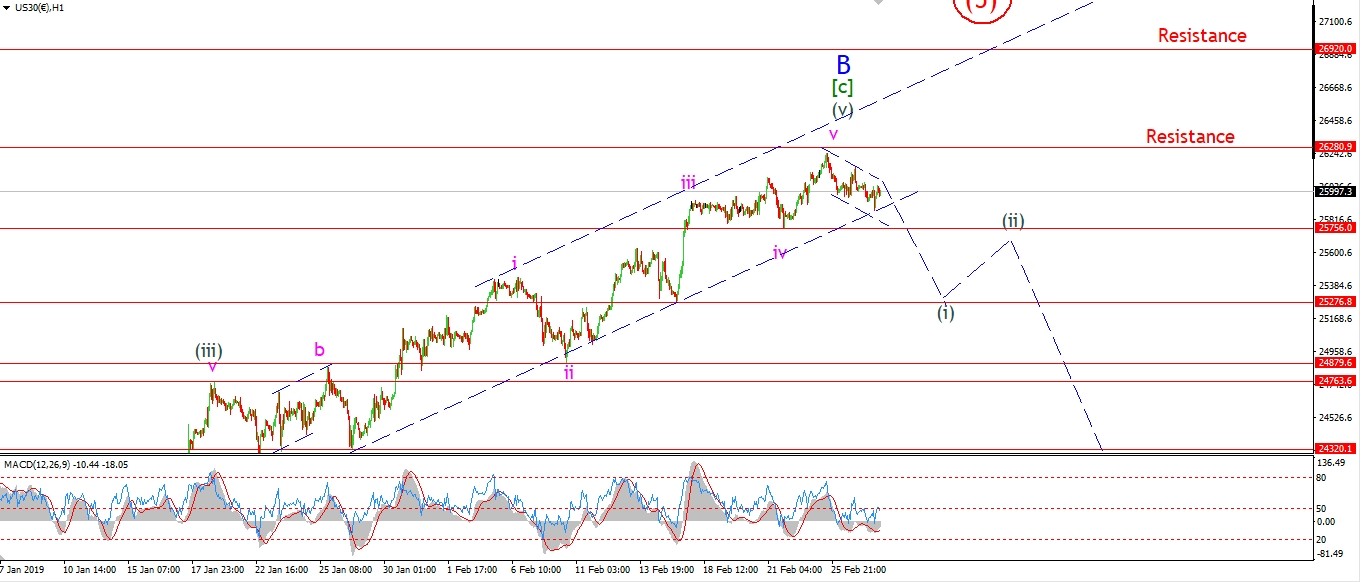 [/vc_column_text][/vc_column][vc_column width=”1/3″][vc_custom_heading text=”4 Hours” use_theme_fonts=”yes”][vc_column_text]
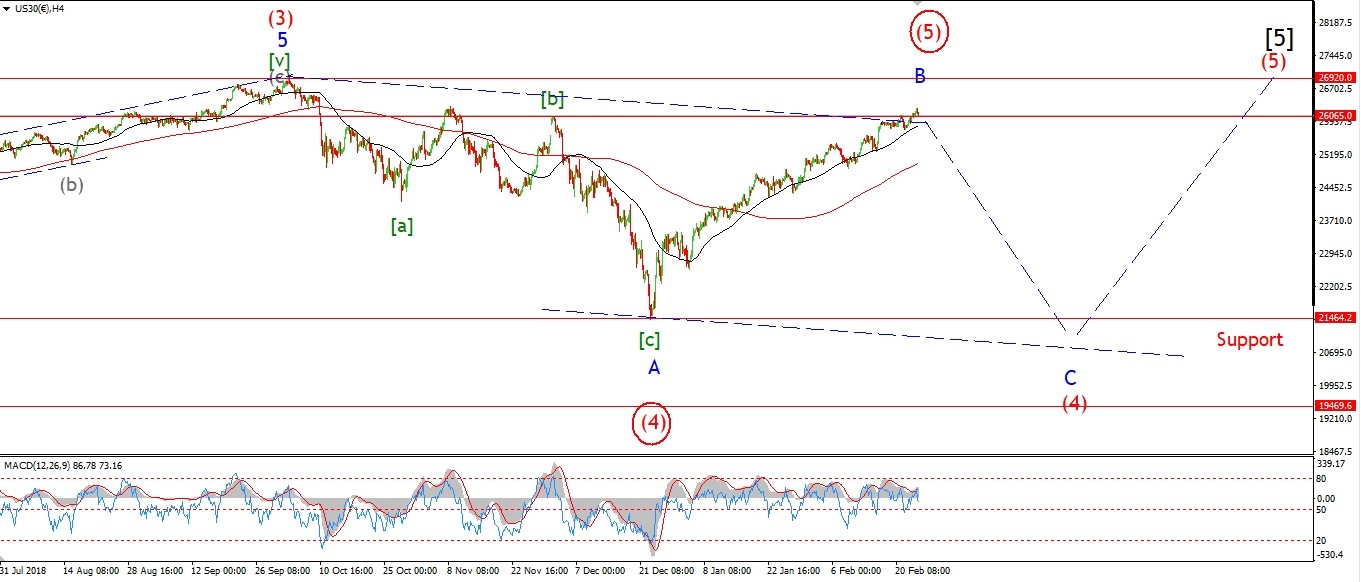 [/vc_column_text][vc_custom_heading text=”Daily” use_theme_fonts=”yes”][vc_column_text]
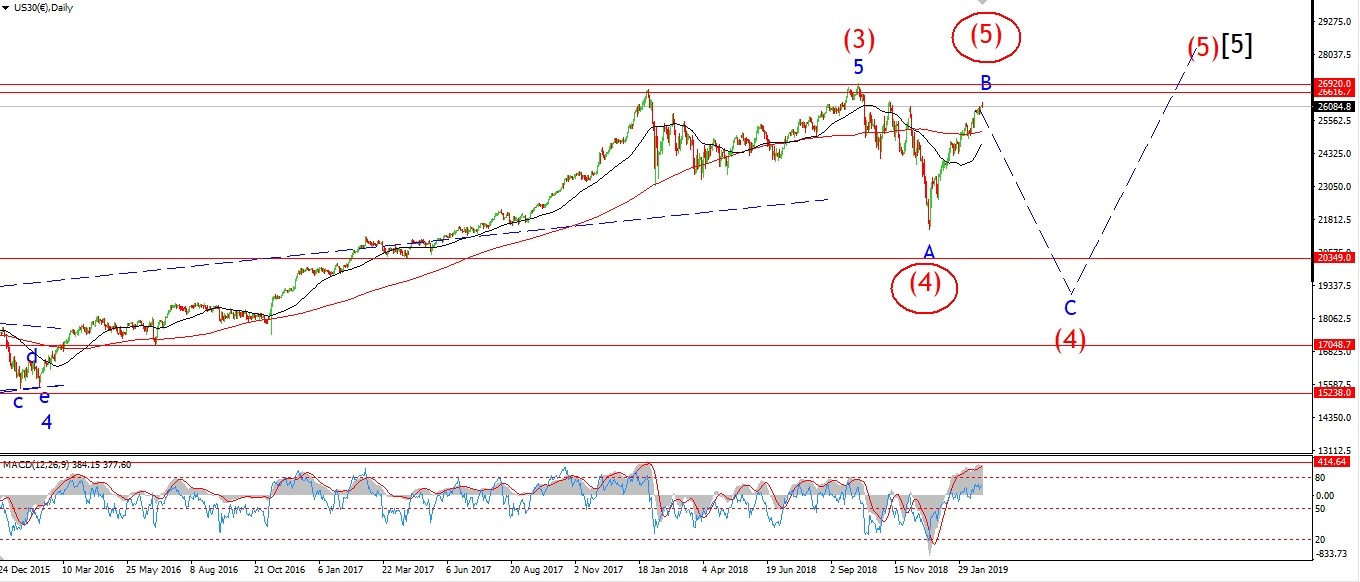 [/vc_column_text][/vc_column][/vc_row]
[vc_row][vc_column][vc_column_text]
So far we have a three wave decline off the recent high.
The price has again retraced half of the drop.
So unless we get an acceleration lower tomorrow below 25756,
this will remain a corrective structure
and we can expect another new high in wave ‘B’ or (5).
In a way,
I would prefer a new all time high again to trigger the alternate count.
This would leave the way clear for a new beginning into the bearmarket.
But for the moment I will keep with the wave ‘B’ idea,
and let wave ‘C’ carry us lower to support at 21000 again.
Tomorrow;
If wave ‘v’ pink is going to extend higher as wave ‘iii’ has just done,
Then we could break that all time high with ease.
For now I will look for an end of the wave ‘B’ rally with a five wave decline off a nearby high.
Watch for a break of 25756.
[/vc_column_text][/vc_column][/vc_row]
[/_s2If]
[_s2If current_user_can(access_s2member_ccap_gold)]
[vc_row][vc_column][vc_separator border_width=”5″][/vc_column][/vc_row][vc_row][vc_column][vc_column_text]
GOLD
[/vc_column_text][/vc_column][/vc_row][vc_row][vc_column][vc_separator border_width=”5″][/vc_column][/vc_row][vc_row][vc_column width=”2/3″][vc_custom_heading text=”1 hr” use_theme_fonts=”yes”][vc_column_text]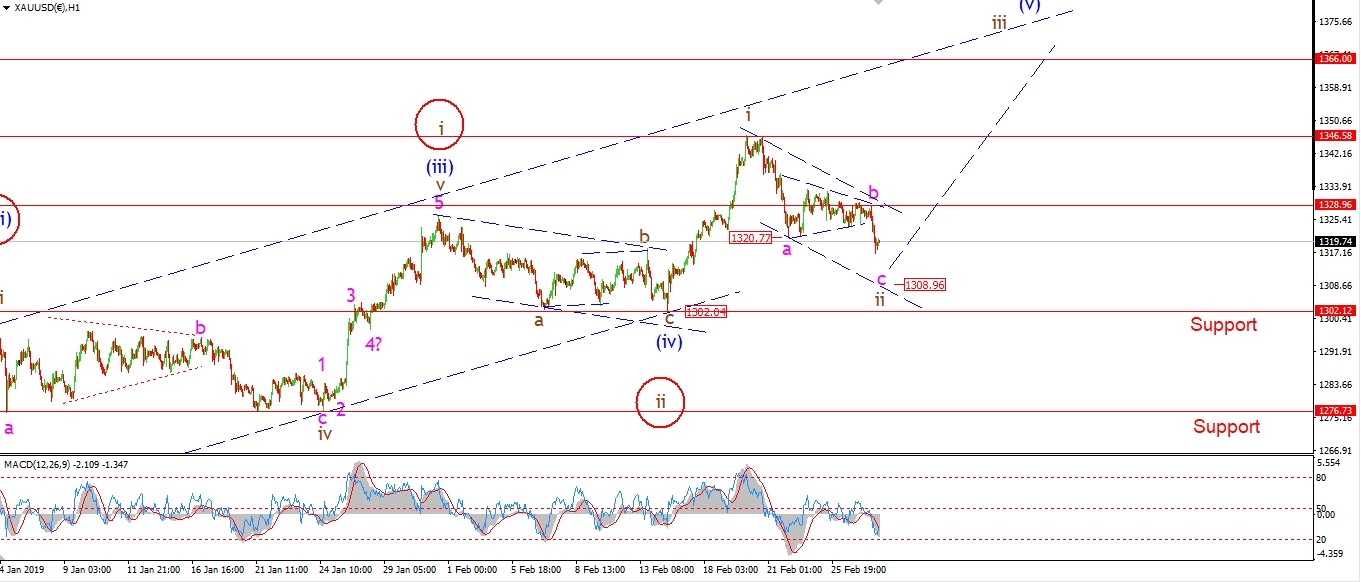 [/vc_column_text][/vc_column][vc_column width=”1/3″][vc_custom_heading text=”4 Hours” use_theme_fonts=”yes”][vc_column_text]
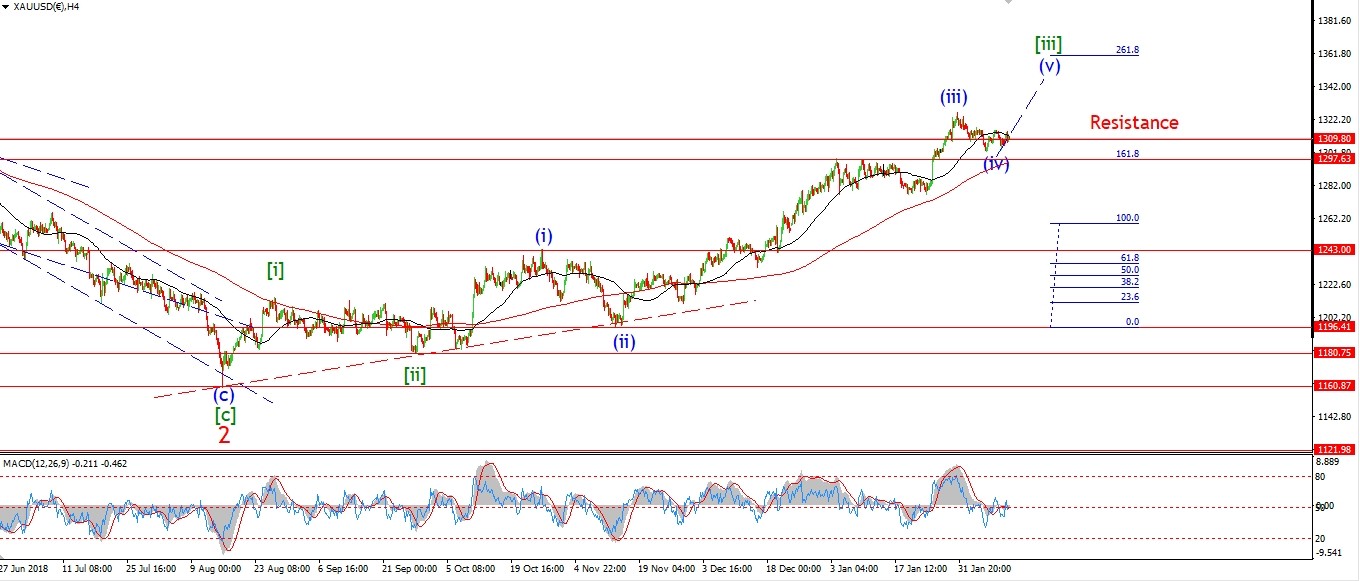 [/vc_column_text][vc_custom_heading text=”Daily” use_theme_fonts=”yes”][vc_column_text]
 [/vc_column_text][/vc_column][/vc_row]
[vc_row][vc_column][vc_column_text]
GOLD completed a triangle wave ‘b’ this morning.
And wave ‘c’ dropped to break the minimum target at wave ‘a’ at 1320.
Wave ‘c’ will meet the lower trend channel line at 1308.
At that point we support at 1302 must hold
and wave ‘iii’ of (V) should then carry us higher again.
Tomorrow;
Watch for wave ‘c’ to complete above 1302,
We may even get the initial move up in wave ‘iii’ off that low.
[/vc_column_text][/vc_column][/vc_row]
[/_s2If]
[_s2If current_user_can(access_s2member_ccap_crude)]
[vc_row][vc_column][vc_separator border_width=”5″][/vc_column][/vc_row][vc_row][vc_column][vc_column_text]
U.S CRUDE OIL
[/vc_column_text][/vc_column][/vc_row][vc_row][vc_column][vc_separator border_width=”5″][/vc_column][/vc_row][vc_row][vc_column width=”2/3″][vc_custom_heading text=”1 hr” use_theme_fonts=”yes”][vc_column_text]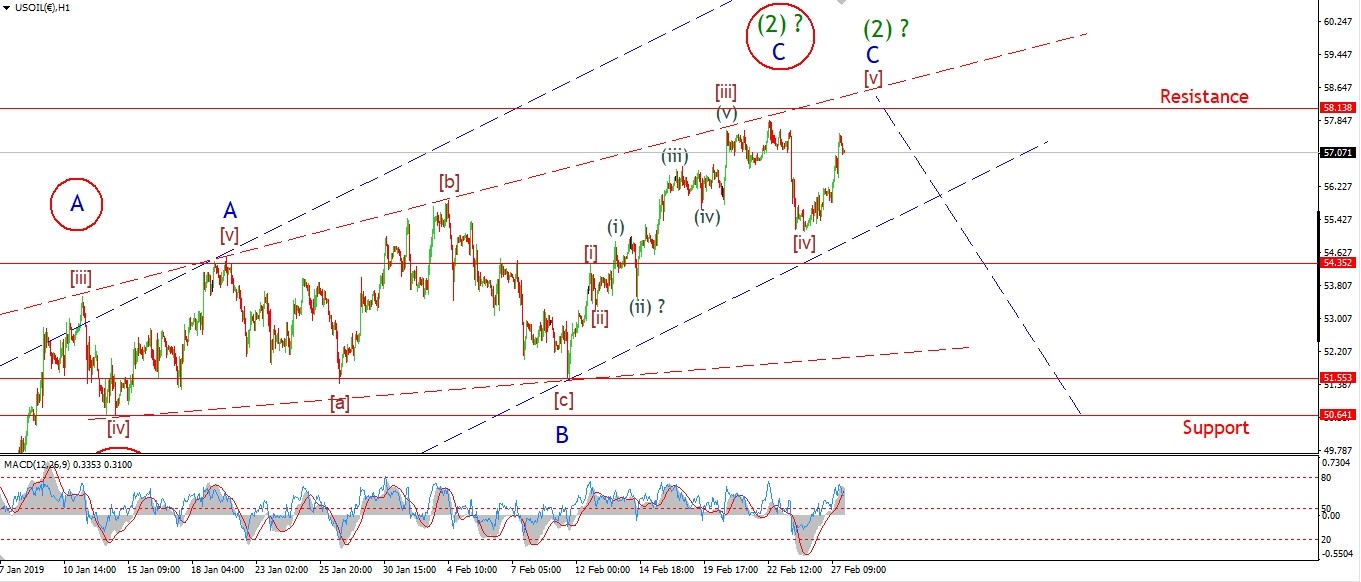 [/vc_column_text][/vc_column][vc_column width=”1/3″][vc_custom_heading text=”4 Hours” use_theme_fonts=”yes”][vc_column_text]
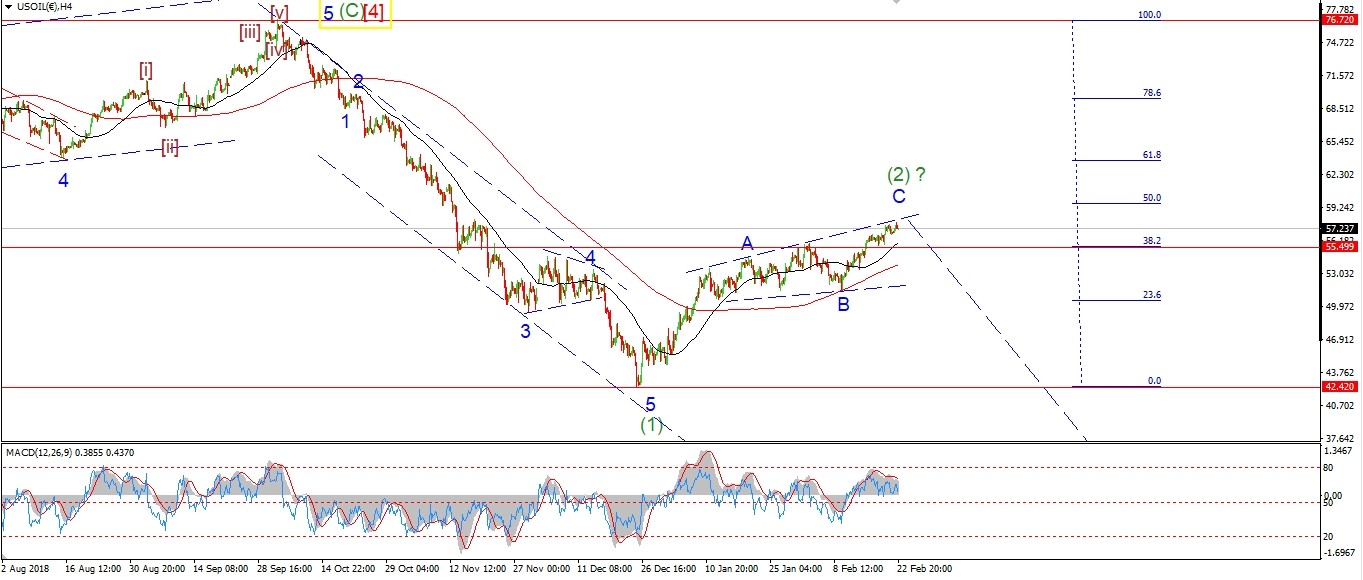 [/vc_column_text][vc_custom_heading text=”Daily” use_theme_fonts=”yes”][vc_column_text]
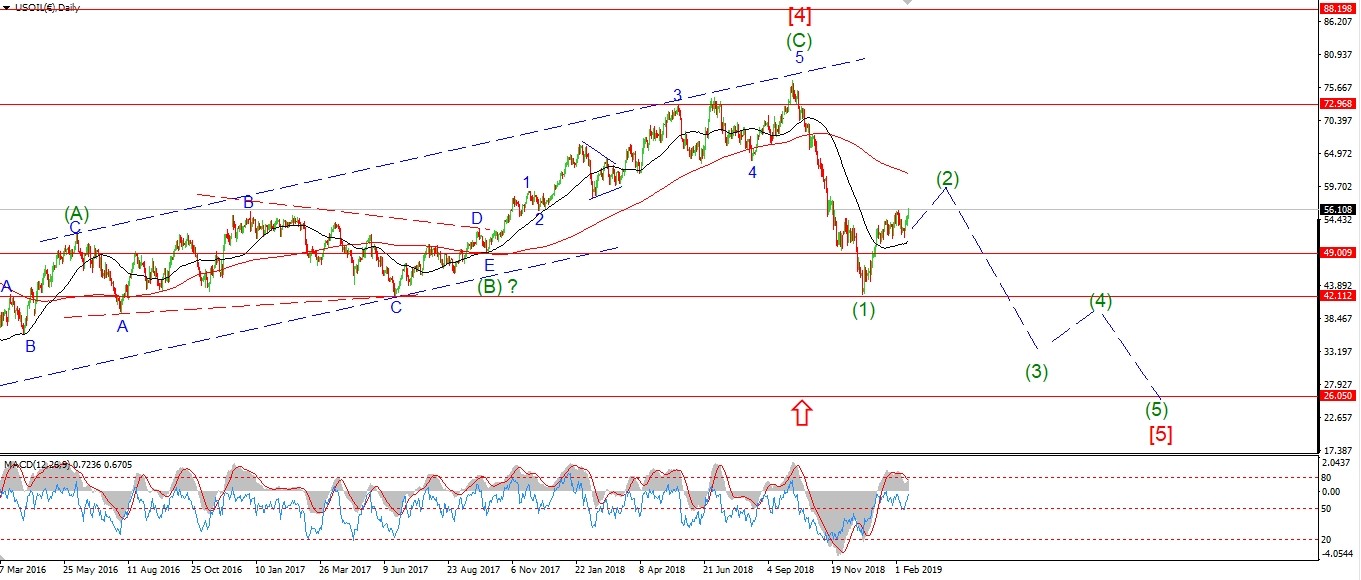 [/vc_column_text][/vc_column][/vc_row]
[vc_row][vc_column][vc_column_text]
Crude rallied strongly today which has forced a rethink of the wave count.
I have re-labelled wave ‘C’ to account for todays rally.
This shows wave [iv] as an expanded flat,
and wave [v] now underway.
This suggests we will see another high above 58.00 to complete a fifth wave.
And then I will look for another turn lower again
to begin a possible decline in wave (3).
Tomorrow;
A break of the recent high again will confirm this new count.
Although I think it will be a short lived rally.
[/vc_column_text][/vc_column][/vc_row]
[/_s2If]
[_s2If current_user_can(access_s2member_ccap_us10yr)]
[vc_row][vc_column][vc_separator border_width=”5″][/vc_column][/vc_row][vc_row][vc_column][vc_column_text]
US 10 yr Treasuries.
[/vc_column_text][/vc_column][/vc_row][vc_row][vc_column][vc_separator border_width=”5″][/vc_column][/vc_row][vc_row][vc_column width=”2/3″][vc_custom_heading text=”1 hr” use_theme_fonts=”yes”][vc_column_text]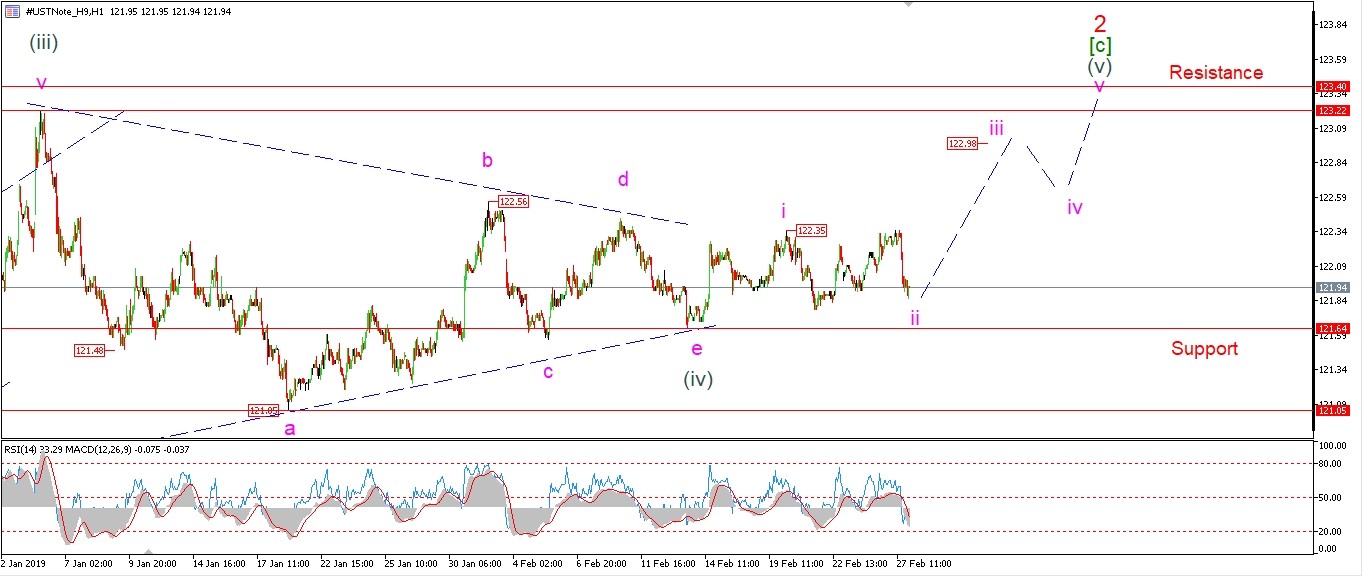 [/vc_column_text][/vc_column][vc_column width=”1/3″][vc_custom_heading text=”4 Hours” use_theme_fonts=”yes”][vc_column_text]
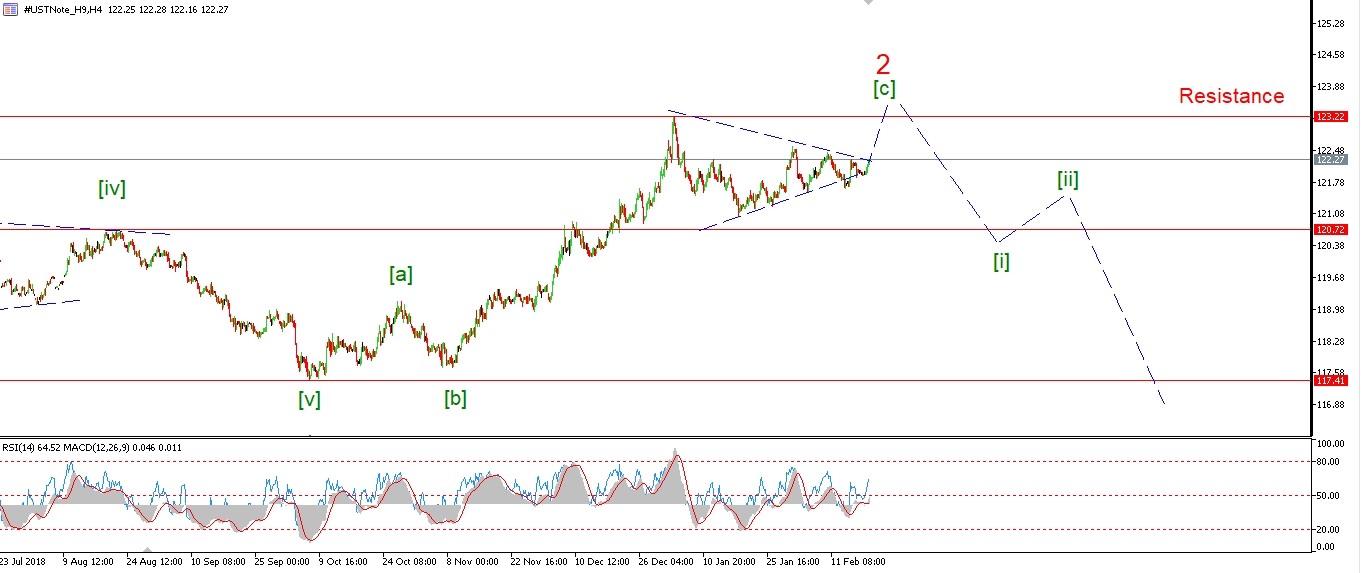 [/vc_column_text][vc_custom_heading text=”Daily” use_theme_fonts=”yes”][vc_column_text]
 [/vc_column_text][/vc_column][/vc_row]
[vc_row][vc_column][vc_column_text]
The 10YR has pushed this current short term count to its limits.
The sharp drop today looks like a small five wave structure.
This suggests a drop in a ‘c’ wave within wave ‘ii’.
If this count is to remain valid,
then price must halt this decline above 121.64 at the wave (iv) low.
And then head higher in wave ‘iii’ of (V).
Tomorrow;
Watch for wave ‘ii’ to hold above 121.64 and then return higher to begin wave ‘iii’.
A break of 122.35 will now confirm of wave ‘iii’.
[/vc_column_text][/vc_column][/vc_row]
[/_s2If]
[_s2If current_user_can(access_s2member_ccap_silver)]
[vc_row][vc_column][vc_separator border_width=”5″][/vc_column][/vc_row][vc_row][vc_column][vc_column_text]
SILVER
[/vc_column_text][/vc_column][/vc_row][vc_row][vc_column][vc_separator border_width=”5″][/vc_column][/vc_row][vc_row][vc_column width=”2/3″][vc_custom_heading text=”1 hr” use_theme_fonts=”yes”][vc_column_text]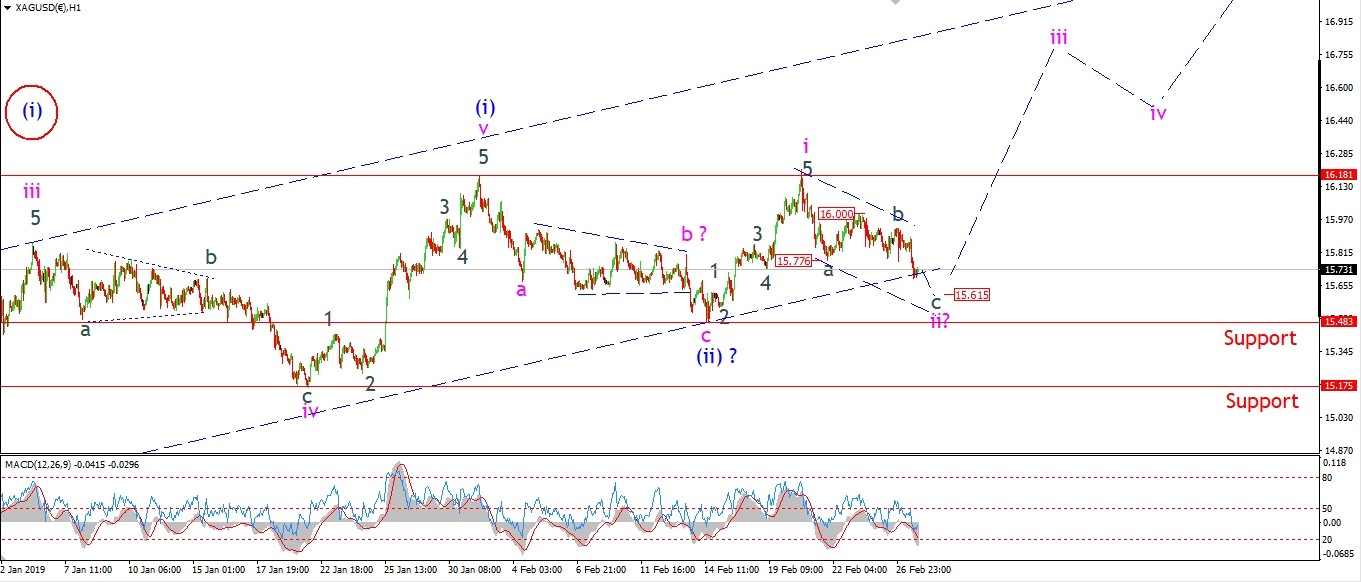 [/vc_column_text][/vc_column][vc_column width=”1/3″][vc_custom_heading text=”4 Hours” use_theme_fonts=”yes”][vc_column_text]
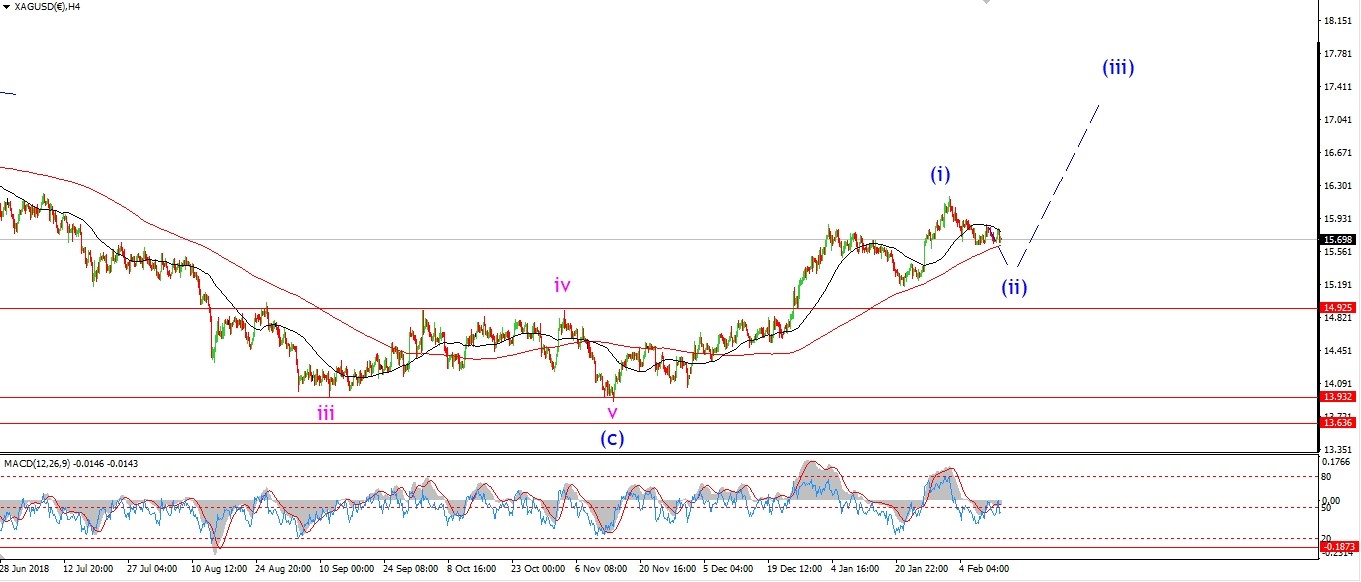 [/vc_column_text][vc_custom_heading text=”Daily” use_theme_fonts=”yes”][vc_column_text]
 [/vc_column_text][/vc_column][/vc_row]
[vc_row][vc_column][vc_column_text]
Silver has hit the minimum target for wave ‘c’ by breaking the wave ‘a’ low at 15.77.
Wave ‘b’ of ‘ii’ completed in a running flat.
The decline must now hold above 15.48 as wave ‘c’ completes.
We are now close to completing wave ‘ii’ in three waves,
so wave ‘iii’ up should begin before then end of the week.
A break of 16.00 again should signal that wave ‘iii’ has begun.
Tomorrow;
Watch for wave ‘c’ to complete above 15.48.
[/vc_column_text][/vc_column][/vc_row]
[/_s2If]
[_s2If current_user_can(access_s2member_ccap_sp500)]
[vc_row][vc_column][vc_separator border_width=”5″][/vc_column][/vc_row][vc_row][vc_column][vc_column_text]
S&P 500.
[/vc_column_text][/vc_column][/vc_row][vc_row][vc_column][vc_separator border_width=”5″][/vc_column][/vc_row][vc_row][vc_column width=”2/3″][vc_custom_heading text=”1 hr” use_theme_fonts=”yes”][vc_column_text]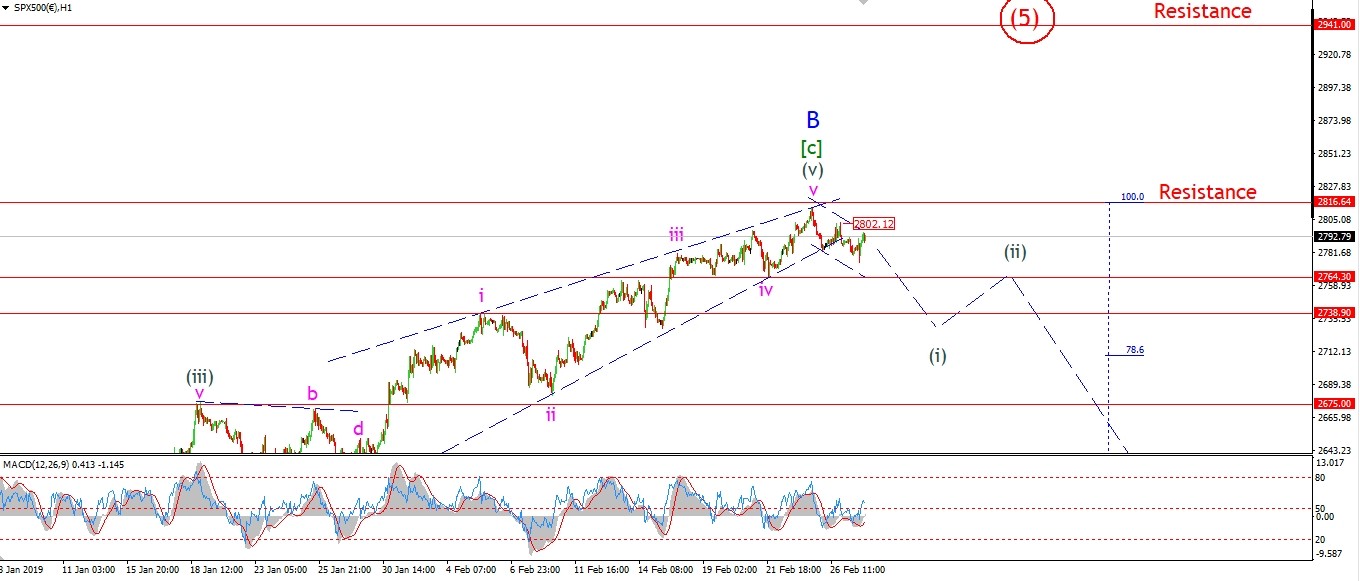 [/vc_column_text][/vc_column][vc_column width=”1/3″][vc_custom_heading text=”4 Hours” use_theme_fonts=”yes”][vc_column_text]
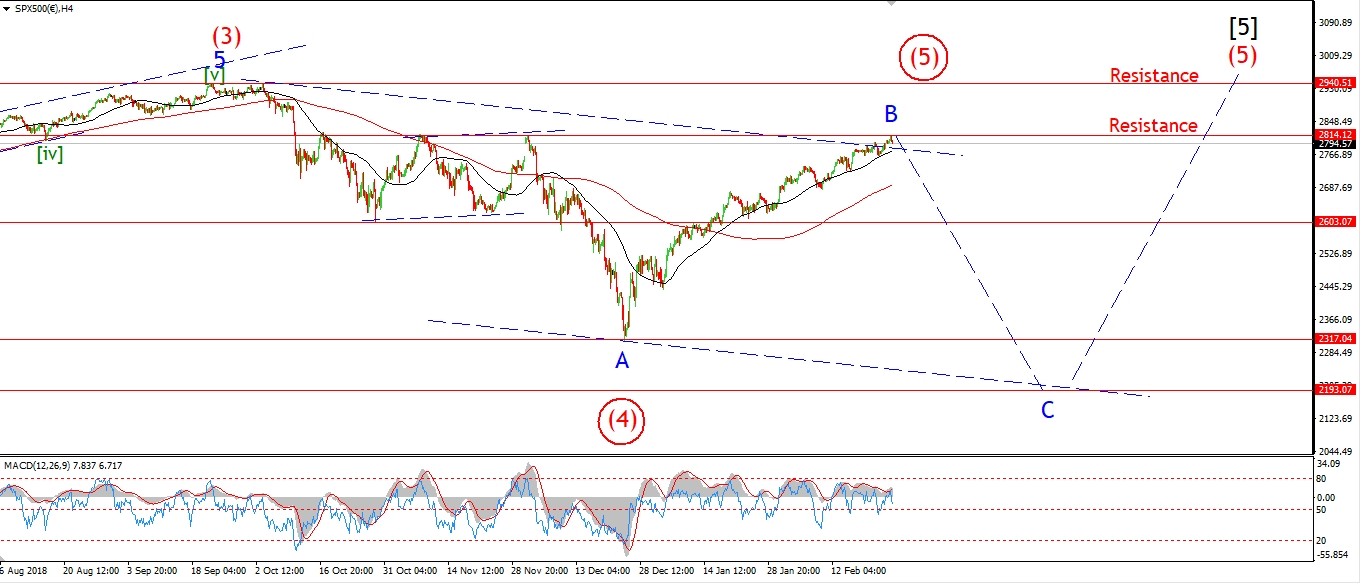 [/vc_column_text][vc_custom_heading text=”Daily” use_theme_fonts=”yes”][vc_column_text]
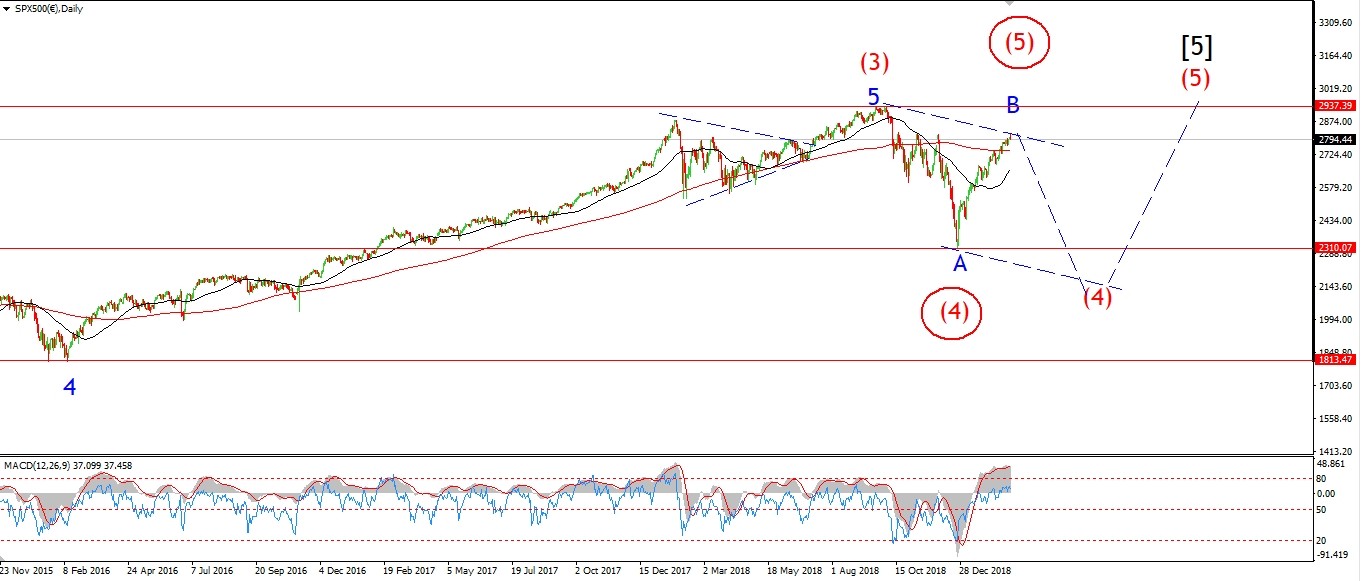 [/vc_column_text][/vc_column][/vc_row]
[vc_row][vc_column][vc_column_text]
The S&P has created a three wave drop off the high labelled wave ‘v’.
It is quite likely that this is just a correction now,
And if the price holds above 2764,
wave ‘v’ should then extend higher again to create a larger five wave structure.
As with the DOW.
This will bring the market close to a new high above the September highs at 2941.
If that level breaks,
I will be switching to the alternate count,
and then looking for the real bear-market to begin with force.
The way I see it, each new high is creating an even larger bearish potential in that alternate count.
Tomorrow;
If price breaks 2802 again,
that will signal that wave ‘v’ is getting ready to extend.
[/vc_column_text][/vc_column][/vc_row]
[/_s2If]
[vc_row][vc_column][vc_column_text]
[/vc_column_text][/vc_column][/vc_row]
[vc_row][vc_column][vc_separator border_width=”5″][/vc_column][/vc_row]