
[vc_row][vc_column][vc_separator border_width=”5″][/vc_column][/vc_row]
[vc_row][vc_column][vc_column_text]
Good evening to one and all.
A man once stated that the stock market had ” reached what looks like a permanently high plateau “.
Irving Fisher never lived that statement down as it came just nine days before the final high in 1929.
Of course nowadays it is taken for granted that the market will remain sky high, permanently.
Without a risk to be seen on the horizon,
we may as well all just jump on board the freight-train to riches.
All you have to do is buy!
Not so fast!
I will present the alternate counts for stocks below,
and it is not in the slightest bit bullish at all.
[/vc_column_text][/vc_column][/vc_row]
[_s2If current_user_can(access_s2member_ccap_eurusd)]
[vc_row][vc_column][vc_separator border_width=”5”][/vc_column][/vc_row]
[vc_row][vc_column][vc_column_text]
EURUSD
[/vc_column_text][/vc_column][/vc_row]
[vc_row][vc_column][vc_separator border_width=”5″][/vc_column][/vc_row][vc_row][vc_column width=”2/3″][vc_custom_heading text=”1 hr” use_theme_fonts=”yes”][vc_column_text]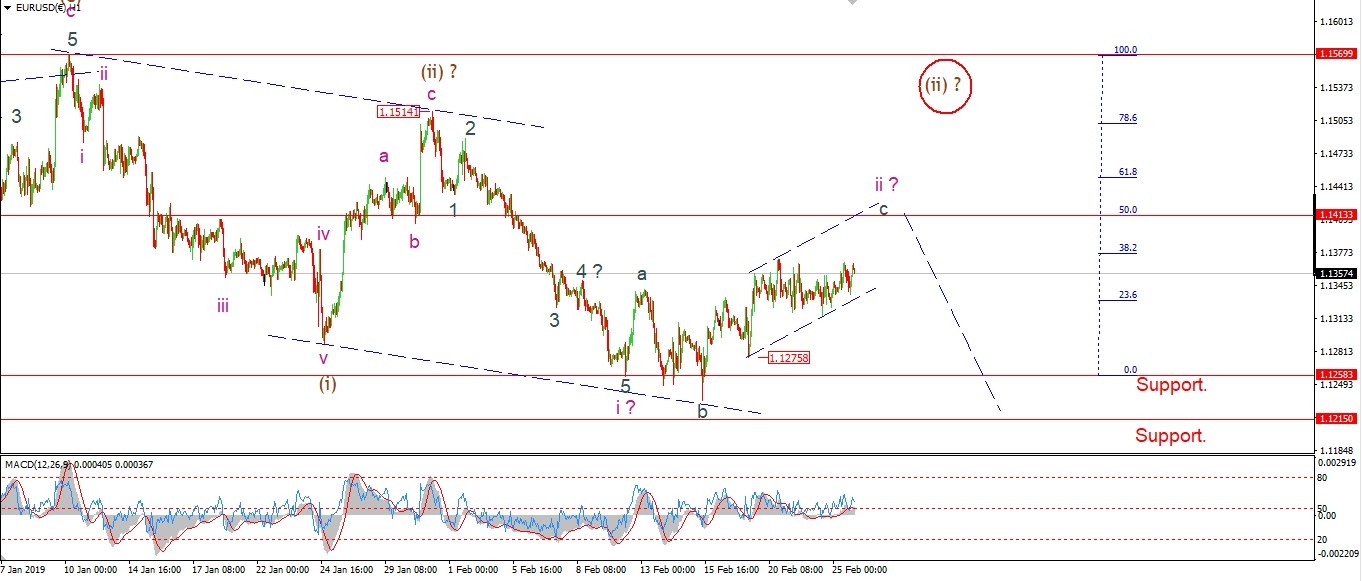 [/vc_column_text][/vc_column][vc_column width=”1/3″][vc_custom_heading text=”4 Hours” use_theme_fonts=”yes”][vc_column_text]
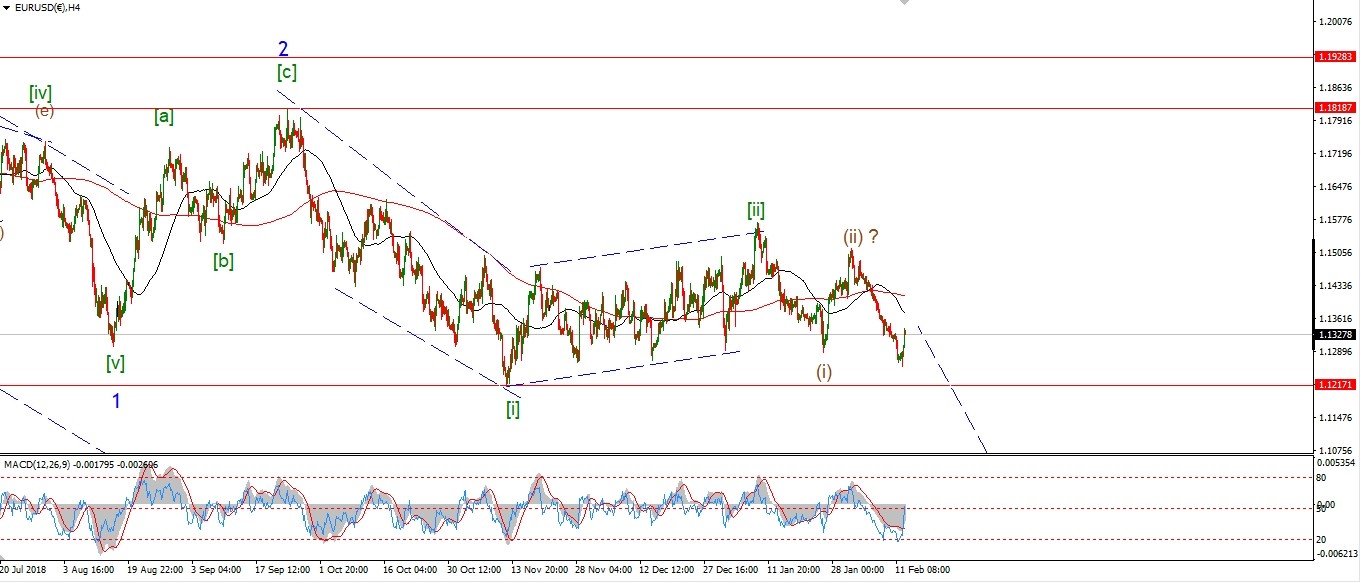 [/vc_column_text][vc_custom_heading text=”Daily” use_theme_fonts=”yes”][vc_column_text]
 [/vc_column_text][/vc_column][/vc_row]
[vc_row][vc_column][vc_column_text]
EURUSD has risen again off Fridays lows,
but again the price has not made much headway.
With this in mind, I don’t think wave ‘c’ of ‘ii’ is complete yet.
The 50% retracement of wave ‘i’ lies at 1.1413,
this level now looks likely to close out wave ‘ii’.
And at that point I will be looking for another impulsive turn lower to lead into wave ‘iii’ of (iii).
Tomorrow;
Watch for a completed wave ‘ii’ at 1.1413.
Lets see if we get a turn lower into wave ‘iii’ by the end of tomorrows trade.
[/vc_column_text][/vc_column][/vc_row]
[/_s2If]
[_s2If current_user_can(access_s2member_ccap_gbpusd)]
[vc_row][vc_column][vc_separator border_width=”5″][/vc_column][/vc_row][vc_row][vc_column][vc_column_text]
GBPUSD
[/vc_column_text][/vc_column][/vc_row][vc_row][vc_column][vc_separator border_width=”5″][/vc_column][/vc_row][vc_row][vc_column width=”2/3″][vc_custom_heading text=”1 hr” use_theme_fonts=”yes”][vc_column_text]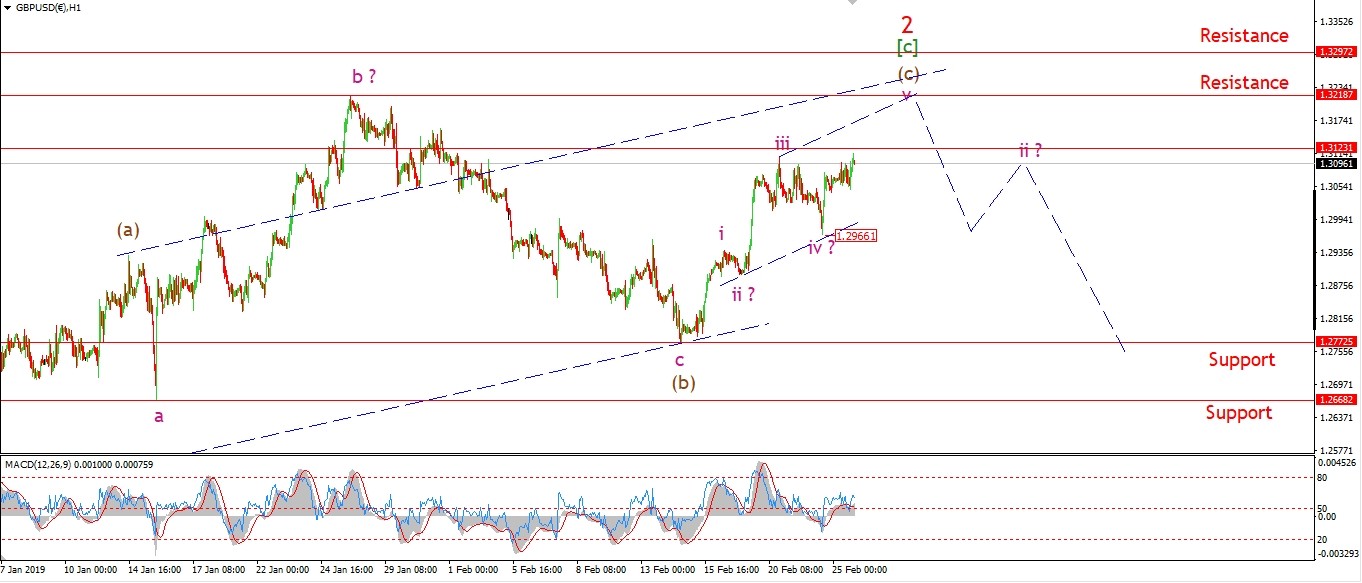 [/vc_column_text][/vc_column][vc_column width=”1/3″][vc_custom_heading text=”4 Hours” use_theme_fonts=”yes”][vc_column_text]
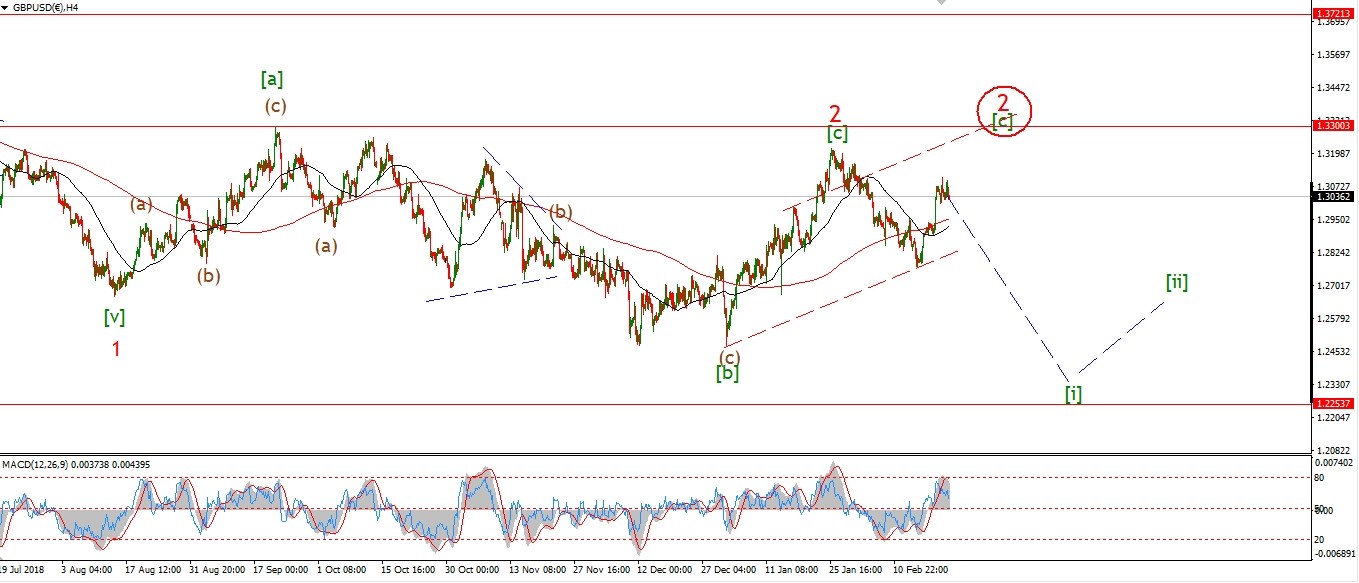 [/vc_column_text][vc_custom_heading text=”Daily” use_theme_fonts=”yes”][vc_column_text]
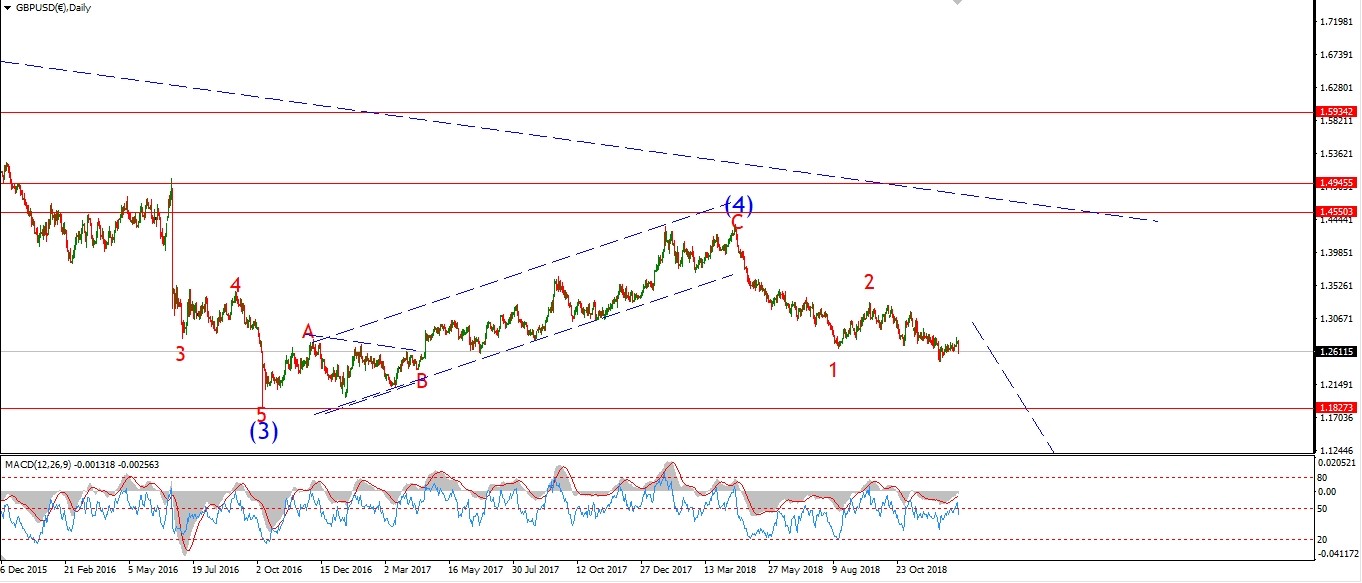 [/vc_column_text][/vc_column][/vc_row]
[vc_row][vc_column][vc_column_text]
I have switched to the alternate count on the short term count this evening.
The rally off the recent low at 1.2772 is developing in a five wave structure.
and the high was again broken this evening.
Wave ‘2’ should now breach the upper trend channel line at 1.3300 to complete.
So we can expect more upside in wave ‘v’ of (c) of [c] for the next couple of sessions.
Tomorrow;
Watch for the low at wave ‘iv’ to hold at 1.2967.
Wave ‘v’ should break initial resistance tomorrow at 1.3218 to confirm the new count.
[/vc_column_text][/vc_column][/vc_row]
[/_s2If]
[_s2If current_user_can(access_s2member_ccap_usdjpy)]
[vc_row][vc_column][vc_separator border_width=”5″][/vc_column][/vc_row][vc_row][vc_column][vc_column_text]
USDJPY
[/vc_column_text][/vc_column][/vc_row][vc_row][vc_column][vc_separator border_width=”5″][/vc_column][/vc_row][vc_row][vc_column width=”2/3″][vc_custom_heading text=”1 hr” use_theme_fonts=”yes”][vc_column_text]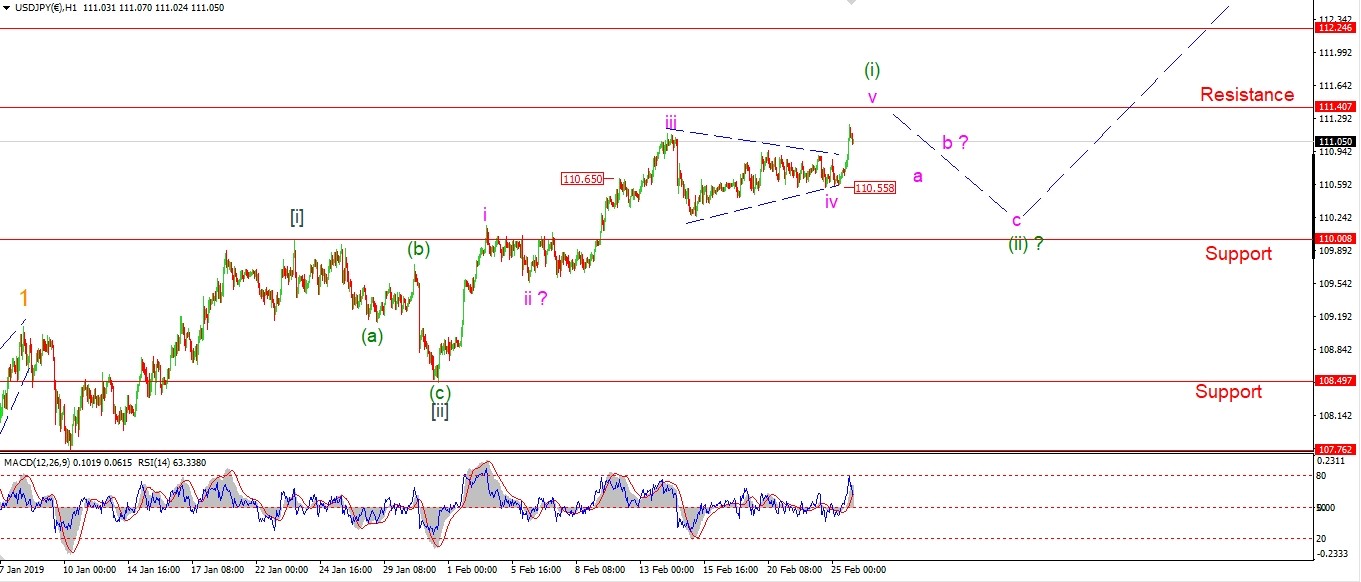 [/vc_column_text][/vc_column][vc_column width=”1/3″][vc_custom_heading text=”4 Hours” use_theme_fonts=”yes”][vc_column_text]
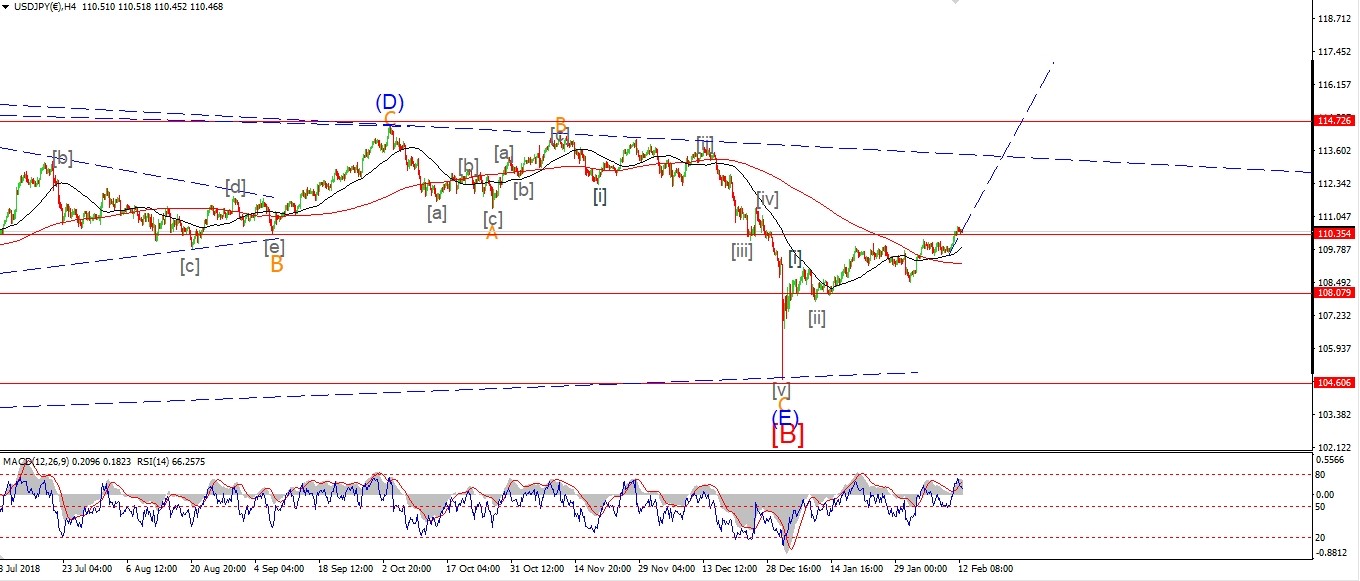 [/vc_column_text][vc_custom_heading text=”Daily” use_theme_fonts=”yes”][vc_column_text]
 [/vc_column_text][/vc_column][/vc_row]
[vc_row][vc_column][vc_column_text]
The rally today broke out of the triangle and invalidated the previous short term count.
I have changed the count to show that triangle as wave ‘iv’ of (i).
And todays rally takes the wave ‘v’ label.
Wave ‘v’ should draw to a close soon enough.
If we see a break of 110.55 tomorrow,
That will signal wave (ii) has begun.
From that point we await a three wave decline again in wave (ii)
and the completion of another impulse wave.
Then we should be set for wave (iii) of [iii] up.
Tomorrow;
110.55 is the level to watch for wave (ii) to begin.
[/vc_column_text][/vc_column][/vc_row]
[/_s2If]
[_s2If current_user_can(access_s2member_ccap_dow_jones)]
[vc_row][vc_column][vc_separator border_width=”5″][/vc_column][/vc_row][vc_row][vc_column][vc_column_text]
DOW JONES INDUSTRIALS
[/vc_column_text][/vc_column][/vc_row][vc_row][vc_column][vc_separator border_width=”5″][/vc_column][/vc_row][vc_row][vc_column width=”2/3″][vc_custom_heading text=”1 hr” use_theme_fonts=”yes”][vc_column_text]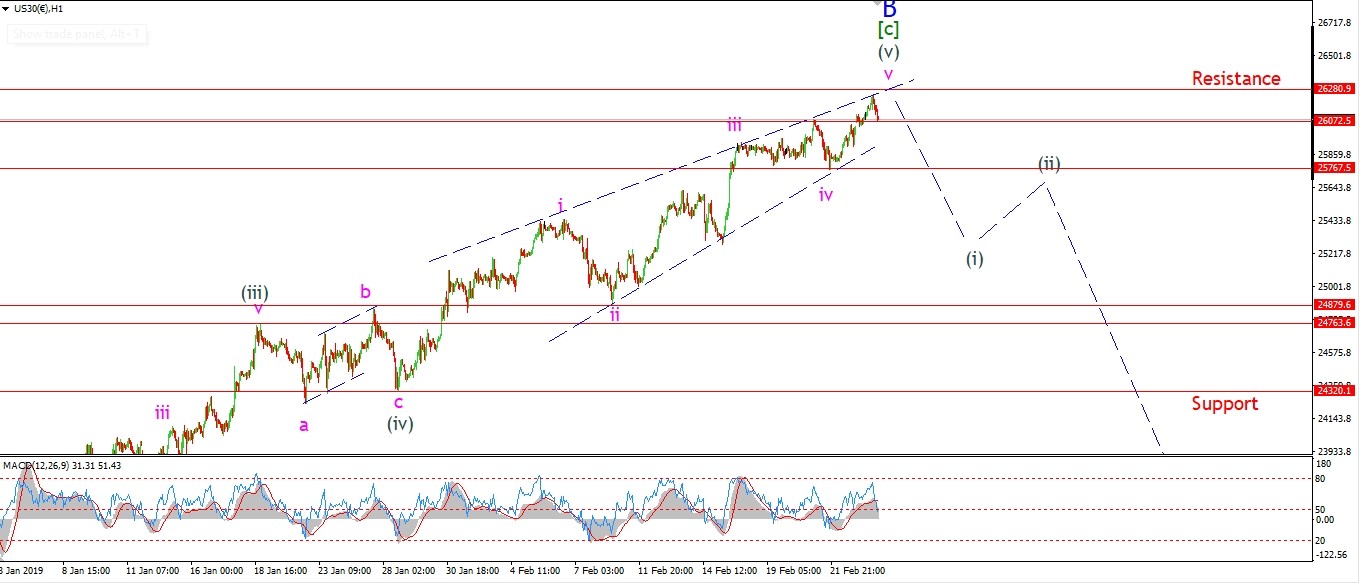 [/vc_column_text][/vc_column][vc_column width=”1/3″][vc_custom_heading text=”4 Hours” use_theme_fonts=”yes”][vc_column_text]
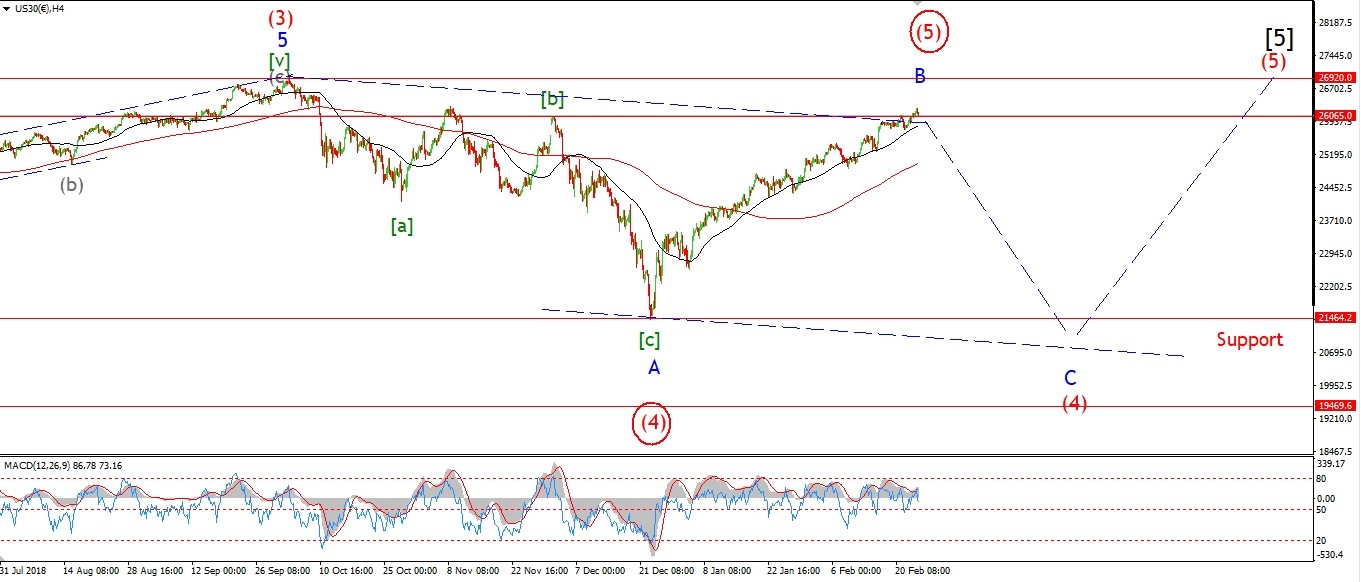 [/vc_column_text][vc_custom_heading text=”Daily” use_theme_fonts=”yes”][vc_column_text]
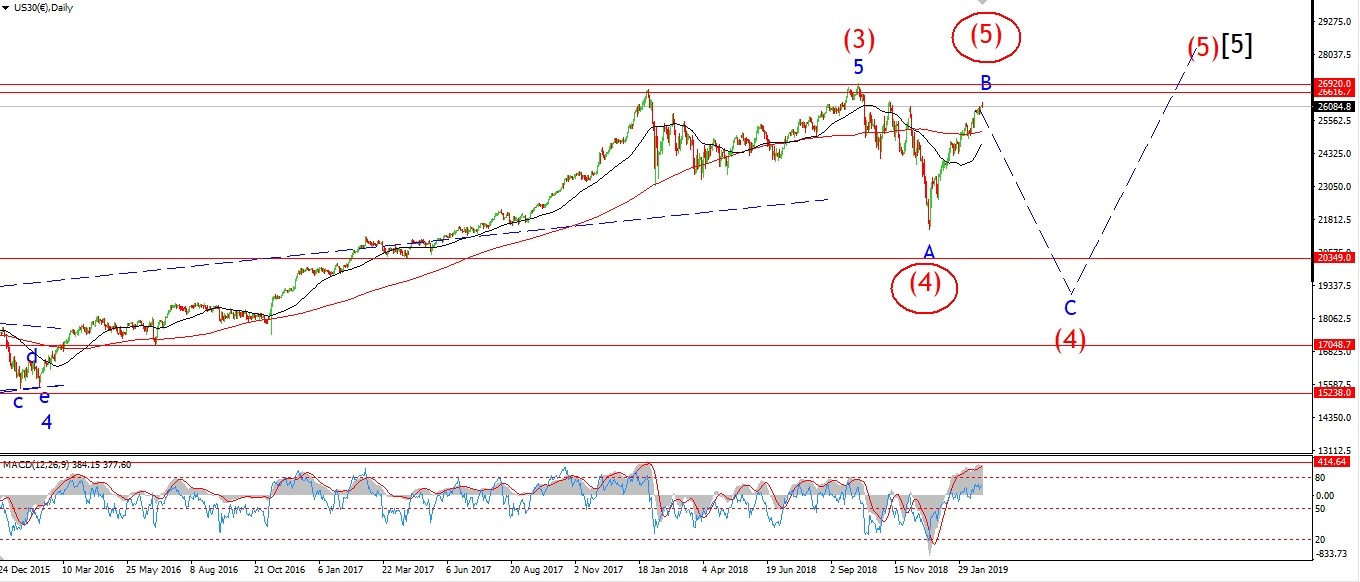 [/vc_column_text][/vc_column][/vc_row]
[vc_row][vc_column][vc_column_text]
Its a day for the alternate count.
Except I think we have a twist developing in the stock market.
On the 4hr chart;
Todays new highs are now labelled as wave ‘B’ of (4).
Wave ‘C’ down is expected to begin without much delay.
Wave ‘C’ should carry below 21400 to complete a large flat wave (4) red.
This count then suggests another rise into wave (5) of [5] as before
to complete the whole five wave cycle from the great depression lows of 1932.
And on that time line,
a few months of shaky market market action is nothing.
Once wave [5] is done,
We are facing into a 20 year bear-market.
which will wipe out 90% of the nominal value of all stocks with ease.
And this is the reason I have been so damn bearish for so damn long!
The risks are monumental!
On the 4hr chart I have shown the next best interpretation.
This alternate count shows the current rally as wave (5) of [5].
And there is a very clear case to be made for that view
especially if we break to new all time highs.
At a minimum, wave ‘C’ of (4) will carry the market back towards 20000 again.
So this is no time to be complacent either.
Tomorrow;
the internal wave structure of the recent rally has not changed.
This is still a three wave rally in wave ‘B’ rather than wave ‘2’.
So from this point we still need to look for five waves down to begin wave ‘C’.
That is the aim again this week.
[/vc_column_text][/vc_column][/vc_row]
[/_s2If]
[_s2If current_user_can(access_s2member_ccap_gold)]
[vc_row][vc_column][vc_separator border_width=”5″][/vc_column][/vc_row][vc_row][vc_column][vc_column_text]
GOLD
[/vc_column_text][/vc_column][/vc_row][vc_row][vc_column][vc_separator border_width=”5″][/vc_column][/vc_row][vc_row][vc_column width=”2/3″][vc_custom_heading text=”1 hr” use_theme_fonts=”yes”][vc_column_text]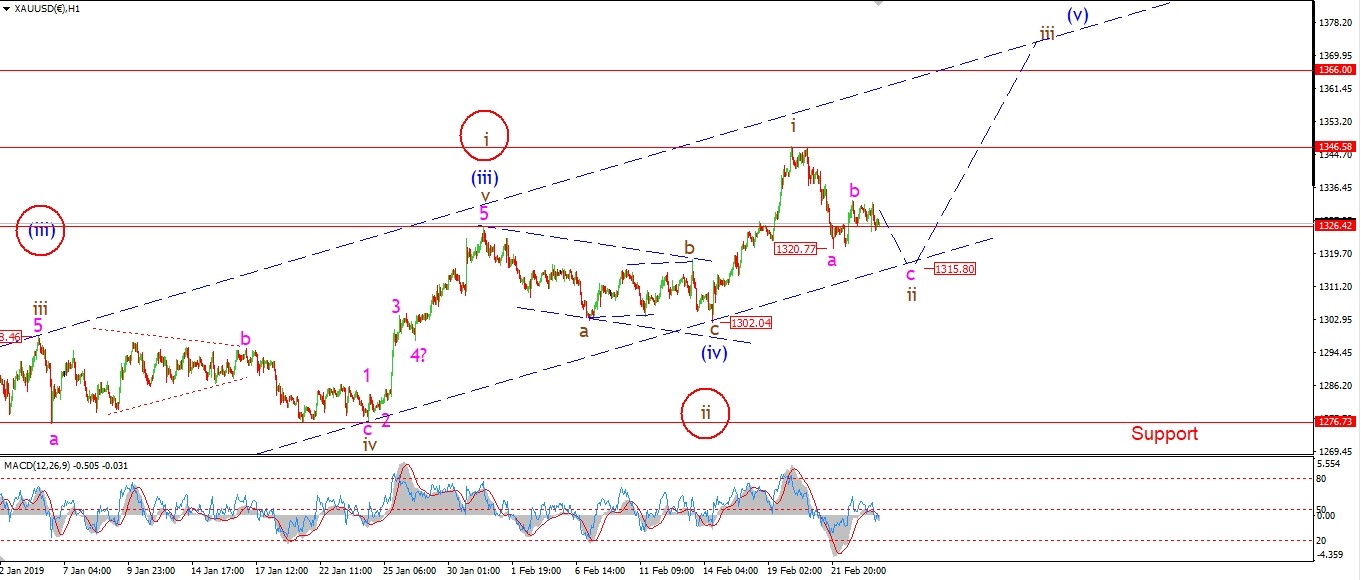 [/vc_column_text][/vc_column][vc_column width=”1/3″][vc_custom_heading text=”4 Hours” use_theme_fonts=”yes”][vc_column_text]
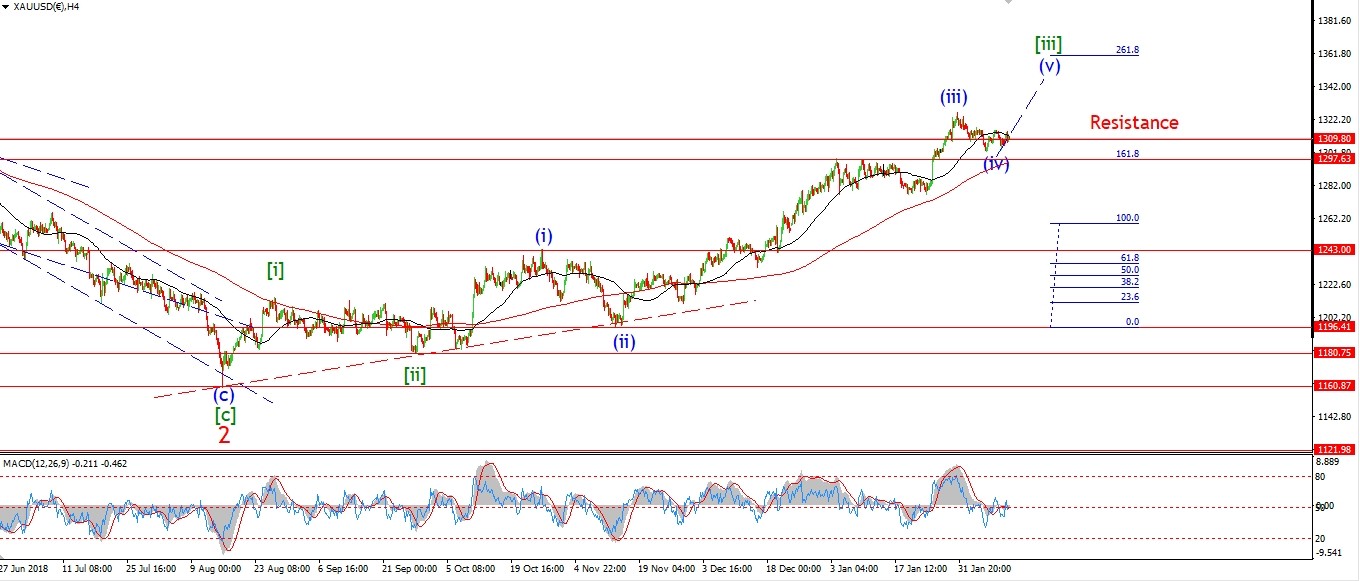 [/vc_column_text][vc_custom_heading text=”Daily” use_theme_fonts=”yes”][vc_column_text]
 [/vc_column_text][/vc_column][/vc_row]
[vc_row][vc_column][vc_column_text]
I have labelled wave ‘b’ as complete at Fridays high.
And now wave ‘c’ should drop into 1315 again to complete a three wave correction in wave ‘ii’ of (v).
Wave ‘iii’ up should carry above 1366 again throughout the next few weeks.
The low at 1302 must hold for this short term interpretation to remain valid.
If that level breaks we will have to reconsider things a bit.
Tomorrow;
Wave ‘c’ should find support at that lower trend channel line.
1315 is the target for now.
A break of 1320 again will confirm this count.
[/vc_column_text][/vc_column][/vc_row]
[/_s2If]
[_s2If current_user_can(access_s2member_ccap_crude)]
[vc_row][vc_column][vc_separator border_width=”5″][/vc_column][/vc_row][vc_row][vc_column][vc_column_text]
U.S CRUDE OIL
[/vc_column_text][/vc_column][/vc_row][vc_row][vc_column][vc_separator border_width=”5″][/vc_column][/vc_row][vc_row][vc_column width=”2/3″][vc_custom_heading text=”1 hr” use_theme_fonts=”yes”][vc_column_text]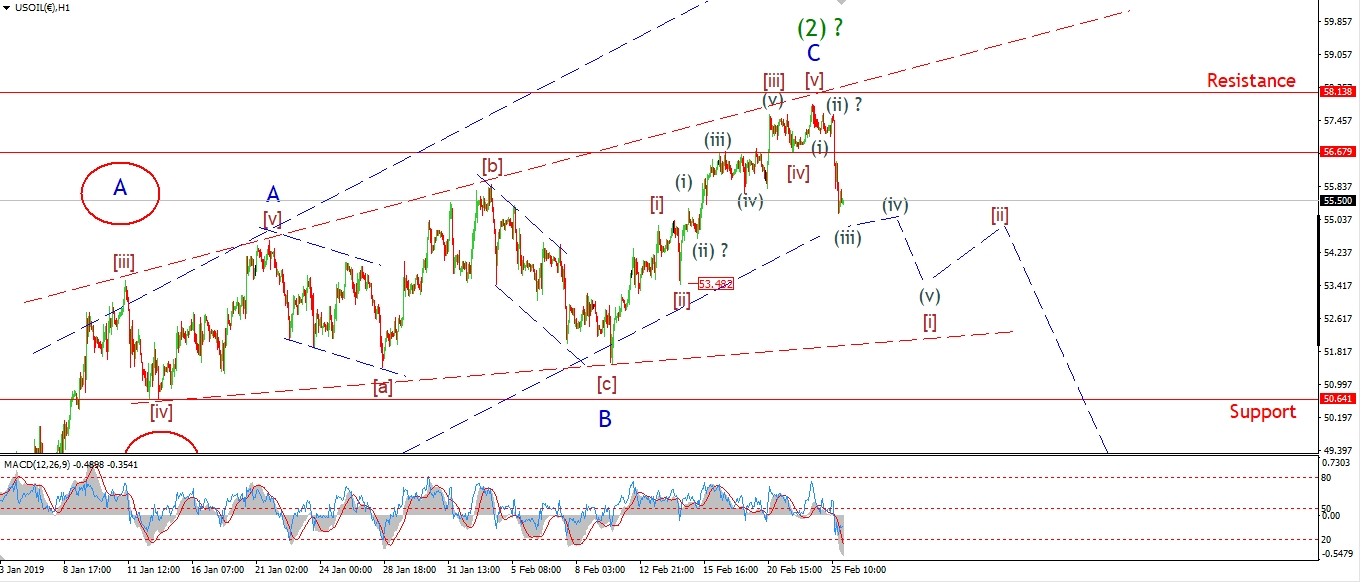 [/vc_column_text][/vc_column][vc_column width=”1/3″][vc_custom_heading text=”4 Hours” use_theme_fonts=”yes”][vc_column_text]
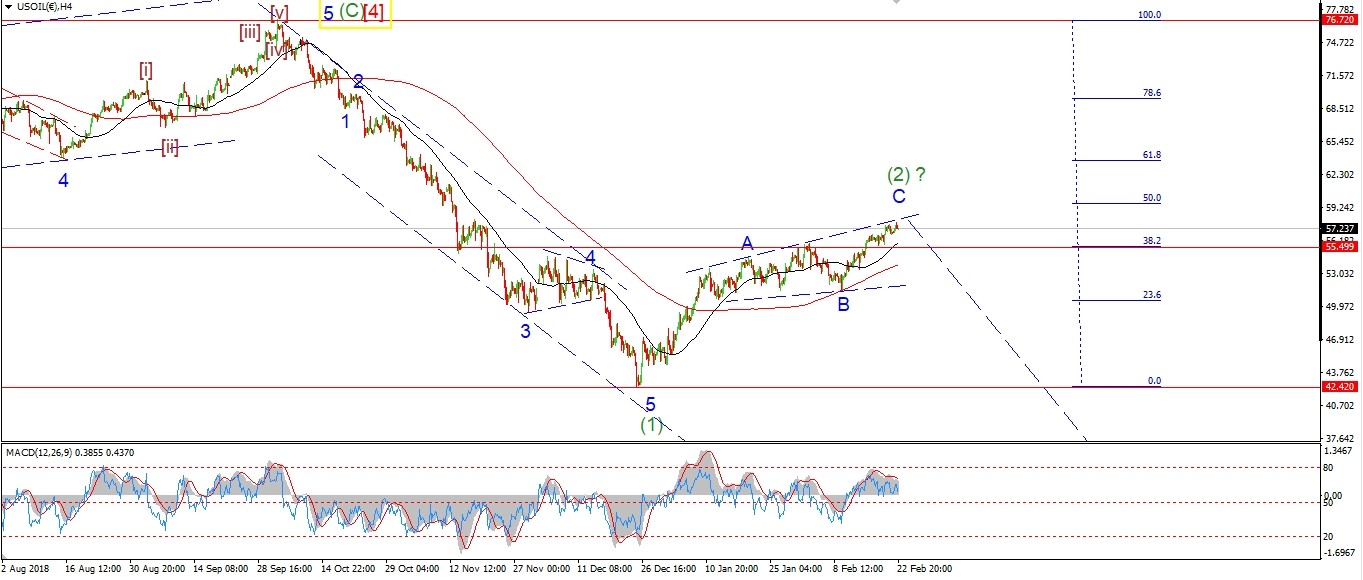 [/vc_column_text][vc_custom_heading text=”Daily” use_theme_fonts=”yes”][vc_column_text]
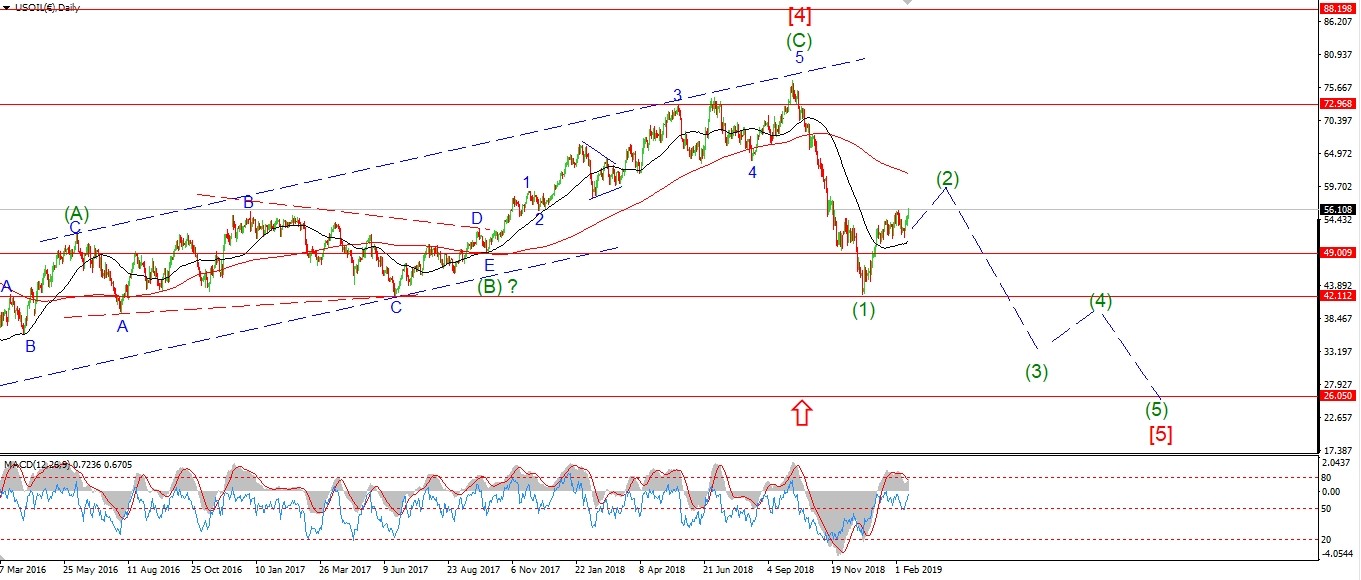 [/vc_column_text][/vc_column][/vc_row]
[vc_row][vc_column][vc_column_text]
Crude took a heavy hit today off a possible top in wave ‘C’ of (2).
This is a good first move towards confirming a turn lower into wave (3).
But we first need a clear five waves down off that high to confirm the turn.
I have labelled the sharp drop today as a possible wave (iii) of [i].
Wave [i] should trace out five waves down,
and ideally break 53.40.
This would go a long way to ruling out any bullish interpretation.
A break of the support level at 50.60 again
will confirm that wave (3) down was underway.
At this point though,
the focus is on completing five waves down.
Tomorrow;
Watch for wave (iii) to complete
and wave (iv) to begin to correct higher to about 56.00 again.
[/vc_column_text][/vc_column][/vc_row]
[/_s2If]
[_s2If current_user_can(access_s2member_ccap_us10yr)]
[vc_row][vc_column][vc_separator border_width=”5″][/vc_column][/vc_row][vc_row][vc_column][vc_column_text]
US 10 yr Treasuries.
[/vc_column_text][/vc_column][/vc_row][vc_row][vc_column][vc_separator border_width=”5″][/vc_column][/vc_row][vc_row][vc_column width=”2/3″][vc_custom_heading text=”1 hr” use_theme_fonts=”yes”][vc_column_text]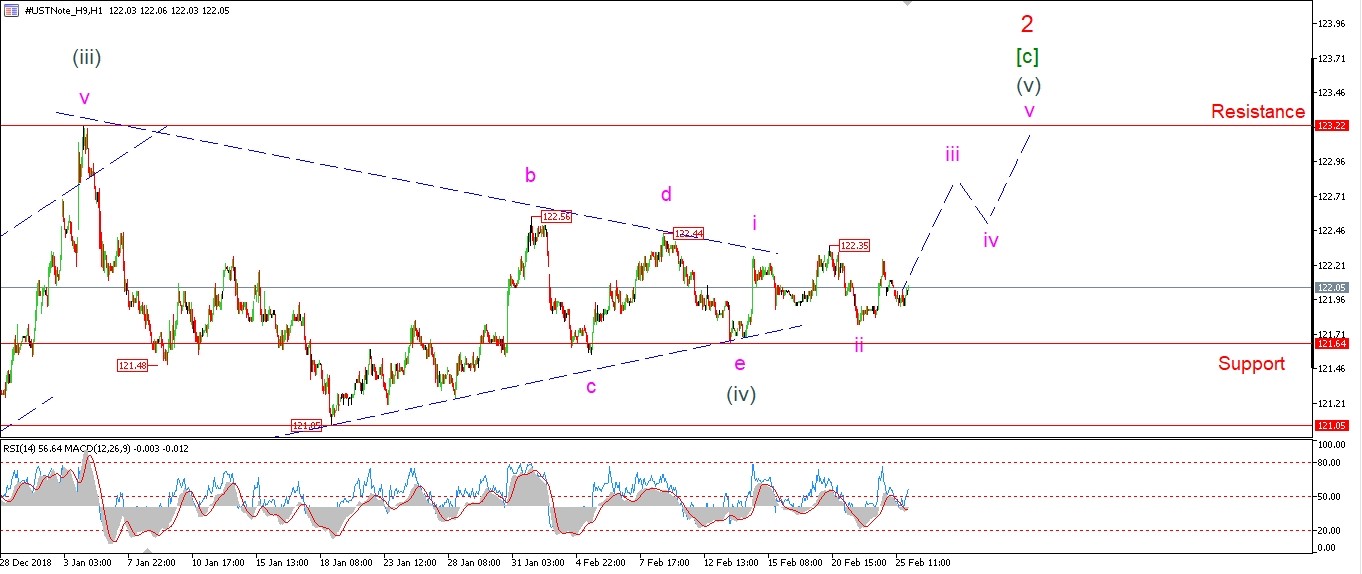 [/vc_column_text][/vc_column][vc_column width=”1/3″][vc_custom_heading text=”4 Hours” use_theme_fonts=”yes”][vc_column_text]
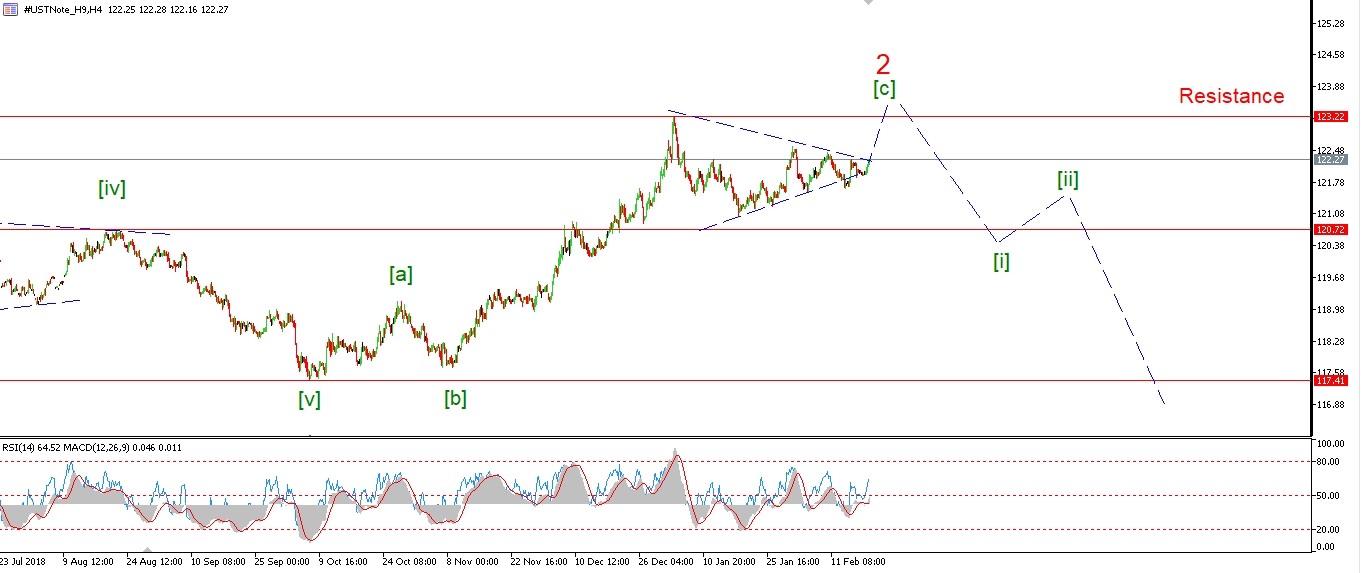 [/vc_column_text][vc_custom_heading text=”Daily” use_theme_fonts=”yes”][vc_column_text]
 [/vc_column_text][/vc_column][/vc_row]
[vc_row][vc_column][vc_column_text]
Treasuries seem to have created a created a small impulse wave higher today
off the wave ‘ii’ low at 121.78.
This should begin wave ‘iii’ of (v) to the upside.
the minimum target for wave (v) lies at 123.22.
where wave (v) breaks the wave (iii) high.
Tomorrow;
Watch for a break of 122.35 to confirm wave ‘iii’ has begun.
[/vc_column_text][/vc_column][/vc_row]
[/_s2If]
[_s2If current_user_can(access_s2member_ccap_silver)]
[vc_row][vc_column][vc_separator border_width=”5″][/vc_column][/vc_row][vc_row][vc_column][vc_column_text]
SILVER
[/vc_column_text][/vc_column][/vc_row][vc_row][vc_column][vc_separator border_width=”5″][/vc_column][/vc_row][vc_row][vc_column width=”2/3″][vc_custom_heading text=”1 hr” use_theme_fonts=”yes”][vc_column_text]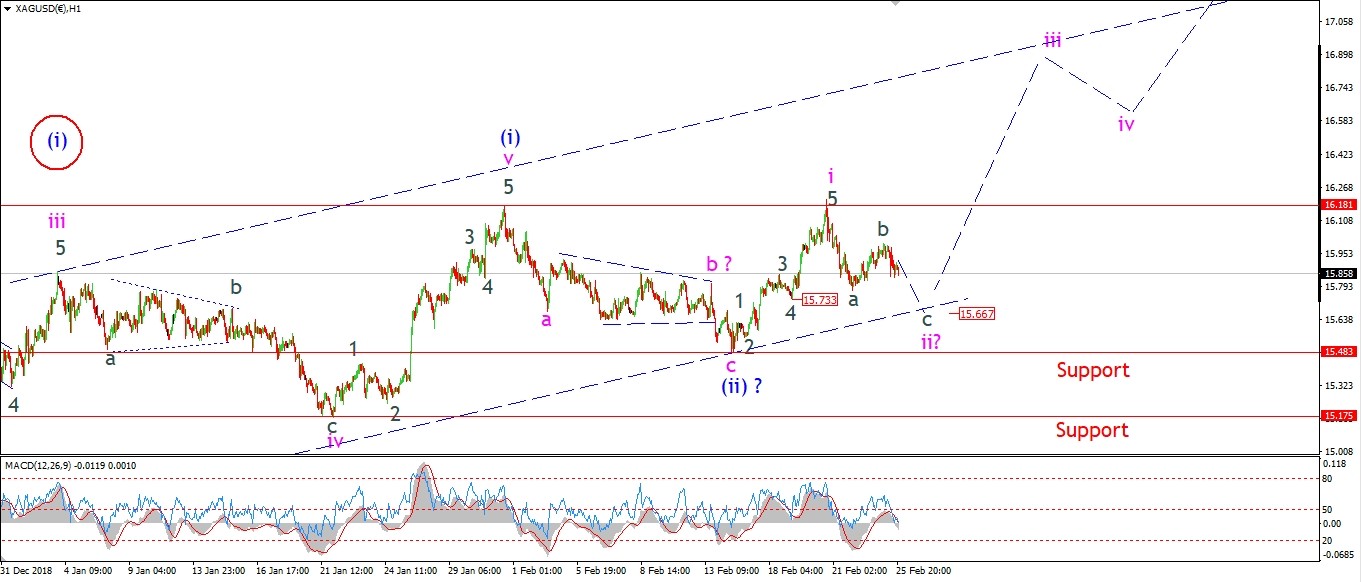 [/vc_column_text][/vc_column][vc_column width=”1/3″][vc_custom_heading text=”4 Hours” use_theme_fonts=”yes”][vc_column_text]
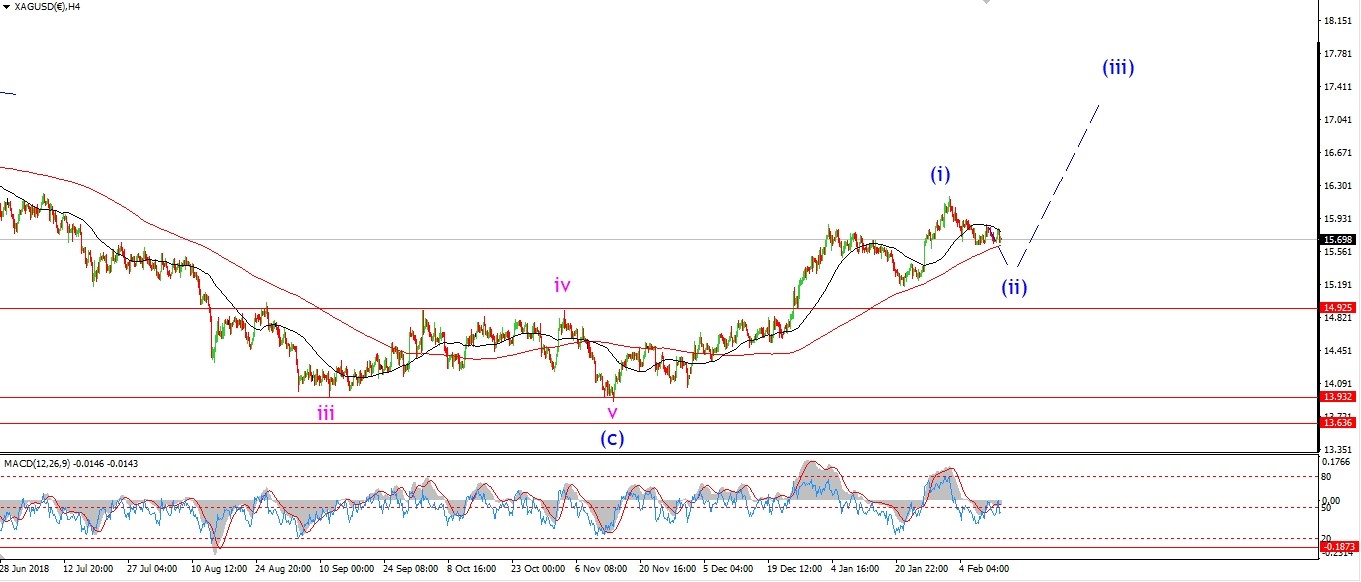 [/vc_column_text][vc_custom_heading text=”Daily” use_theme_fonts=”yes”][vc_column_text]
 [/vc_column_text][/vc_column][/vc_row]
[vc_row][vc_column][vc_column_text]
Silver is dropping in wave ‘c’ of ‘ii’ this evening.
Wave ‘c’ should meet the rising trend channel line at 15.66 or so to finish a three wave correction.
Wave ‘ii’ must hold above 15.43.
If that level breaks,
then wave (ii) blue will still be in force.
Even then,
support at 15.17 should stop any decline.
Tomorrow;
Watch for wave ‘c’ to find support at 15.66.
then turn higher in wave ‘iii’ of (iii).
[/vc_column_text][/vc_column][/vc_row]
[/_s2If]
[_s2If current_user_can(access_s2member_ccap_sp500)]
[vc_row][vc_column][vc_separator border_width=”5″][/vc_column][/vc_row][vc_row][vc_column][vc_column_text]
S&P 500.
[/vc_column_text][/vc_column][/vc_row][vc_row][vc_column][vc_separator border_width=”5″][/vc_column][/vc_row][vc_row][vc_column width=”2/3″][vc_custom_heading text=”1 hr” use_theme_fonts=”yes”][vc_column_text]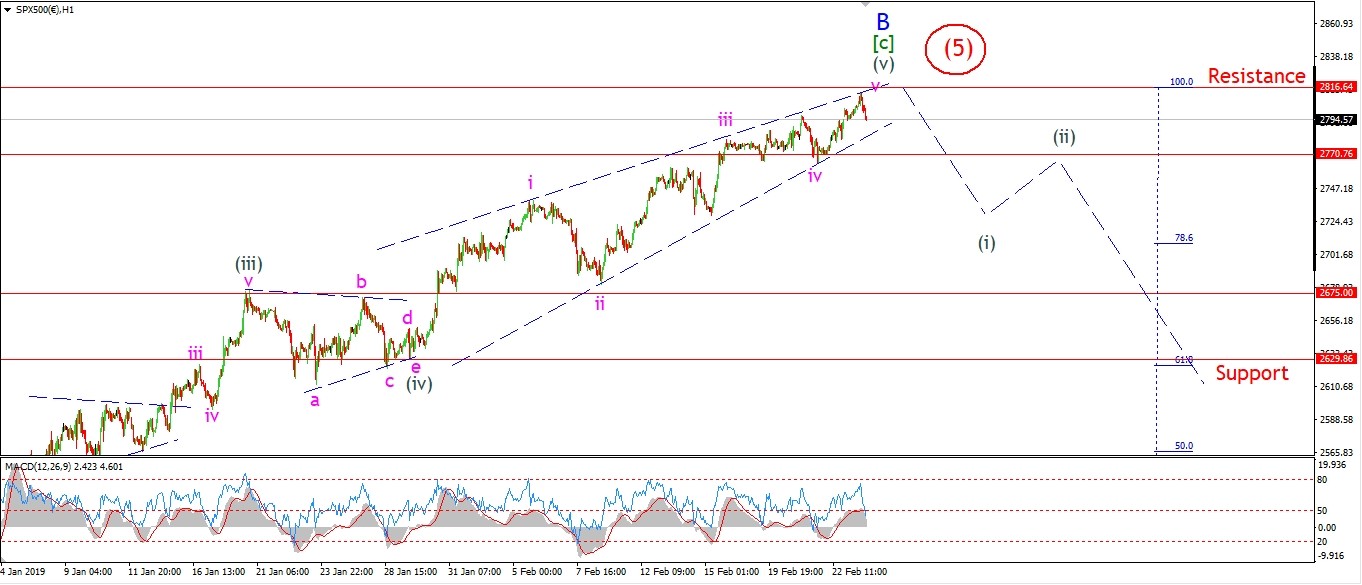 [/vc_column_text][/vc_column][vc_column width=”1/3″][vc_custom_heading text=”4 Hours” use_theme_fonts=”yes”][vc_column_text]
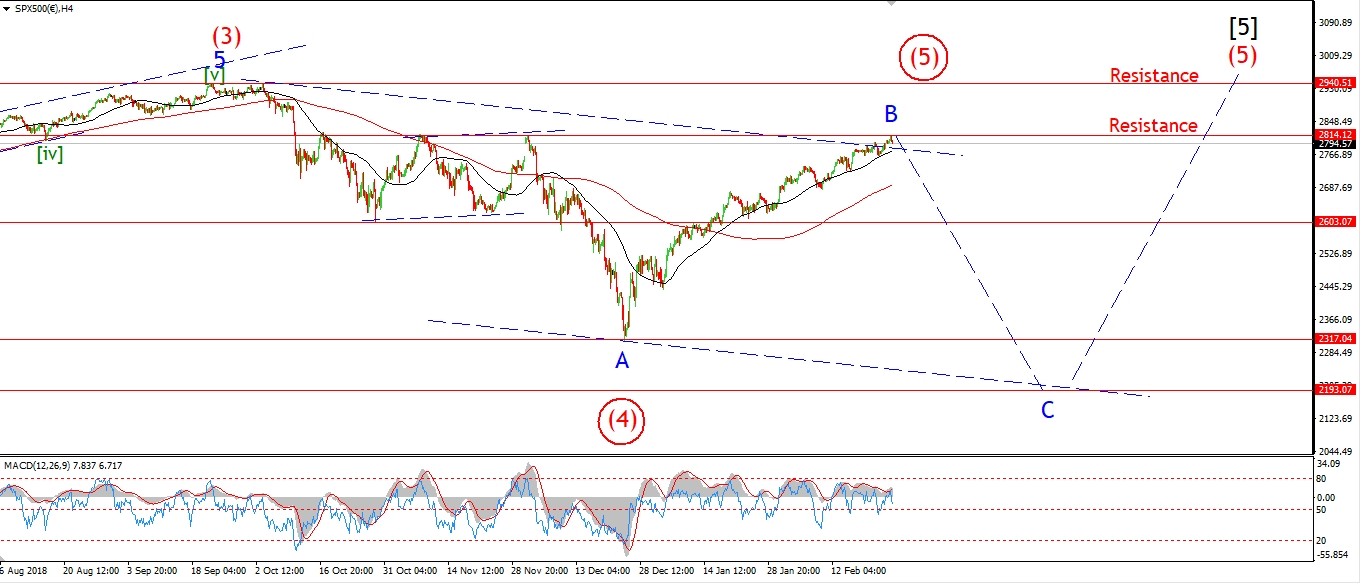 [/vc_column_text][vc_custom_heading text=”Daily” use_theme_fonts=”yes”][vc_column_text]
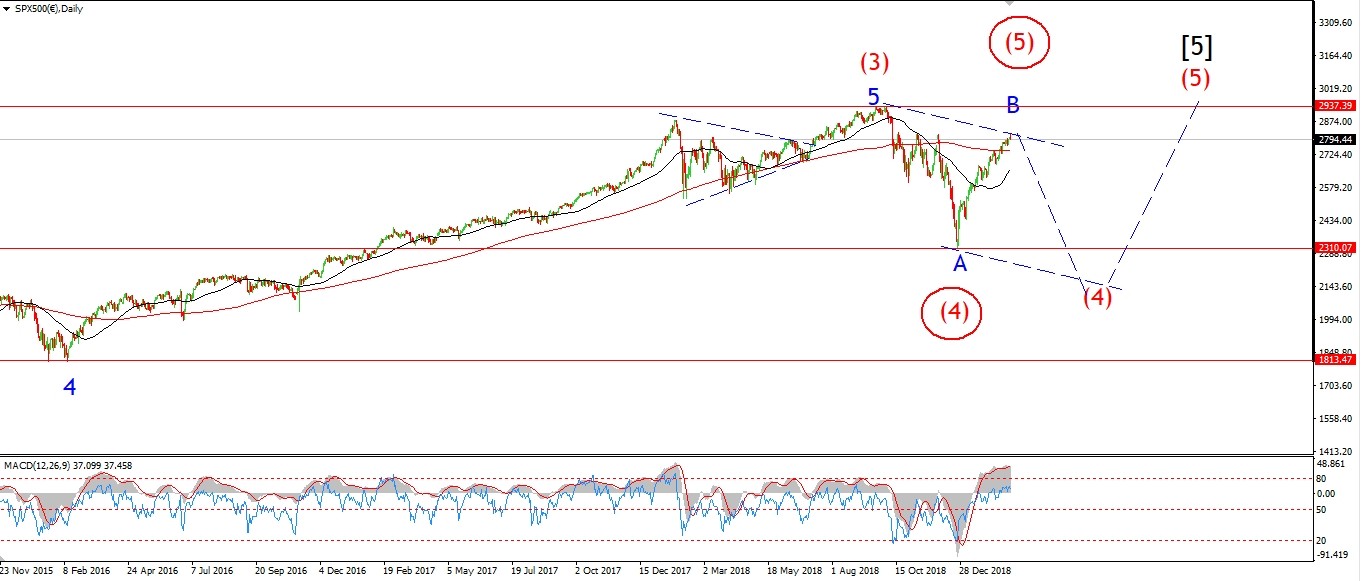 [/vc_column_text][/vc_column][/vc_row]
[vc_row][vc_column][vc_column_text]
The S&P gets a new count also this evening.
And the exact same alternate count as the DOW also holds for the S&P.
And this is shown on all time frames.
This rally is now labelled wave ‘B’ of (4).
Wave ‘C’ of (4) should drop back into the 2100 handle again in five waves to complete a 3,3,5 correction.
The ending diagonal idea for wave (v) is less likely now.
Wave (v) is tracing out a more traditional five wave rally.
It seems that wave ‘iii’ of (v) extended and
wave ‘iv’ traced out an expanded flat.
This explains the five wave drop last week which completed a flat correction.
The new alternate count takes up the major bearish outlook.
If this recent rally off the December lows breaks to a new all time high,
This I will switch to that alternate count which calls wave (5) of [5] complete.
Following that wave [5] high,
we can expect a bear-market like we have never seen before.
A depression will ensue,
and an economic collapse that will wreak more havoc than the debacle of the 1930’s.
Tomorrow;
The price is still contracting in range as we rise to complete wave (v).
This is causing momentum to continue its bearish divergence.
Wave ‘B’ will complete soon.
And at a minimum we can expect a drop into 2100 in wave ‘C’ of (4).
The alternate count will allow for a new all time high to occur.
But this will be short lived.
[/vc_column_text][/vc_column][/vc_row]
[/_s2If]
[vc_row][vc_column][vc_column_text]
[/vc_column_text][/vc_column][/vc_row]
[vc_row][vc_column][vc_separator border_width=”5″][/vc_column][/vc_row]