
[vc_row][vc_column][vc_separator border_width=”5″][/vc_column][/vc_row]
[vc_row][vc_column][vc_column_text]
Hi everyone.
Here we are again,
another week slides by into the abyss of bullish surrender.
There will not be many more weeks like this one.
So enjoy it!
The video is up so check it out.
Now down to it.
[/vc_column_text][/vc_column][/vc_row]
[_s2If current_user_can(access_s2member_ccap_eurusd)]
[vc_row][vc_column][vc_separator border_width=”5″][/vc_column][/vc_row]
[vc_row][vc_column][vc_column_text]
EURUSD
[/vc_column_text][/vc_column][/vc_row]
[vc_row][vc_column][vc_separator border_width=”5″][/vc_column][/vc_row][vc_row][vc_column width=”2/3″][vc_custom_heading text=”1 hr” use_theme_fonts=”yes”][vc_column_text]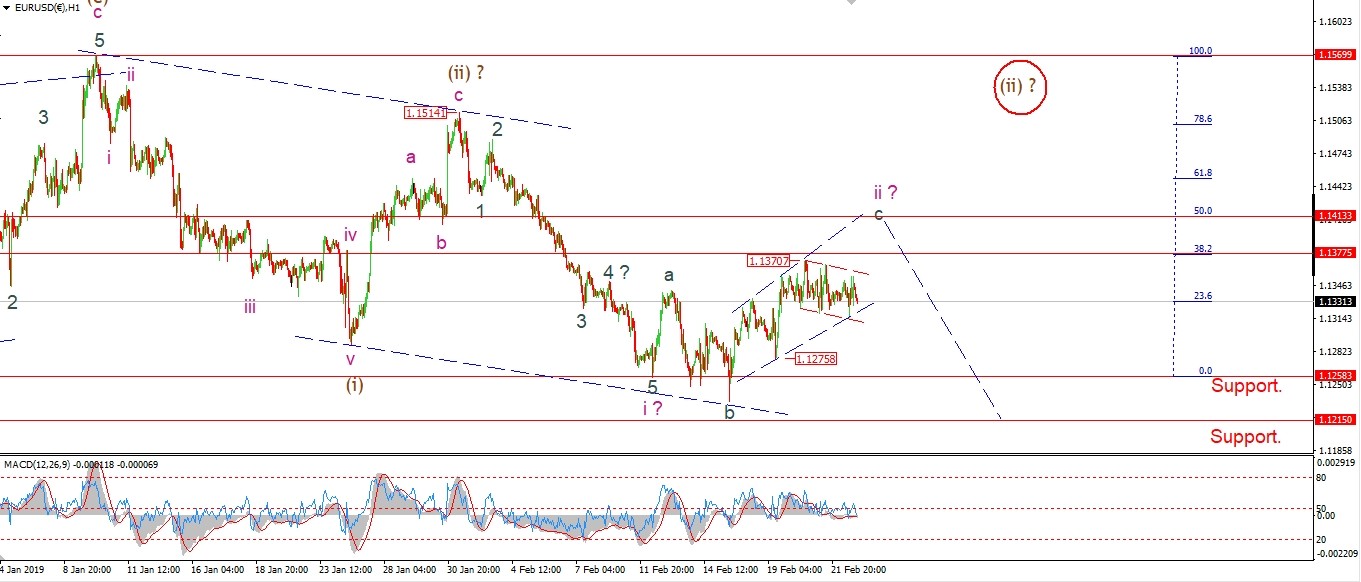 [/vc_column_text][/vc_column][vc_column width=”1/3″][vc_custom_heading text=”4 Hours” use_theme_fonts=”yes”][vc_column_text]
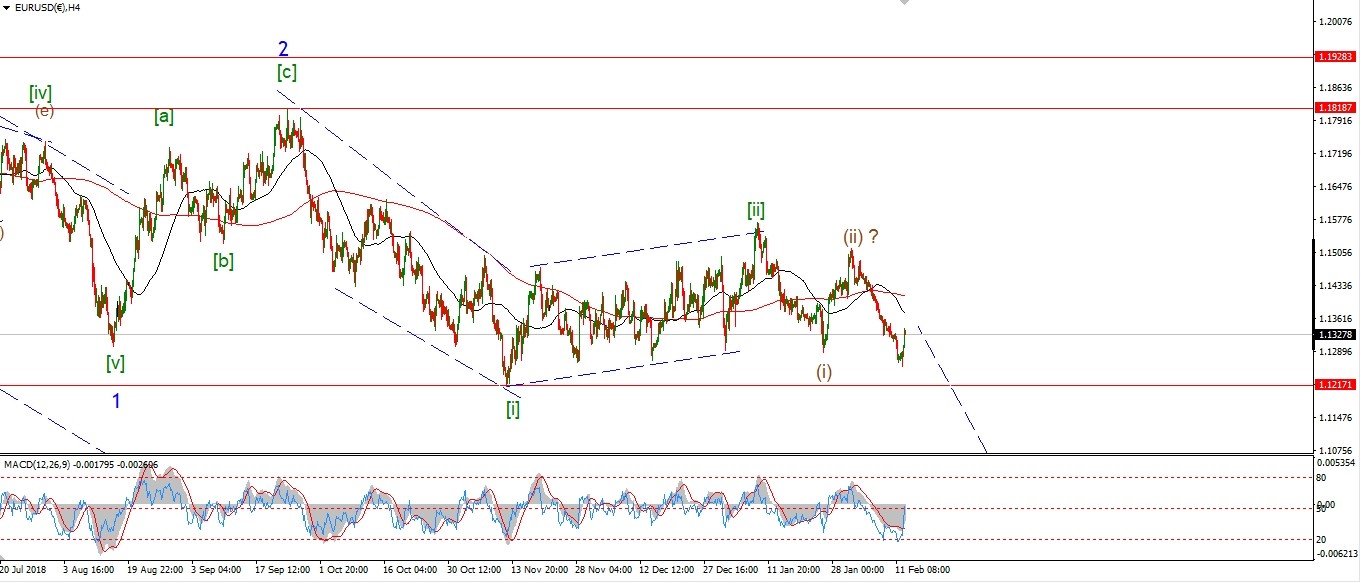 [/vc_column_text][vc_custom_heading text=”Daily” use_theme_fonts=”yes”][vc_column_text]
 [/vc_column_text][/vc_column][/vc_row]
[vc_row][vc_column][vc_column_text]
EURUSD has fallen within a trend channel off the 1.1370 high.
The price hit the lower line of that trend channel and has bounced slightly.
The action looks corrective off that high
so I think we can expect a rise into the 62% retracement level to finish wave ‘c’ in a possible wedge pattern.
The alternate count is still possible,
either in a larger wave (ii) or [ii].
Only a break of 1.1514 will invalidate the current count.
Monday;
watch for a break of 1.1370 to complete an expanding wedge wave ‘c’.
[/vc_column_text][/vc_column][/vc_row]
[/_s2If]
[_s2If current_user_can(access_s2member_ccap_gbpusd)]
[vc_row][vc_column][vc_separator border_width=”5″][/vc_column][/vc_row][vc_row][vc_column][vc_column_text]
GBPUSD
[/vc_column_text][/vc_column][/vc_row][vc_row][vc_column][vc_separator border_width=”5″][/vc_column][/vc_row][vc_row][vc_column width=”2/3″][vc_custom_heading text=”1 hr” use_theme_fonts=”yes”][vc_column_text]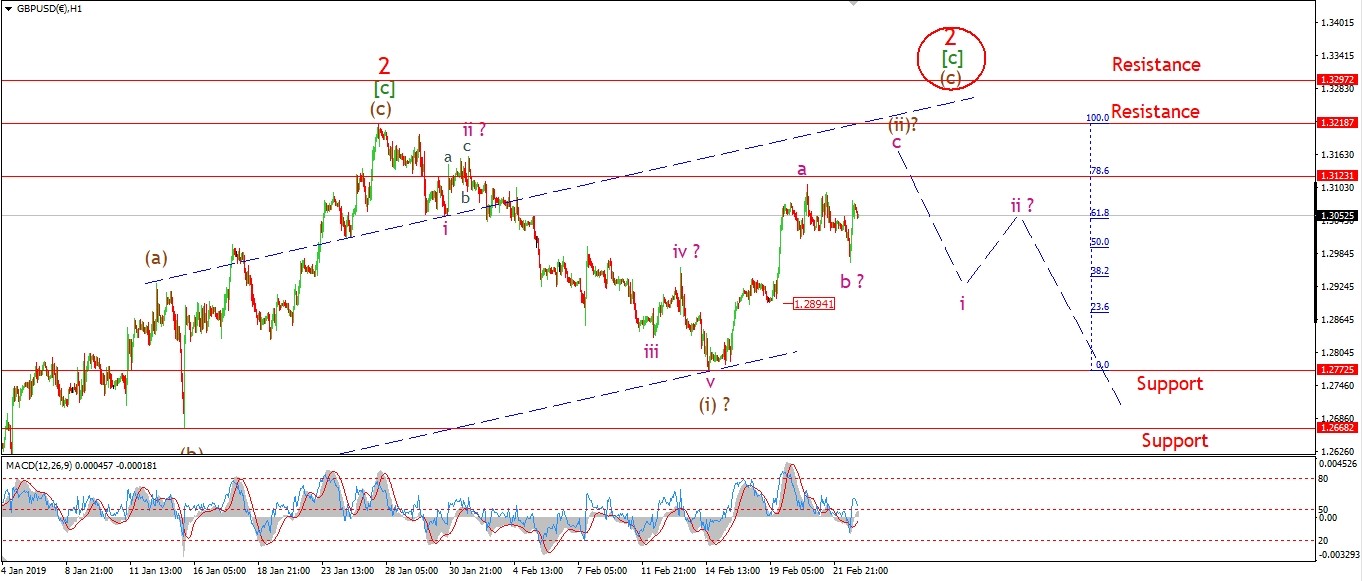 [/vc_column_text][/vc_column][vc_column width=”1/3″][vc_custom_heading text=”4 Hours” use_theme_fonts=”yes”][vc_column_text]
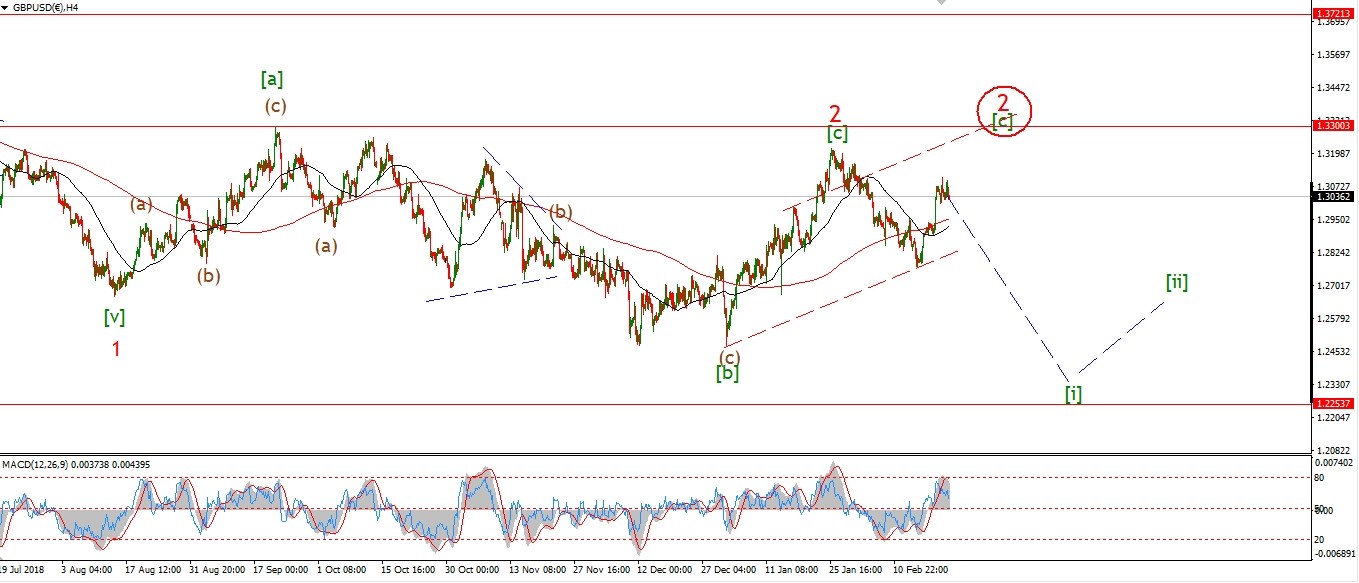 [/vc_column_text][vc_custom_heading text=”Daily” use_theme_fonts=”yes”][vc_column_text]
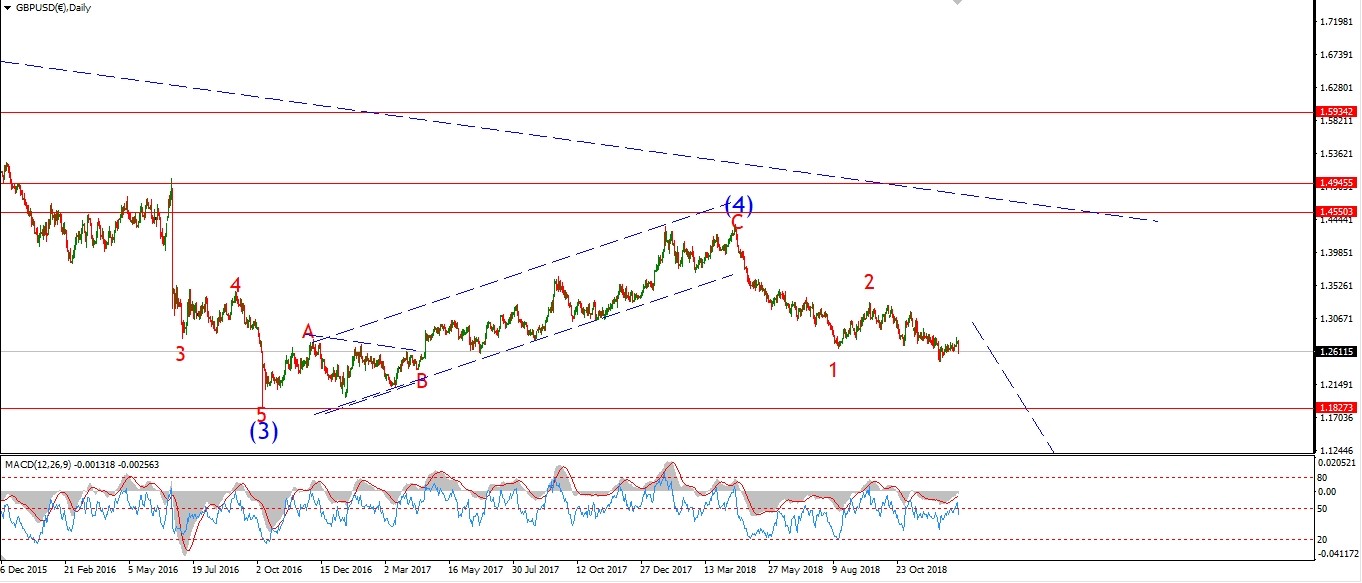 [/vc_column_text][/vc_column][/vc_row]
[vc_row][vc_column][vc_column_text]
Wave (ii) is holding on for dear life this week.
I have changed the wave count this evening to show the drop off the recent high as wave ‘b’.
with wave ‘c’ now underway.
Wave ‘c’ must complete under 1.3218,
Otherwise the alternate count takes over.
Even in the alternate count there is not much upside expected.
Wave [c] of ‘2’ alternate, should complete at about 1.3300 as shown on the 4hr chart.
Monday;
Wave ‘c’ must complete under 1.3218.
[/vc_column_text][/vc_column][/vc_row]
[/_s2If]
[_s2If current_user_can(access_s2member_ccap_usdjpy)]
[vc_row][vc_column][vc_separator border_width=”5″][/vc_column][/vc_row][vc_row][vc_column][vc_column_text]
USDJPY
[/vc_column_text][/vc_column][/vc_row][vc_row][vc_column][vc_separator border_width=”5″][/vc_column][/vc_row][vc_row][vc_column width=”2/3″][vc_custom_heading text=”1 hr” use_theme_fonts=”yes”][vc_column_text] [/vc_column_text][/vc_column][vc_column width=”1/3″][vc_custom_heading text=”4 Hours” use_theme_fonts=”yes”][vc_column_text]
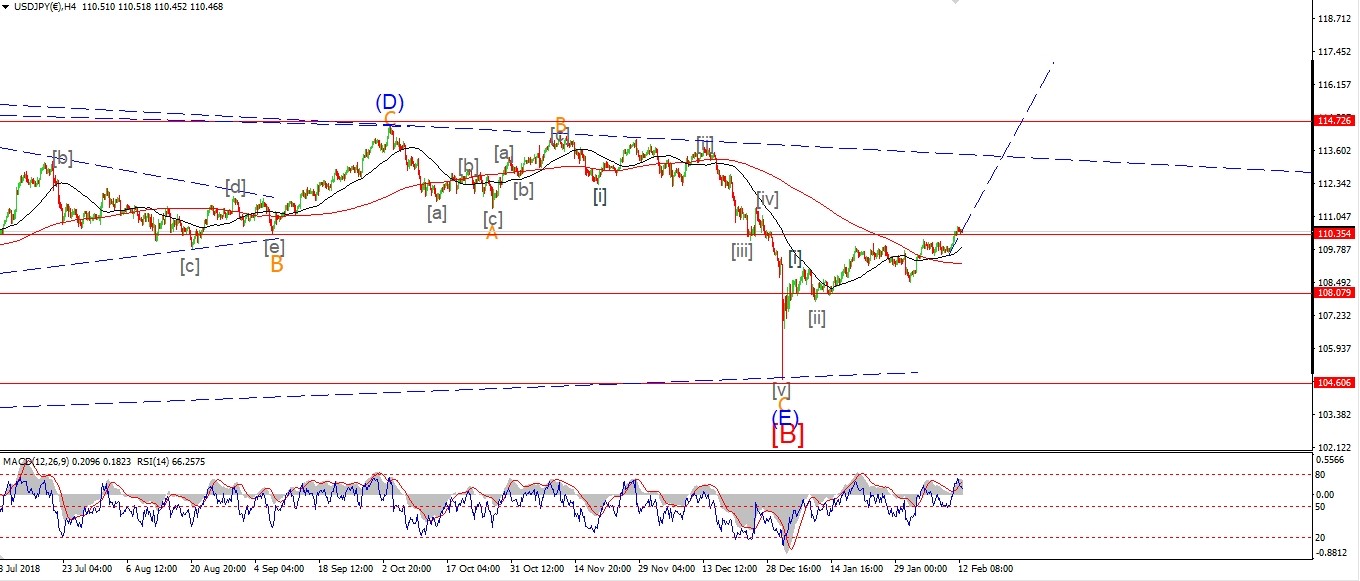 [/vc_column_text][vc_custom_heading text=”Daily” use_theme_fonts=”yes”][vc_column_text]
 [/vc_column_text][/vc_column][/vc_row]
[vc_row][vc_column][vc_column_text]
The triangle wave ‘b’ is still in play this evening,
with further contraction expected to complete the triangle.
Then wave ‘c’ should drop into the 50% retracement level again at 109.85.
Once wave (ii) does close out,
we can expect a quite powerful move higher in wave (iii) of [iii].
Monday;
The minimum target for wave ‘c’ lies at 110.24,
the low of wave ‘a’.
[/vc_column_text][/vc_column][/vc_row]
[/_s2If]
[_s2If current_user_can(access_s2member_ccap_dow_jones)]
[vc_row][vc_column][vc_separator border_width=”5″][/vc_column][/vc_row][vc_row][vc_column][vc_column_text]
DOW JONES INDUSTRIALS
[/vc_column_text][/vc_column][/vc_row][vc_row][vc_column][vc_separator border_width=”5″][/vc_column][/vc_row][vc_row][vc_column width=”2/3″][vc_custom_heading text=”1 hr” use_theme_fonts=”yes”][vc_column_text]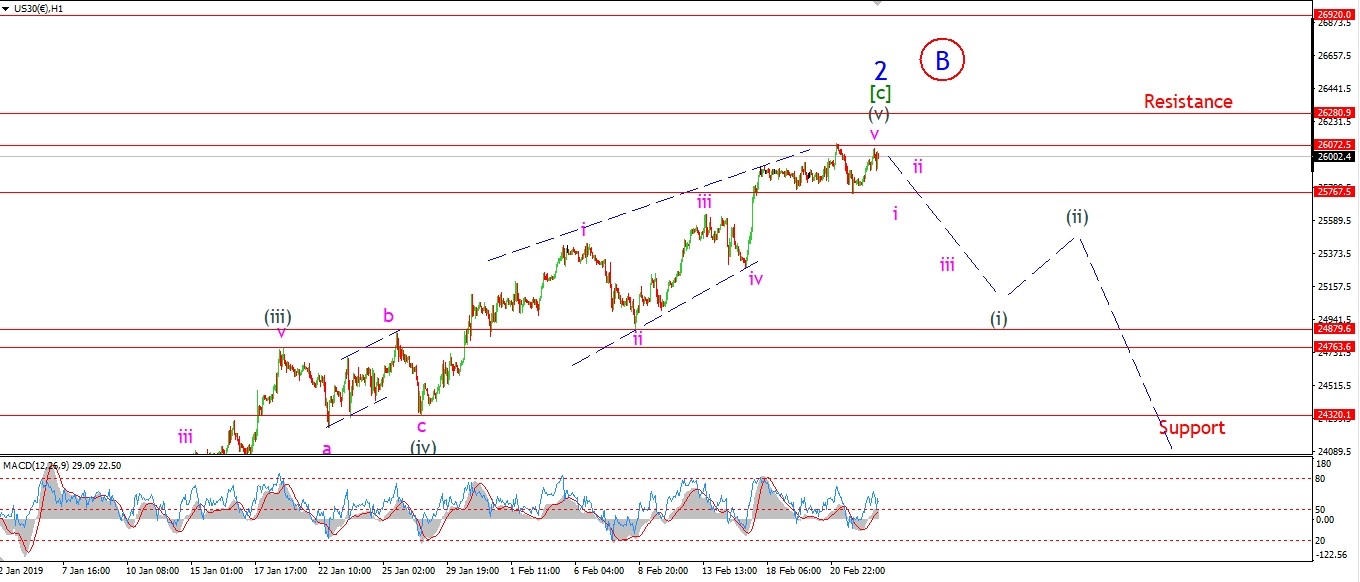 [/vc_column_text][/vc_column][vc_column width=”1/3″][vc_custom_heading text=”4 Hours” use_theme_fonts=”yes”][vc_column_text]
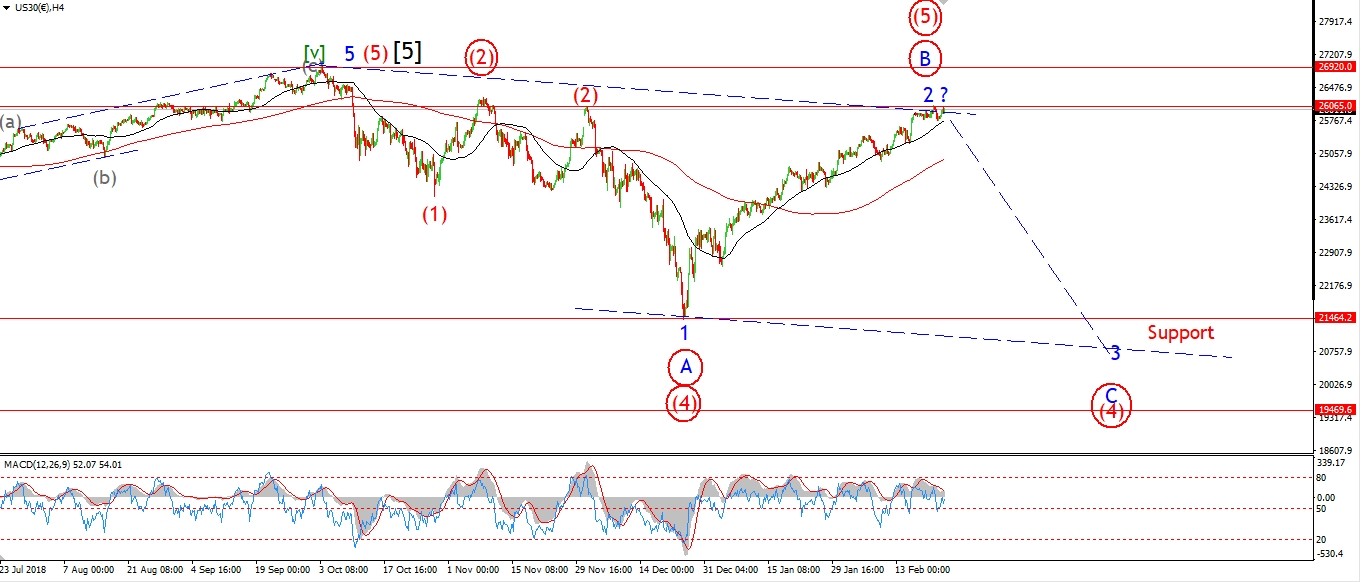 [/vc_column_text][vc_custom_heading text=”Daily” use_theme_fonts=”yes”][vc_column_text]
 [/vc_column_text][/vc_column][/vc_row]
[vc_row][vc_column][vc_column_text]
Another day another new high,
another chance to put in the final high and get underway for the crash that is now inevitable.
On the 4hr chart I have shown a second alternate count.
The December low could be wave (4) red after a three wave fall.
And the current rally may be a fifth wave.
If this wave makes a new high above the current all time high,
then it will be confirmed as wave (5).
Also;
This wave could end as a failure!
A failed fifth wave at the end of an exhaustive rally
where bullishness has reached an extreme rarely ever seen before.
I think that would be a fitting end to the mother of all rallies!
Monday;
Back to the wave ‘B’ or ‘2’ scenario.
The market has been flat this week and momentum is diverging again on the 4hr chart.
If next week brings the turn,
then it is not a moment too soon.
[/vc_column_text][/vc_column][/vc_row]
[/_s2If]
[_s2If current_user_can(access_s2member_ccap_gold)]
[vc_row][vc_column][vc_separator border_width=”5″][/vc_column][/vc_row][vc_row][vc_column][vc_column_text]
GOLD
[/vc_column_text][/vc_column][/vc_row][vc_row][vc_column][vc_separator border_width=”5″][/vc_column][/vc_row][vc_row][vc_column width=”2/3″][vc_custom_heading text=”1 hr” use_theme_fonts=”yes”][vc_column_text]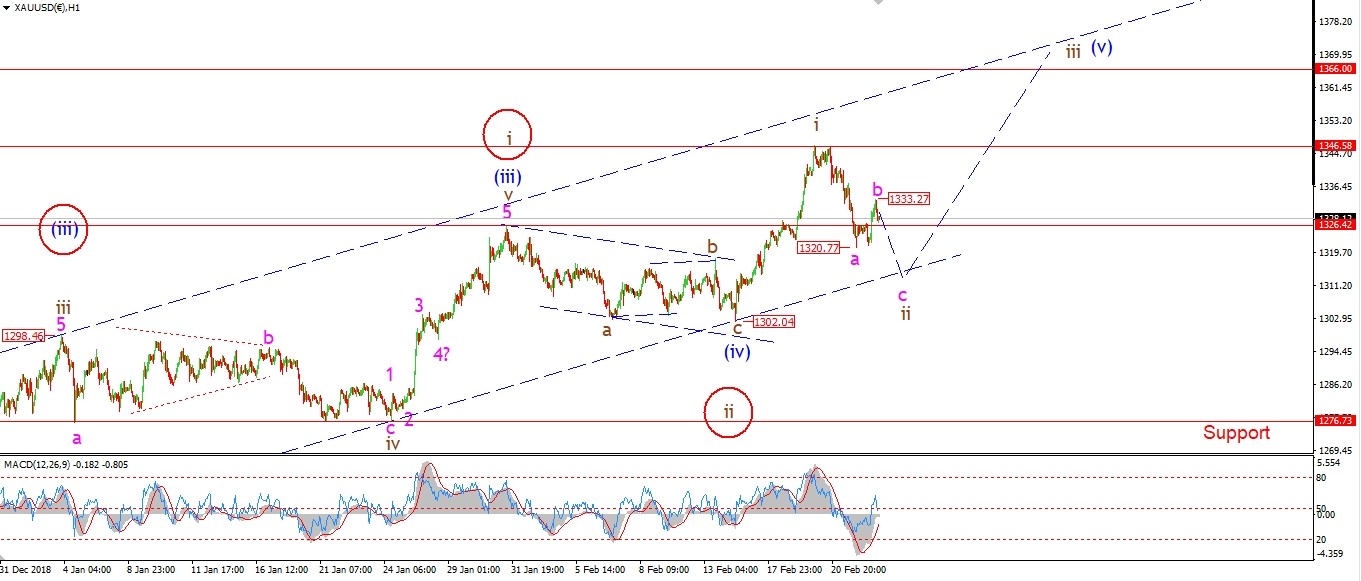 [/vc_column_text][/vc_column][vc_column width=”1/3″][vc_custom_heading text=”4 Hours” use_theme_fonts=”yes”][vc_column_text]
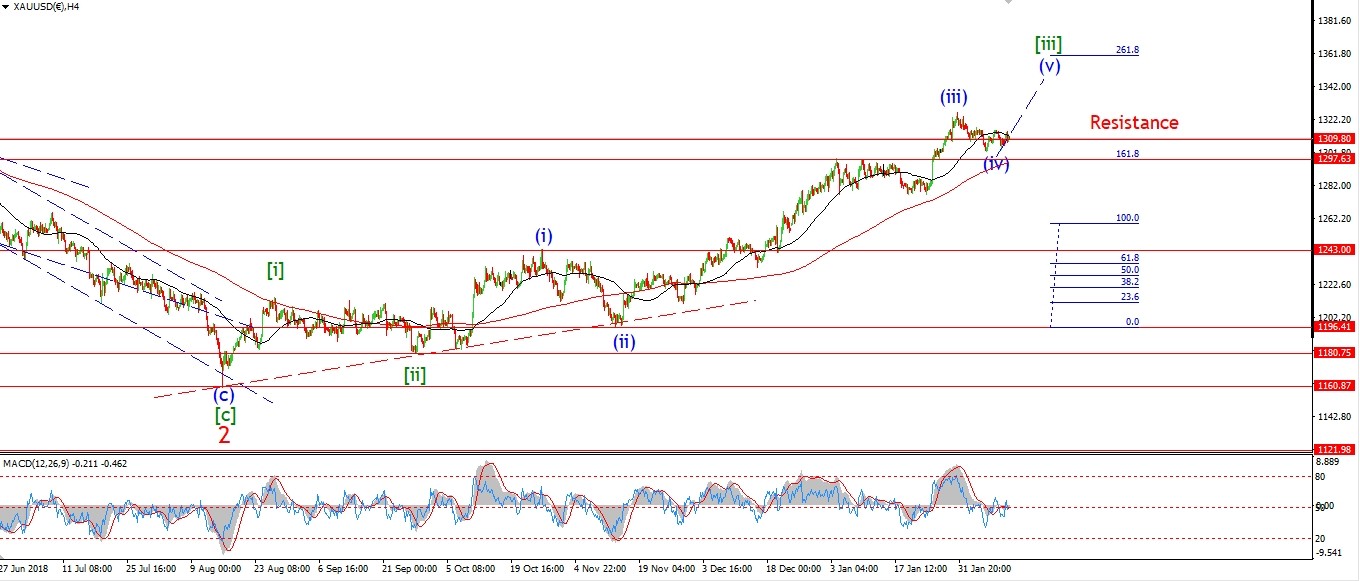 [/vc_column_text][vc_custom_heading text=”Daily” use_theme_fonts=”yes”][vc_column_text]
 [/vc_column_text][/vc_column][/vc_row]
[vc_row][vc_column][vc_column_text]
Gold has bounced off the wave ‘ii’ low today,
the rise is in three waves so far,
so wave ‘ii’ may well extend to create a larger three wave structure next week.
the low at 1302 must hold for this bullish short term count to remain valid.
So another drop in wave ‘c’ of ‘ii’ must hold above that level.
Preferably the price should hold above the rising trendline.
Monday;
Watch for a break of 1320 to confirm wave ‘c’.
A break of 1333 again will signal that wave ‘iii’ up has begun.
[/vc_column_text][/vc_column][/vc_row]
[/_s2If]
[_s2If current_user_can(access_s2member_ccap_crude)]
[vc_row][vc_column][vc_separator border_width=”5″][/vc_column][/vc_row][vc_row][vc_column][vc_column_text]
U.S CRUDE OIL
[/vc_column_text][/vc_column][/vc_row][vc_row][vc_column][vc_separator border_width=”5″][/vc_column][/vc_row][vc_row][vc_column width=”2/3″][vc_custom_heading text=”1 hr” use_theme_fonts=”yes”][vc_column_text]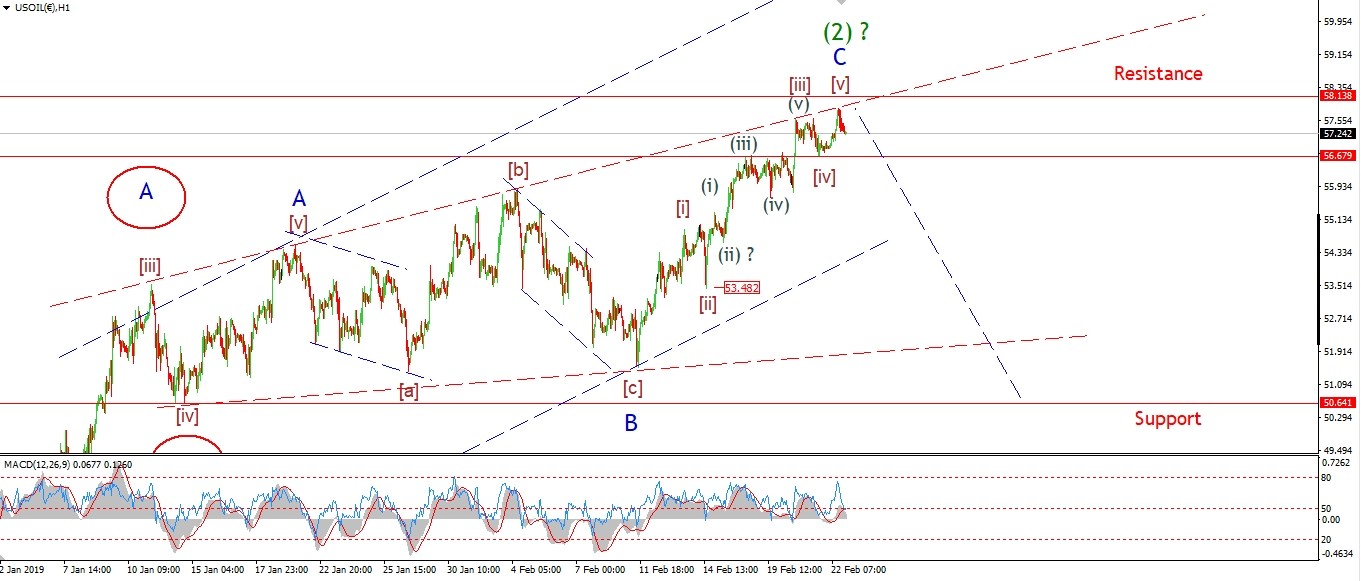 [/vc_column_text][/vc_column][vc_column width=”1/3″][vc_custom_heading text=”4 Hours” use_theme_fonts=”yes”][vc_column_text]
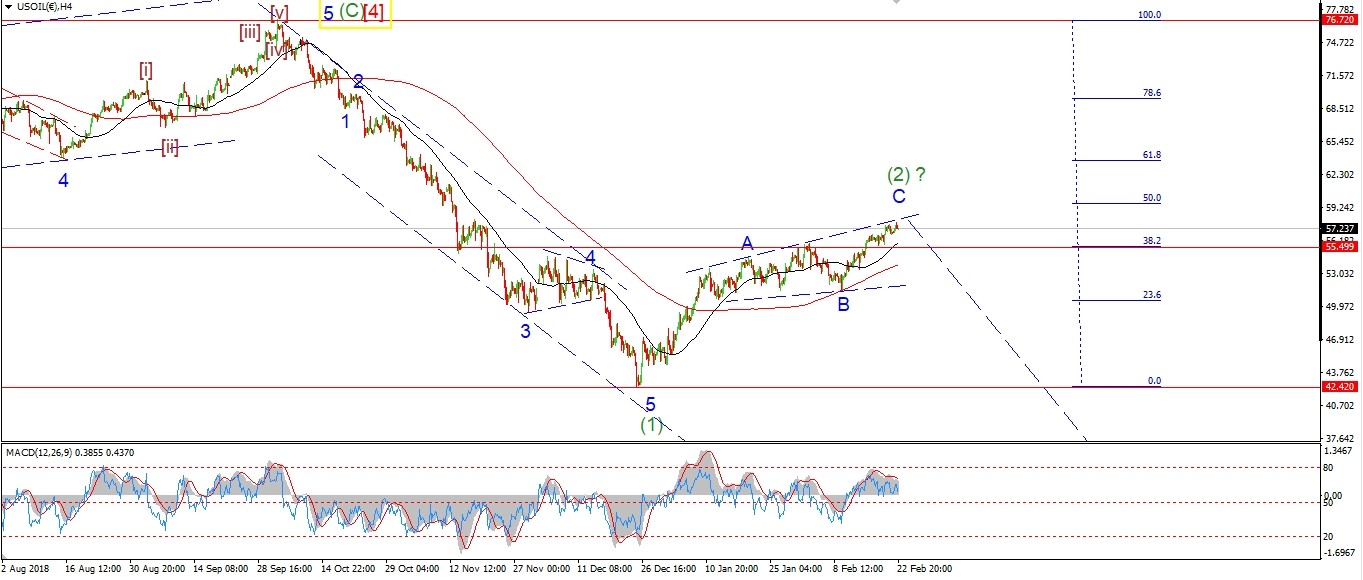 [/vc_column_text][vc_custom_heading text=”Daily” use_theme_fonts=”yes”][vc_column_text]
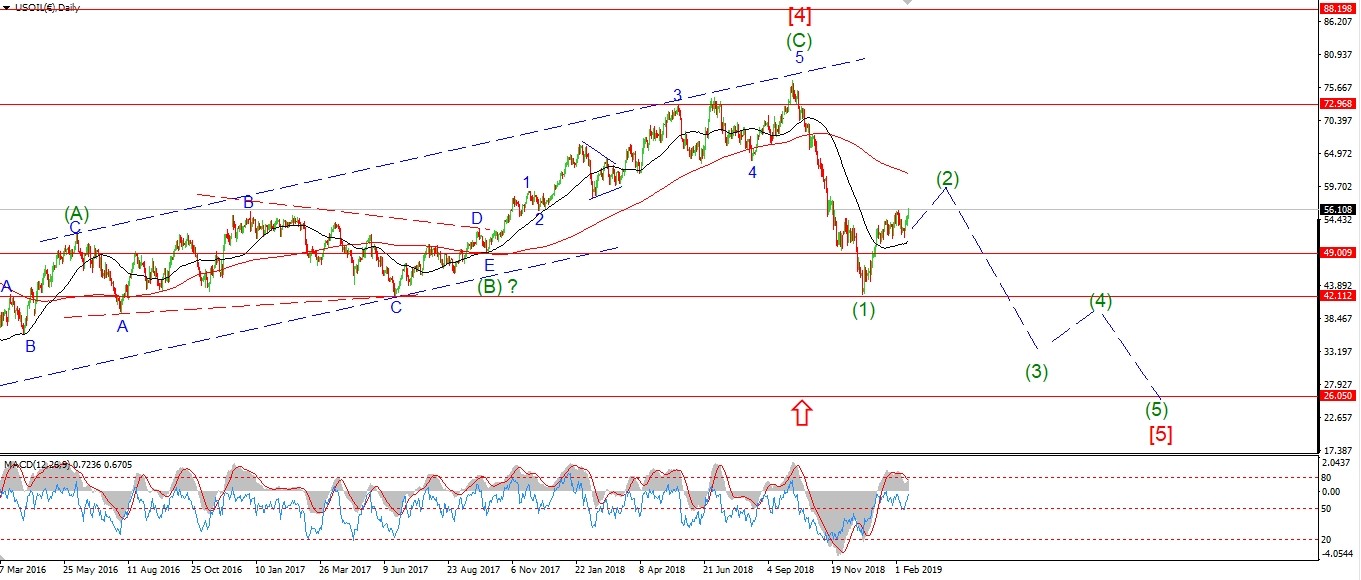 [/vc_column_text][/vc_column][/vc_row]
[vc_row][vc_column][vc_column_text]
I am now actively looking for a top in crude again.
There a few things lining up which signal that this market has run out of steam.
The price has made very little headway off the wave ‘A’ high at 54.50.
We are hitting and rebounding off this upper trendline again for the fifth time.
Momentum is diverging bearishly on both the daily and 4hr charts.
Wave ‘C’ has reached 50% of the length of wave ‘A’
And;
we have an alternate count
which shows a nice expanding wedge completing at that upper trendline.
All that the pattern needs now is a turn lower in five waves.
Monday;
The momentum setup alone calls for a drop in the near term.
Lets see if we get a five wave drop to kick us off down in wave (3).
[/vc_column_text][/vc_column][/vc_row]
[/_s2If]
[_s2If current_user_can(access_s2member_ccap_us10yr)]
[vc_row][vc_column][vc_separator border_width=”5″][/vc_column][/vc_row][vc_row][vc_column][vc_column_text]
US 10 yr Treasuries.
[/vc_column_text][/vc_column][/vc_row][vc_row][vc_column][vc_separator border_width=”5″][/vc_column][/vc_row][vc_row][vc_column width=”2/3″][vc_custom_heading text=”1 hr” use_theme_fonts=”yes”][vc_column_text]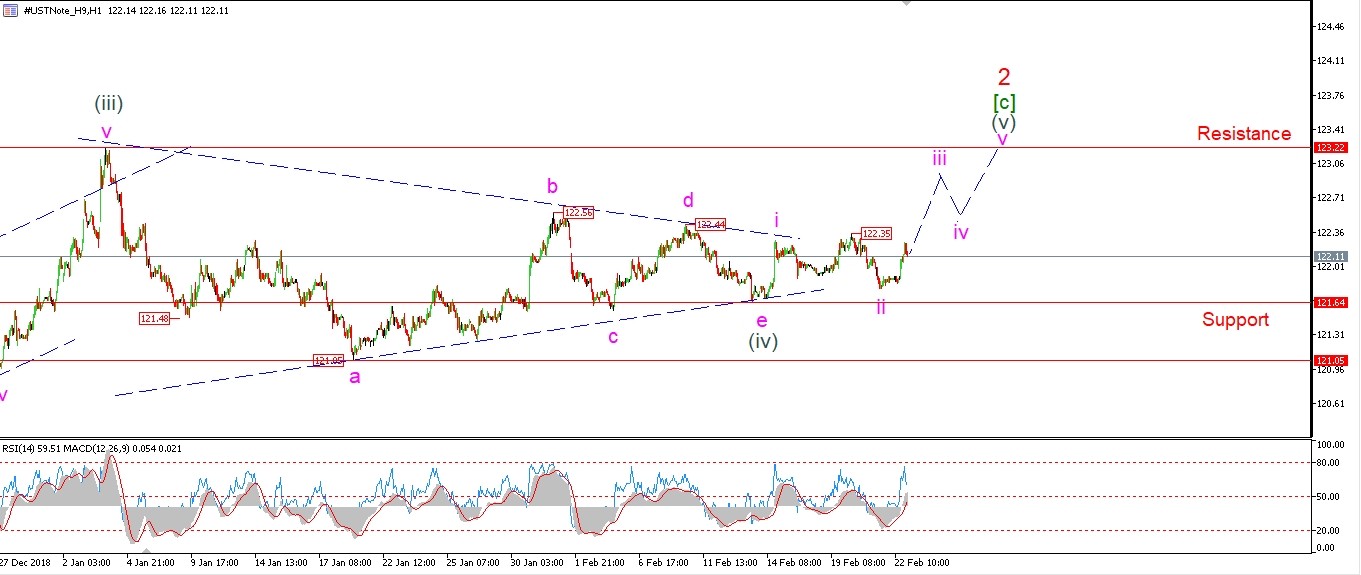 [/vc_column_text][/vc_column][vc_column width=”1/3″][vc_custom_heading text=”4 Hours” use_theme_fonts=”yes”][vc_column_text]
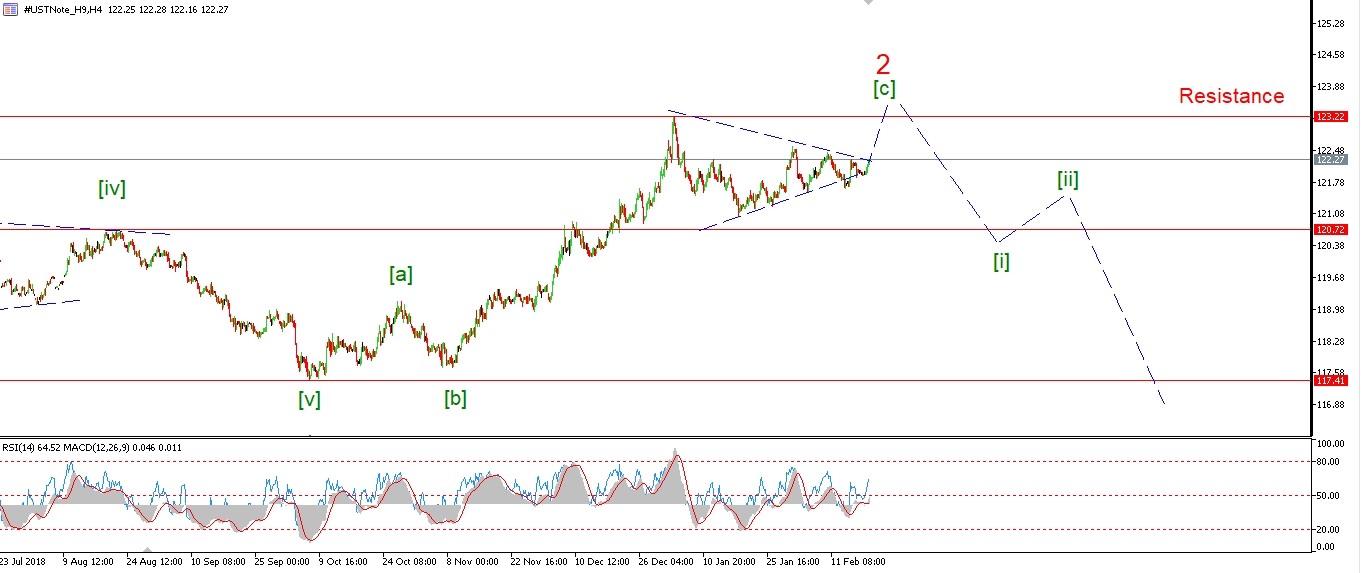 [/vc_column_text][vc_custom_heading text=”Daily” use_theme_fonts=”yes”][vc_column_text]
 [/vc_column_text][/vc_column][/vc_row]
[vc_row][vc_column][vc_column_text]
Still on break of 122.35 yet.
Only a rise above this level will confirm that wave ‘iii’ has begun.
This price range contraction will not last much longer.
A new high above 123.22 will not be bullish either.
It will likely be the final push in a second wave.
which will be followed by a drop in a very large third.
Monday;
Wave ‘iii’ will be confirmed with a break of 122.35.
next weeks action may even complete wave (v).
[/vc_column_text][/vc_column][/vc_row]
[/_s2If]
[_s2If current_user_can(access_s2member_ccap_silver)]
[vc_row][vc_column][vc_separator border_width=”5″][/vc_column][/vc_row][vc_row][vc_column][vc_column_text]
SILVER
[/vc_column_text][/vc_column][/vc_row][vc_row][vc_column][vc_separator border_width=”5″][/vc_column][/vc_row][vc_row][vc_column width=”2/3″][vc_custom_heading text=”1 hr” use_theme_fonts=”yes”][vc_column_text]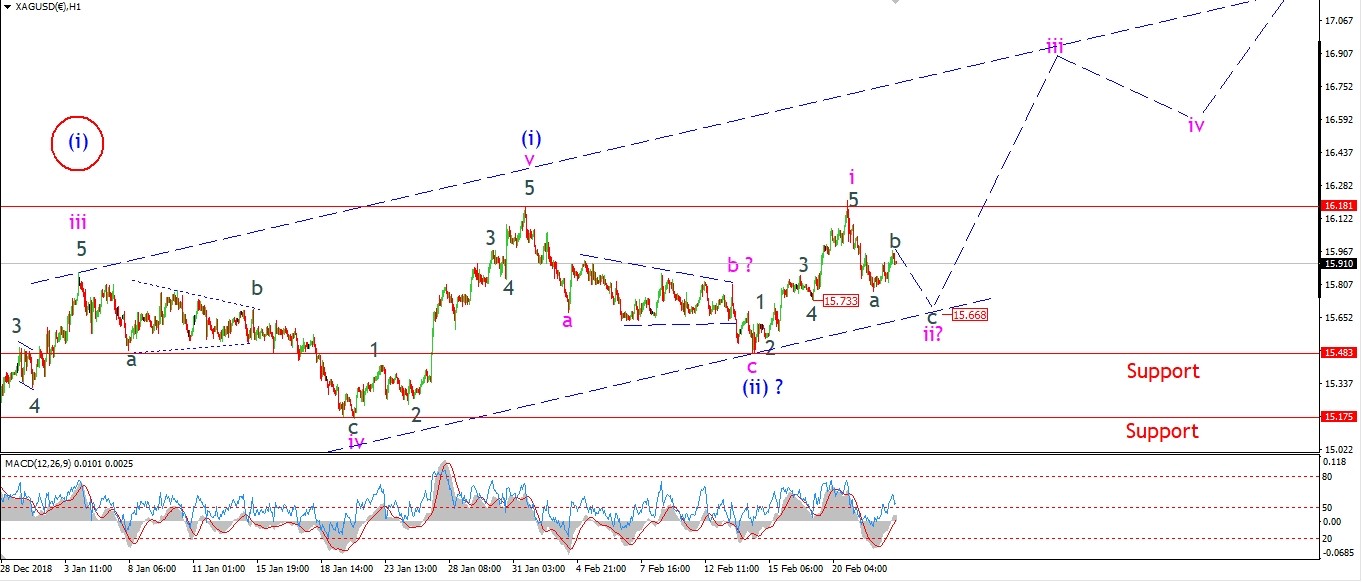 [/vc_column_text][/vc_column][vc_column width=”1/3″][vc_custom_heading text=”4 Hours” use_theme_fonts=”yes”][vc_column_text]
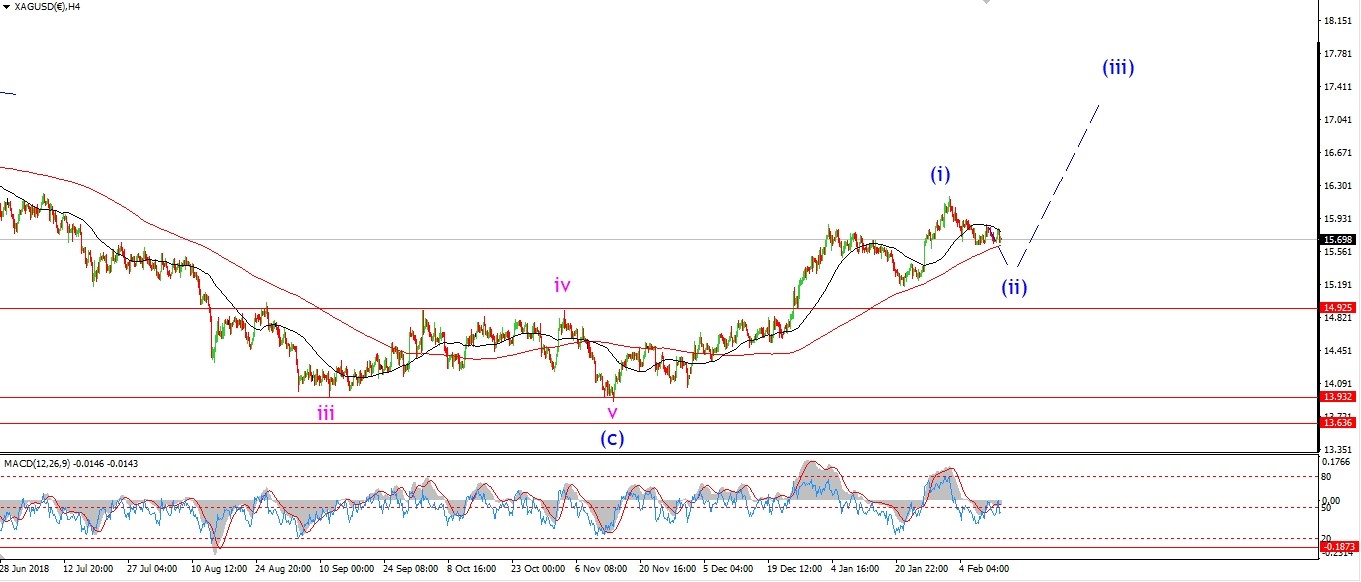 [/vc_column_text][vc_custom_heading text=”Daily” use_theme_fonts=”yes”][vc_column_text]
 [/vc_column_text][/vc_column][/vc_row]
[vc_row][vc_column][vc_column_text]
Silver has risen in three waves off Thursdays low.
This suggests that wave ‘ii’ is not yet complete.
The lower trend line at 15.60 is now the more likely option for wave ‘ii’ to complete.
Monday;
Wave ‘c’ of ‘ii’ should end by Monday evening.
Price must hold above 15.48 as wave ‘ii’ completes.
[/vc_column_text][/vc_column][/vc_row]
[/_s2If]
[_s2If current_user_can(access_s2member_ccap_sp500)]
[vc_row][vc_column][vc_separator border_width=”5″][/vc_column][/vc_row][vc_row][vc_column][vc_column_text]
S&P 500.
[/vc_column_text][/vc_column][/vc_row][vc_row][vc_column][vc_separator border_width=”5″][/vc_column][/vc_row][vc_row][vc_column width=”2/3″][vc_custom_heading text=”1 hr” use_theme_fonts=”yes”][vc_column_text]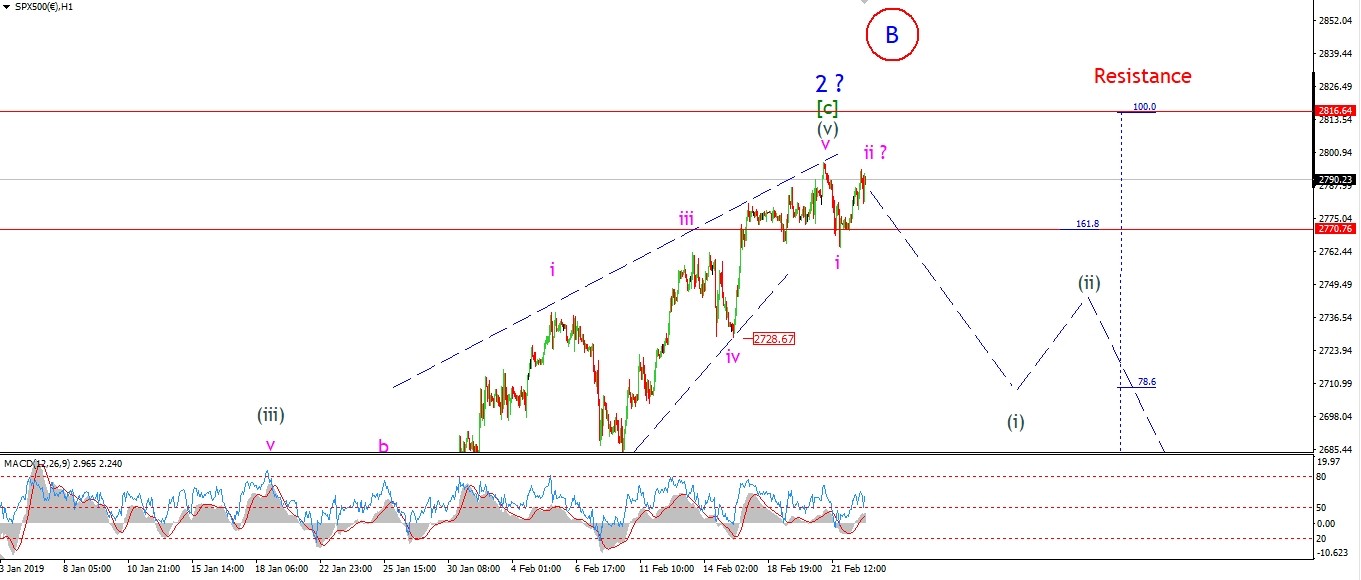 [/vc_column_text][/vc_column][vc_column width=”1/3″][vc_custom_heading text=”4 Hours” use_theme_fonts=”yes”][vc_column_text]
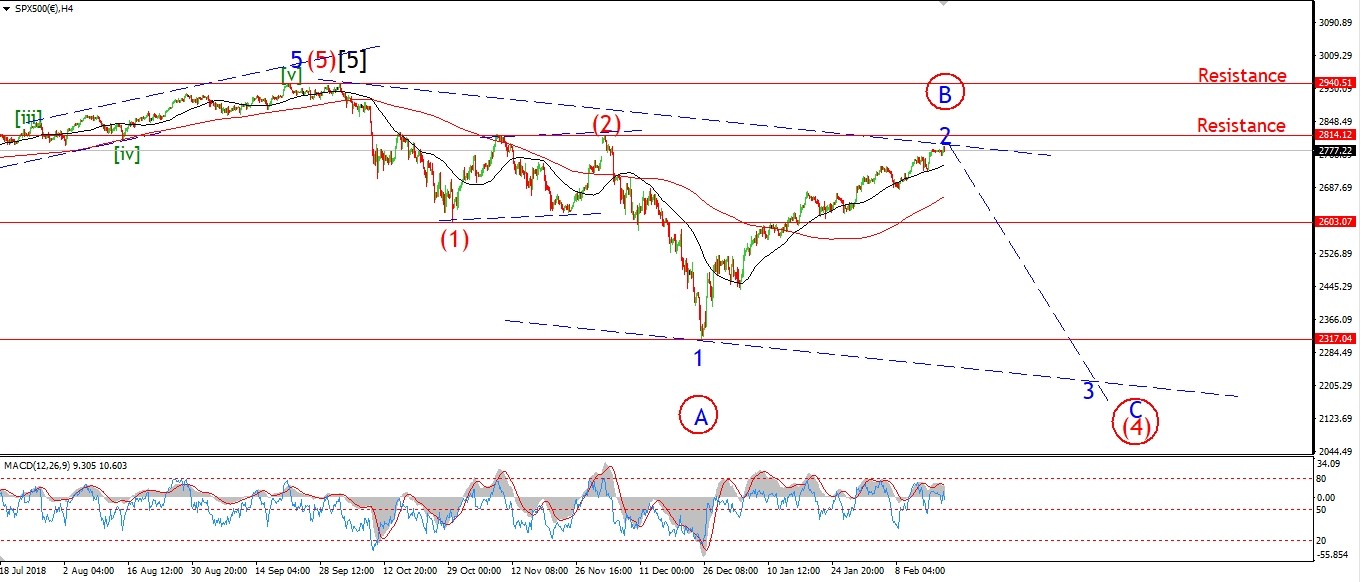 [/vc_column_text][vc_custom_heading text=”Daily” use_theme_fonts=”yes”][vc_column_text]
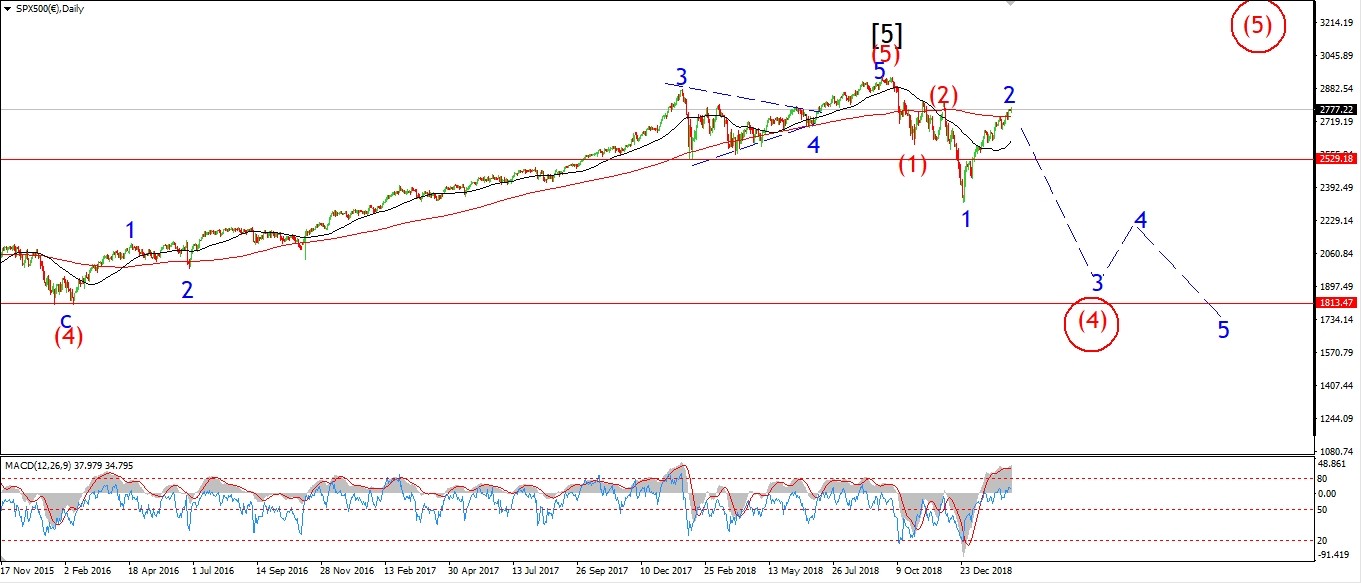 [/vc_column_text][/vc_column][/vc_row]
[vc_row][vc_column][vc_column_text]
The bearish momentum divergence in the S&P is even more stark than the DOW.
4hr MACD peaked on Jan 10th,and its been a series of lower highs since then.
That is a clean 6 week head start for momentum
as we swing down into wave ‘3’ or ‘C’.
The main point being,
this rally will end very soon.
And not a sinner is expecting it to.
Which of course leaves us in a very vulnerable position as that is when the potential for a crash is at it’s zenith.
The drop over the last couple of days has been almost fully retraced now.
It is very possible that we make a new high again following these trade talks which are now going on.
Although,
The market has been rallying on trade talk bull over the last month.
So it’s effect has already run its course.
Next week;
The only thing left to do is for this market to turn down in five waves.
It may be a swift move also given the setup.
watch for 2816 to hold.
[/vc_column_text][/vc_column][/vc_row]
[/_s2If]
[vc_row][vc_column][vc_column_text]
Have a great weekend ya’ll!
God bless you all.
See you again on Monday for another trek into the abyss.
[/vc_column_text][/vc_column][/vc_row]
[vc_row][vc_column][vc_separator border_width=”5″][/vc_column][/vc_row]