
[vc_row][vc_column][vc_separator border_width=”5″][/vc_column][/vc_row]
[vc_row][vc_column][vc_column_text]
Hi everyone,
I hope you had a good day.
[/vc_column_text][/vc_column][/vc_row]
[_s2If current_user_can(access_s2member_ccap_eurusd)]
[vc_row][vc_column][vc_separator border_width=”5″][/vc_column][/vc_row]
[vc_row][vc_column][vc_column_text]
EURUSD
[/vc_column_text][/vc_column][/vc_row]
[vc_row][vc_column][vc_separator border_width=”5″][/vc_column][/vc_row][vc_row][vc_column width=”2/3″][vc_custom_heading text=”1 hr” use_theme_fonts=”yes”][vc_column_text]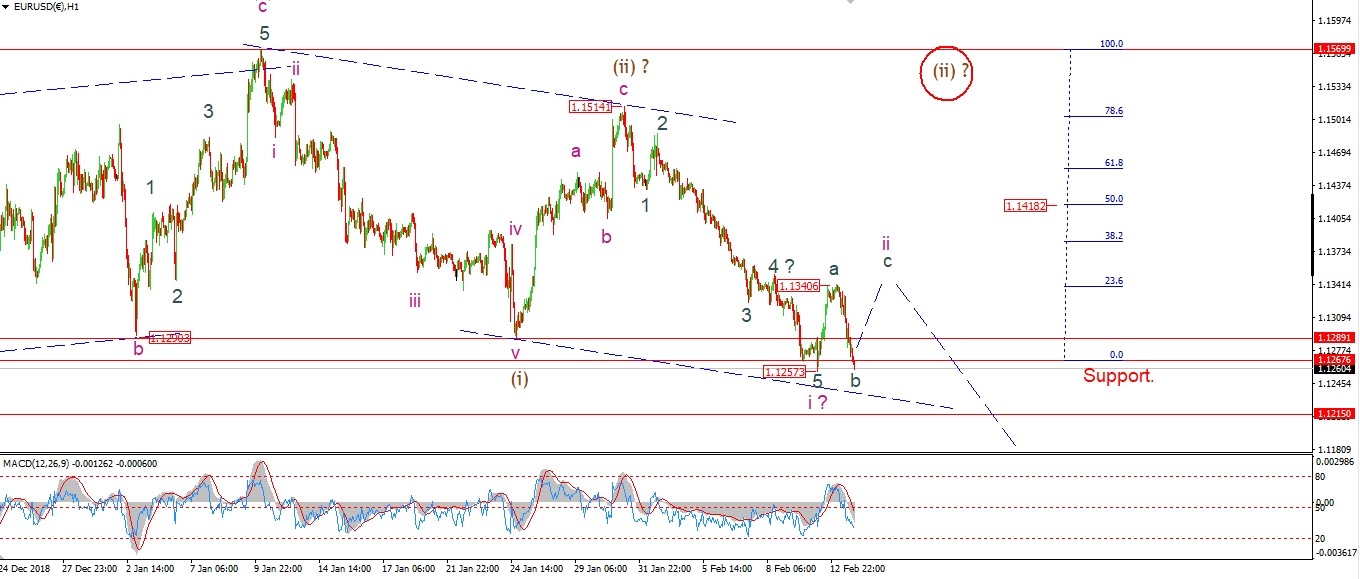 [/vc_column_text][/vc_column][vc_column width=”1/3″][vc_custom_heading text=”4 Hours” use_theme_fonts=”yes”][vc_column_text]
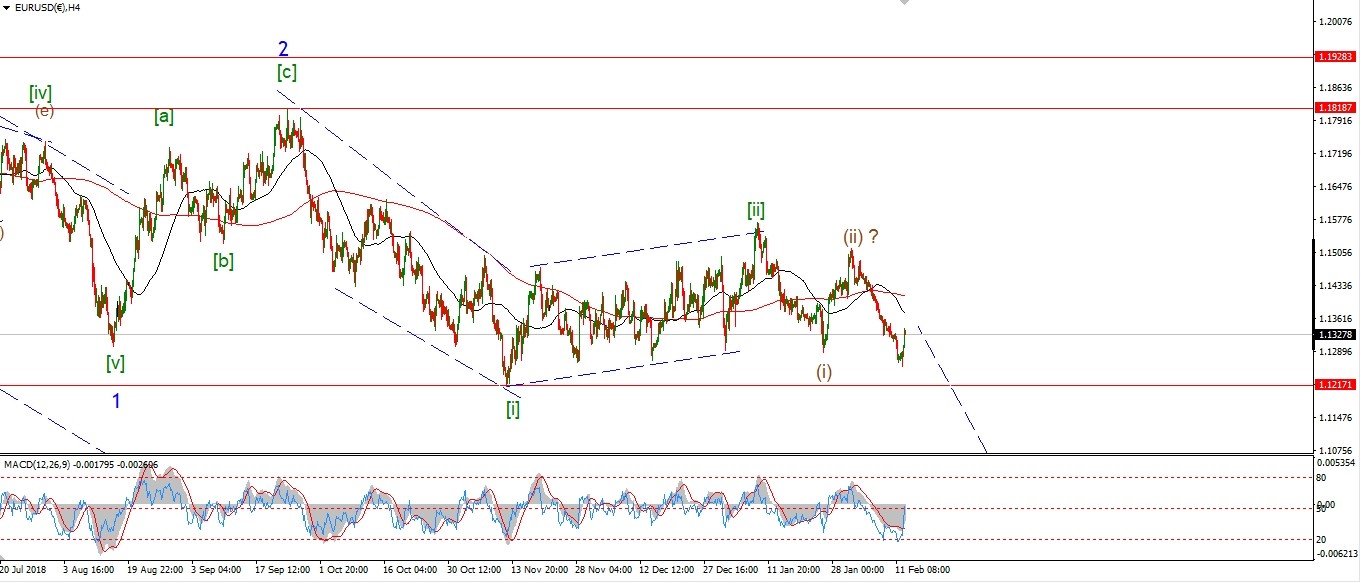 [/vc_column_text][vc_custom_heading text=”Daily” use_theme_fonts=”yes”][vc_column_text]
 [/vc_column_text][/vc_column][/vc_row]
[vc_row][vc_column][vc_column_text]
Wave ‘b’ of ‘ii’ dropped back into support today and is closing at the lows of the session.
The low at 1.1257 should hold if this is a zigzag correction.
And wave ‘c’ is expected to rally tomorrow to complete the three wave correction.
Tomorrow;
Watch for a break of the wave ‘a’ high at 1.1340 as a minimum target for wave ‘c’.
[/vc_column_text][/vc_column][/vc_row]
[/_s2If]
[_s2If current_user_can(access_s2member_ccap_gbpusd)]
[vc_row][vc_column][vc_separator border_width=”5″][/vc_column][/vc_row][vc_row][vc_column][vc_column_text]
GBPUSD
[/vc_column_text][/vc_column][/vc_row][vc_row][vc_column][vc_separator border_width=”5″][/vc_column][/vc_row][vc_row][vc_column width=”2/3″][vc_custom_heading text=”1 hr” use_theme_fonts=”yes”][vc_column_text]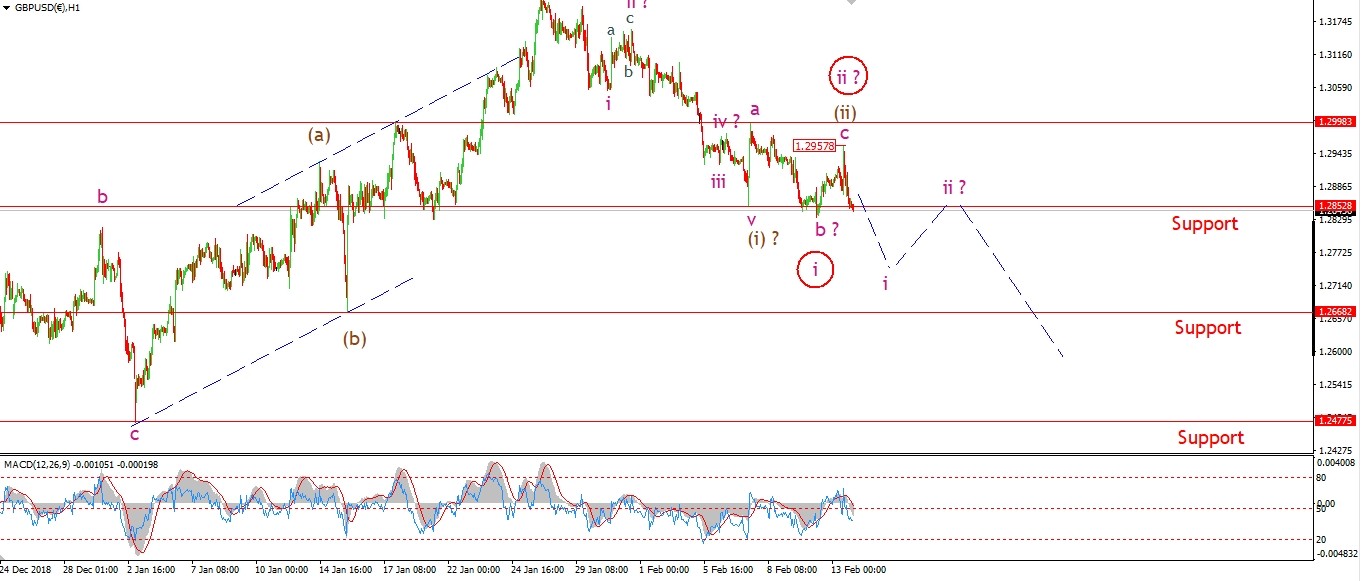 [/vc_column_text][/vc_column][vc_column width=”1/3″][vc_custom_heading text=”4 Hours” use_theme_fonts=”yes”][vc_column_text]
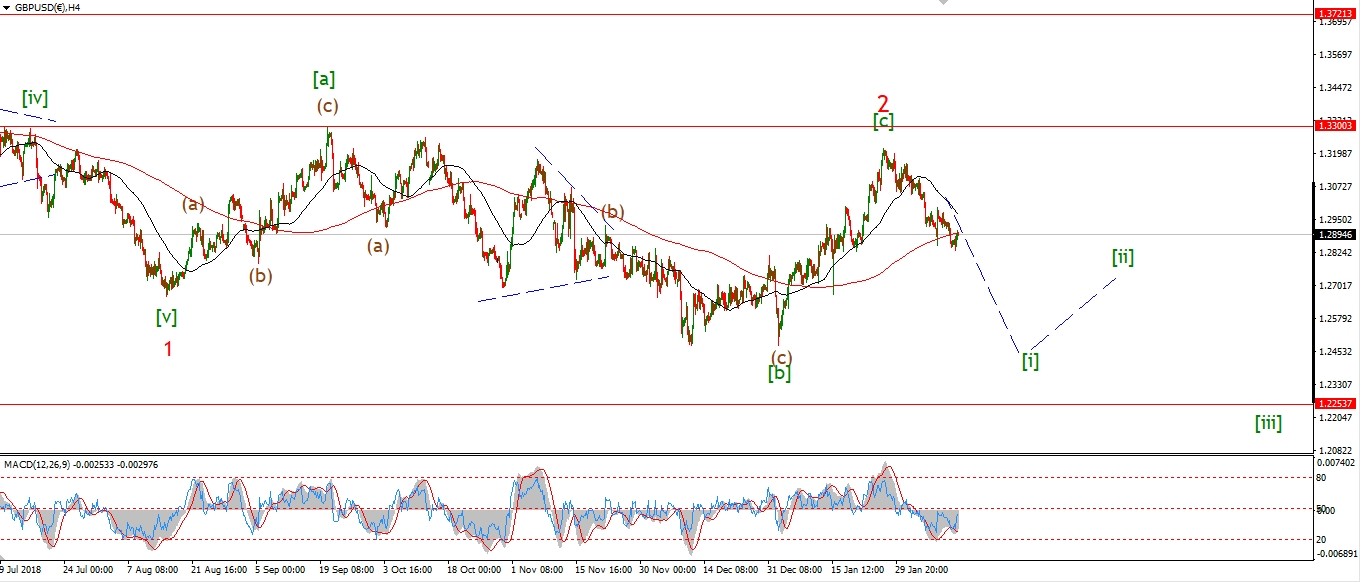 [/vc_column_text][vc_custom_heading text=”Daily” use_theme_fonts=”yes”][vc_column_text]
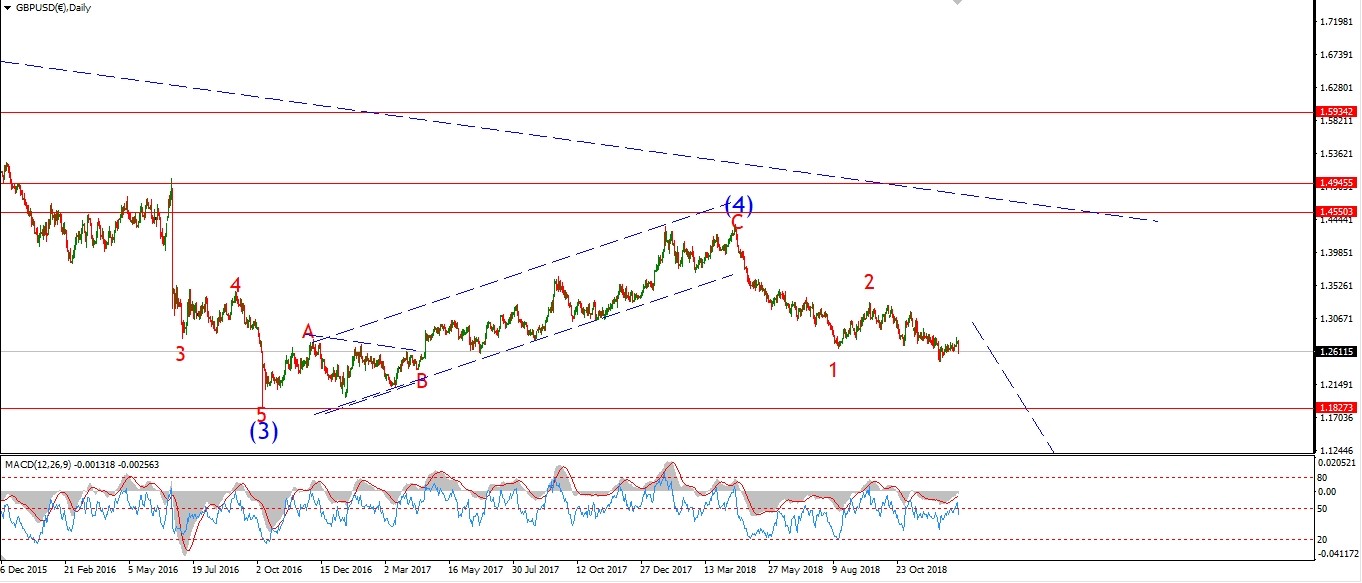 [/vc_column_text][/vc_column][/vc_row]
[vc_row][vc_column][vc_column_text]
GBPUSD spiked to a lower high below the wave ‘a’ level at 1.2998.
Then the market turned lower again back to support.
The rise off the low labelled wave ‘b’ created a three wave form.
This means wave (ii) is a complex running flat,
or,
wave (iii) down is already underway,
and waves ‘i’ and ‘ii’ are complete at todays highs.
it’s hard to calls between those two ideas.
Tomorrow;
If the market moves sharply lower that will indicate wave ‘iii’ of (iii) is underway.
However a decline in wave ‘i’ of (iii) will likely find support at 1.2668.
Watch for 1.2957 to hold and wave (iii) down to get underway.
[/vc_column_text][/vc_column][/vc_row]
[/_s2If]
[_s2If current_user_can(access_s2member_ccap_usdjpy)]
[vc_row][vc_column][vc_separator border_width=”5″][/vc_column][/vc_row][vc_row][vc_column][vc_column_text]
USDJPY
[/vc_column_text][/vc_column][/vc_row][vc_row][vc_column][vc_separator border_width=”5″][/vc_column][/vc_row][vc_row][vc_column width=”2/3″][vc_custom_heading text=”1 hr” use_theme_fonts=”yes”][vc_column_text]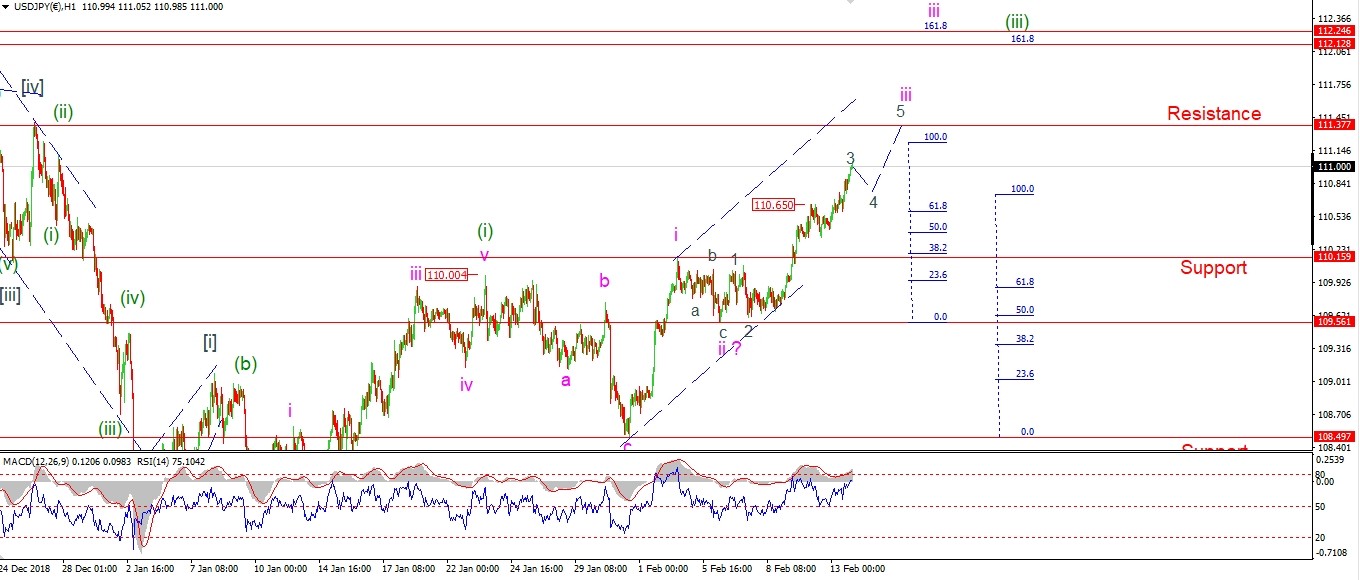 [/vc_column_text][/vc_column][vc_column width=”1/3″][vc_custom_heading text=”4 Hours” use_theme_fonts=”yes”][vc_column_text]
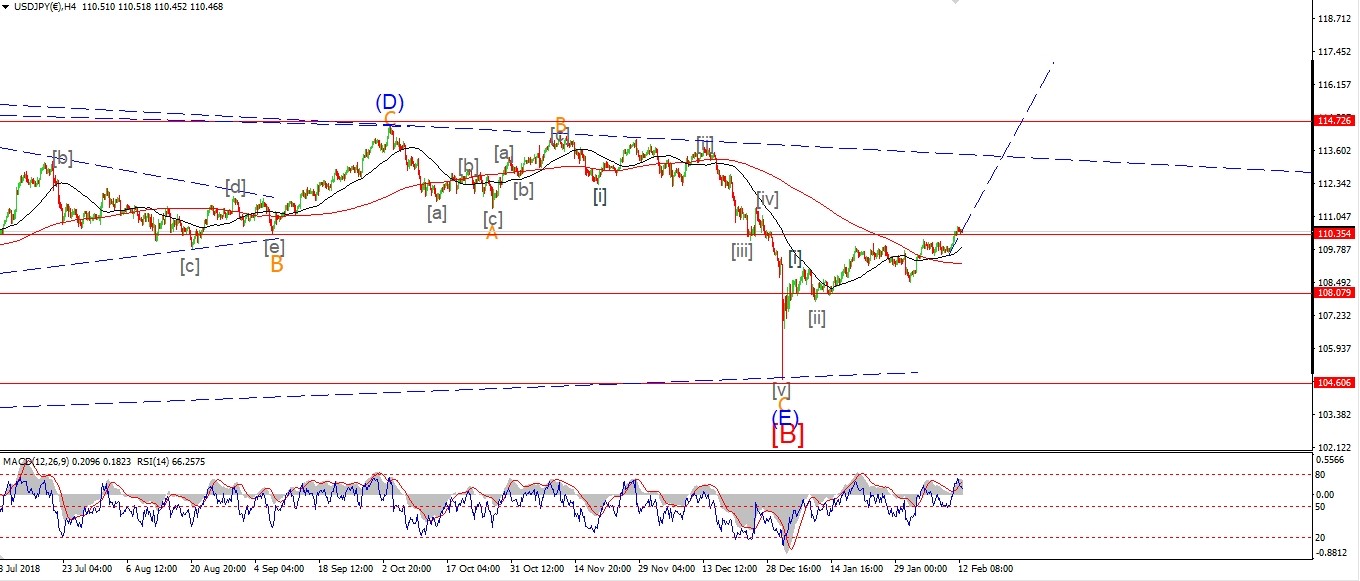 [/vc_column_text][vc_custom_heading text=”Daily” use_theme_fonts=”yes”][vc_column_text]
 [/vc_column_text][/vc_column][/vc_row]
[vc_row][vc_column][vc_column_text]
110.15 has held today and the price continued higher in wave ‘iii’.
Wave ‘3’ of ‘iii’ has completed a five wave internal structure.
but we could see a further extension towards resistance at 111.37.
the overnight session could do that easily.
Tomorrows action will likely bring a correction in a possible wave ‘4’ of ‘iii’.
If so, 110.65 should offer support to wave ‘4’.
Tomorrow;
the outlook remains for wave ‘iii’ to continue higher
and for support at 110.15 to hold from here on out as wave (iii) completes.
[/vc_column_text][/vc_column][/vc_row]
[/_s2If]
[_s2If current_user_can(access_s2member_ccap_dow_jones)]
[vc_row][vc_column][vc_separator border_width=”5″][/vc_column][/vc_row][vc_row][vc_column][vc_column_text]
DOW JONES INDUSTRIALS
[/vc_column_text][/vc_column][/vc_row][vc_row][vc_column][vc_separator border_width=”5″][/vc_column][/vc_row][vc_row][vc_column width=”2/3″][vc_custom_heading text=”1 hr” use_theme_fonts=”yes”][vc_column_text]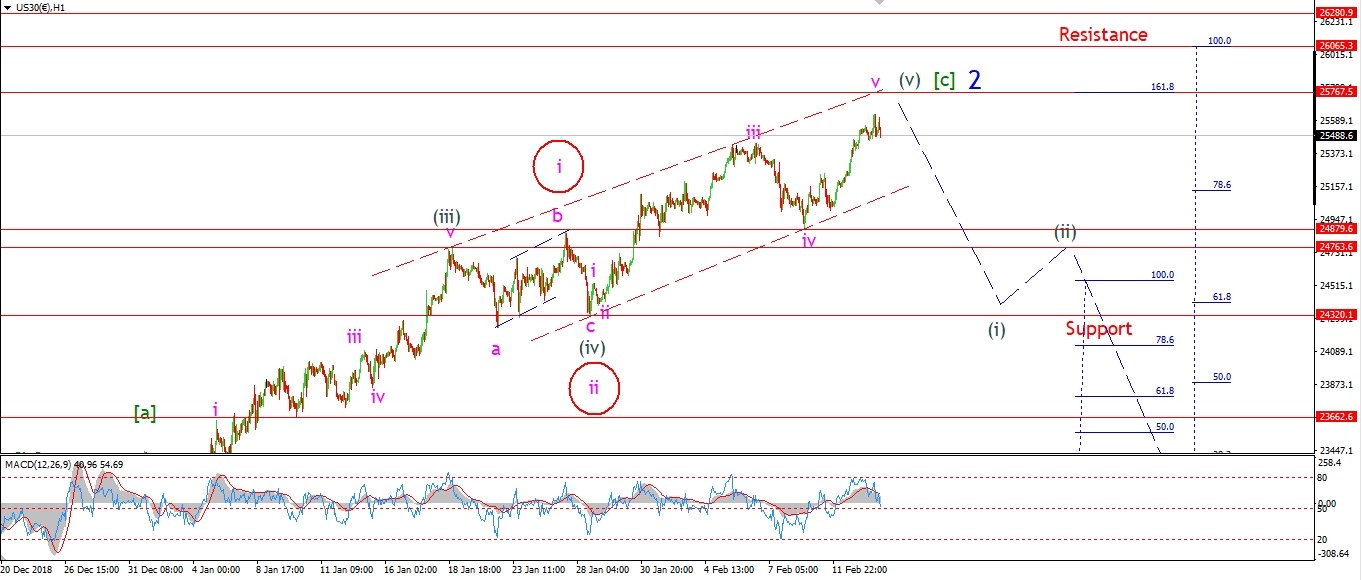 [/vc_column_text][/vc_column][vc_column width=”1/3″][vc_custom_heading text=”4 Hours” use_theme_fonts=”yes”][vc_column_text]
 [/vc_column_text][vc_custom_heading text=”Daily” use_theme_fonts=”yes”][vc_column_text]
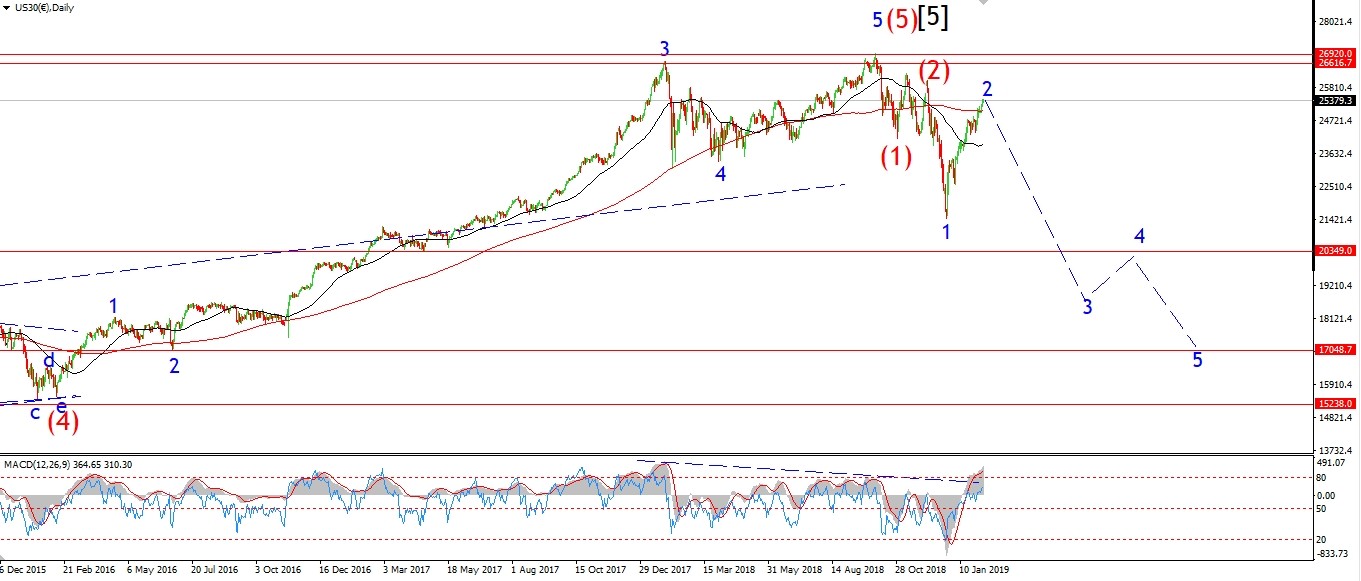 [/vc_column_text][/vc_column][/vc_row]
[vc_row][vc_column][vc_column_text]
The market is stalling tonight at the upper end of this wave ‘v’ of (v).
24880 marks the low of wave ‘iv’ of (v).
So this now becomes the first level of interest.
If we see a break of this level it will signal the beginning of wave (i) down.
The 162% extension of wave [a] is still untouched,
so for now it remains possible that this level will be met.
only a break of that wave ‘iv’ low at 24880 will discount that view.
Bullish sentiment is s outrageously high in the market these days as evidenced by this wave [c] rally,
so much so,
that every signal market decline,
no matter how big,
is immediately seen as a gift to buy more stock.
This myopic viewpoint will be punished in the next leg down.
Tomorrow;
Watch for wave ‘v’ to complete at or below 25767.
[/vc_column_text][/vc_column][/vc_row]
[/_s2If]
[_s2If current_user_can(access_s2member_ccap_gold)]
[vc_row][vc_column][vc_separator border_width=”5″][/vc_column][/vc_row][vc_row][vc_column][vc_column_text]
GOLD
[/vc_column_text][/vc_column][/vc_row][vc_row][vc_column][vc_separator border_width=”5″][/vc_column][/vc_row][vc_row][vc_column width=”2/3″][vc_custom_heading text=”1 hr” use_theme_fonts=”yes”][vc_column_text]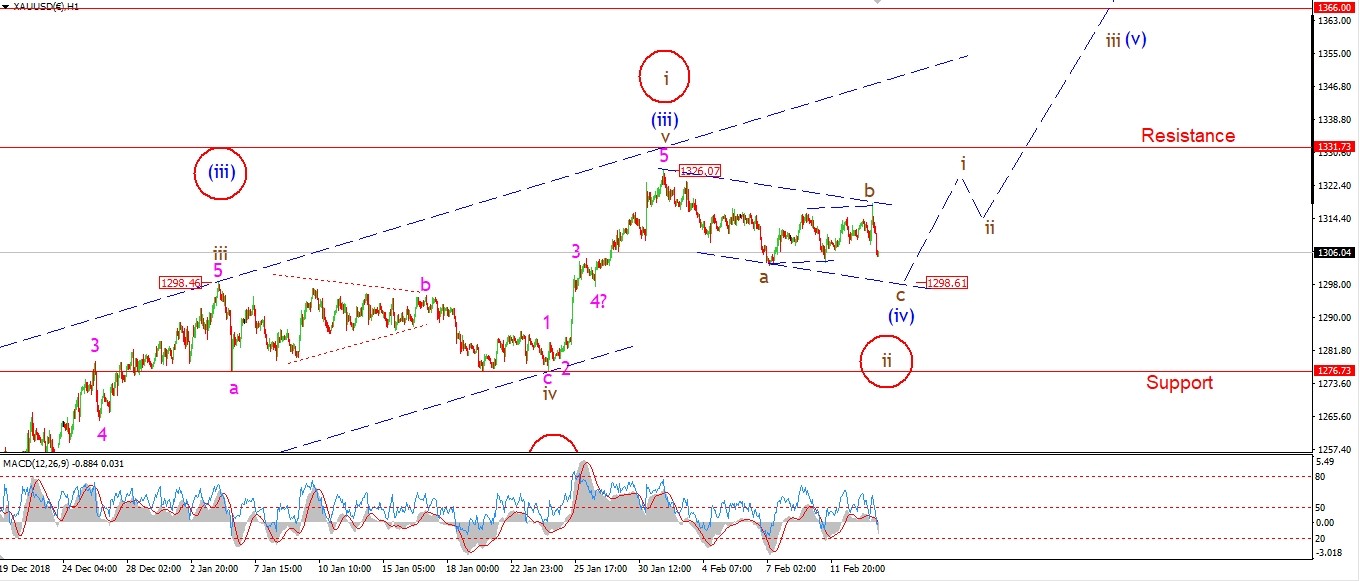 [/vc_column_text][/vc_column][vc_column width=”1/3″][vc_custom_heading text=”4 Hours” use_theme_fonts=”yes”][vc_column_text]
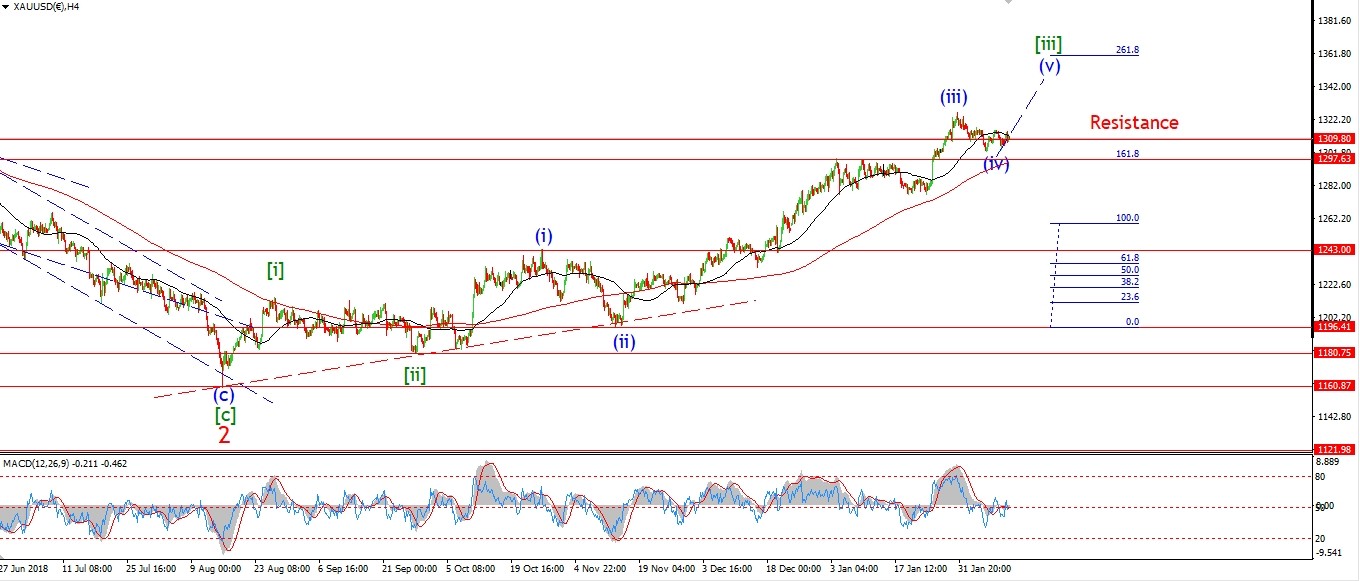 [/vc_column_text][vc_custom_heading text=”Daily” use_theme_fonts=”yes”][vc_column_text]
 [/vc_column_text][/vc_column][/vc_row]
[vc_row][vc_column][vc_column_text]
Gold rose to a slight new high above the bounds of the triangle shown last night.
This invalidates the triangle idea for wave (iv),
and is now seems that wave (iv) is creating a simple flat correction
with a 3,3,5 internal structure.
Wave ‘b’ of (iv) completed within a trend channel at todays highs,
and now wave ‘c’ is declining in 5 waves.
Tomorrow;
Wave (iv) should complete tomorrow at the lower trend channel line.
this suggests a low at 1298 for wave ‘c’ of (iv).
[/vc_column_text][/vc_column][/vc_row]
[/_s2If]
[_s2If current_user_can(access_s2member_ccap_crude)]
[vc_row][vc_column][vc_separator border_width=”5″][/vc_column][/vc_row][vc_row][vc_column][vc_column_text]
U.S CRUDE OIL
[/vc_column_text][/vc_column][/vc_row][vc_row][vc_column][vc_separator border_width=”5″][/vc_column][/vc_row][vc_row][vc_column width=”2/3″][vc_custom_heading text=”1 hr” use_theme_fonts=”yes”][vc_column_text]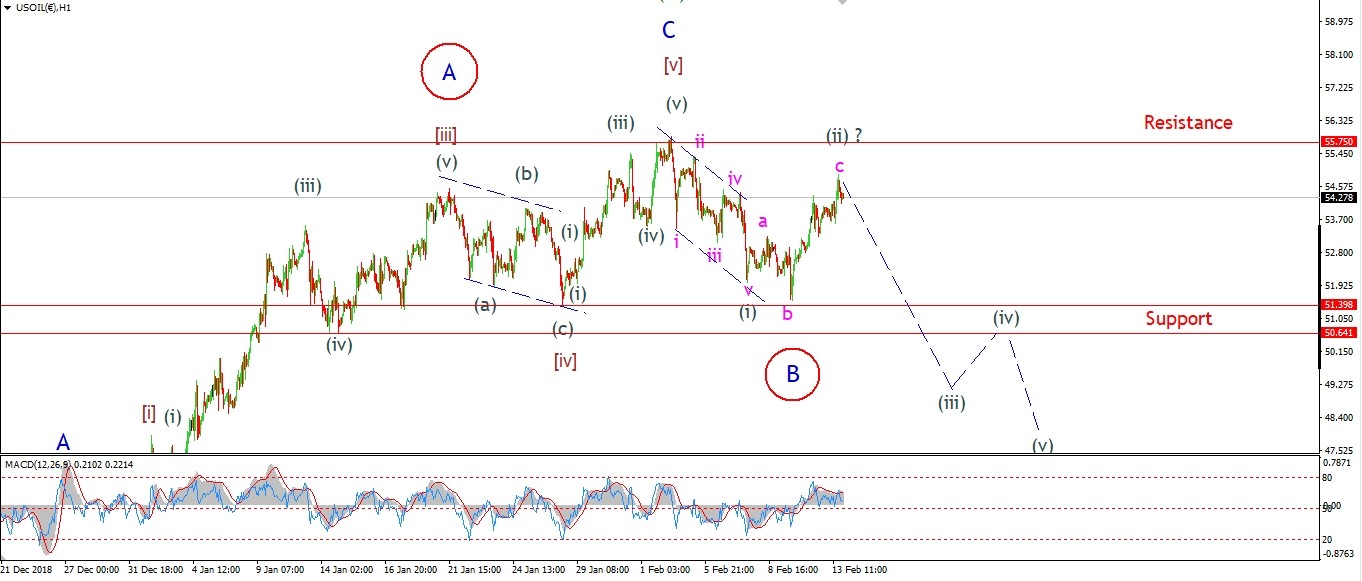 [/vc_column_text][/vc_column][vc_column width=”1/3″][vc_custom_heading text=”4 Hours” use_theme_fonts=”yes”][vc_column_text]
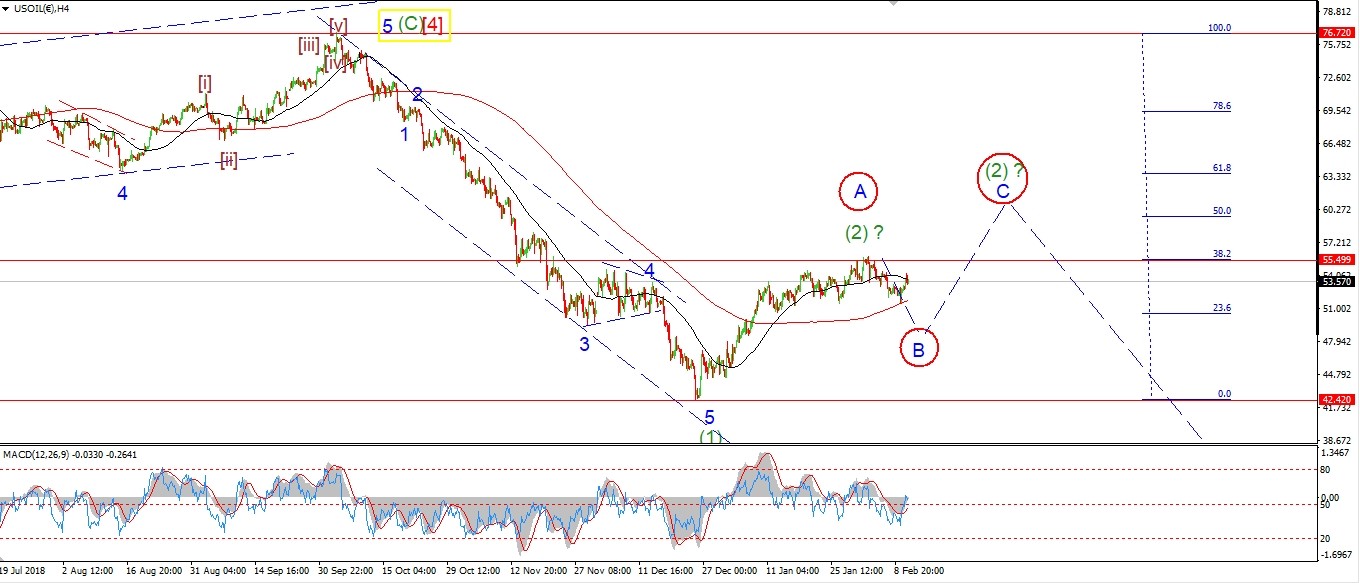 [/vc_column_text][vc_custom_heading text=”Daily” use_theme_fonts=”yes”][vc_column_text]
 [/vc_column_text][/vc_column][/vc_row]
[vc_row][vc_column][vc_column_text]
Crude has continued higher today and this calls into question the current wave count.
I wonder if the price has completed wave ‘B’ in a running flat
at the recent lows as shown by the alternate count.
If we see a break of resistance at 55.75 in five waves,
and then a three wave decline to a higher low,
this will signal that wave ‘C’ of the alternate count is likely getting started.
And we should then expect a rally up towards the 63.00 area
which is at the 62% retracement level
and this would complete that alternate wave (2) scenario shown on the 4hr chart.
Tomorrow;
55.75 must continue to hold and wave (iii) down needs to get going to stay with this bearish count.
A break of 51.40 again will affirm the current count.
[/vc_column_text][/vc_column][/vc_row]
[/_s2If]
[_s2If current_user_can(access_s2member_ccap_us10yr)]
[vc_row][vc_column][vc_separator border_width=”5″][/vc_column][/vc_row][vc_row][vc_column][vc_column_text]
US 10 yr Treasuries.
[/vc_column_text][/vc_column][/vc_row][vc_row][vc_column][vc_separator border_width=”5″][/vc_column][/vc_row][vc_row][vc_column width=”2/3″][vc_custom_heading text=”1 hr” use_theme_fonts=”yes”][vc_column_text] [/vc_column_text][/vc_column][vc_column width=”1/3″][vc_custom_heading text=”4 Hours” use_theme_fonts=”yes”][vc_column_text]
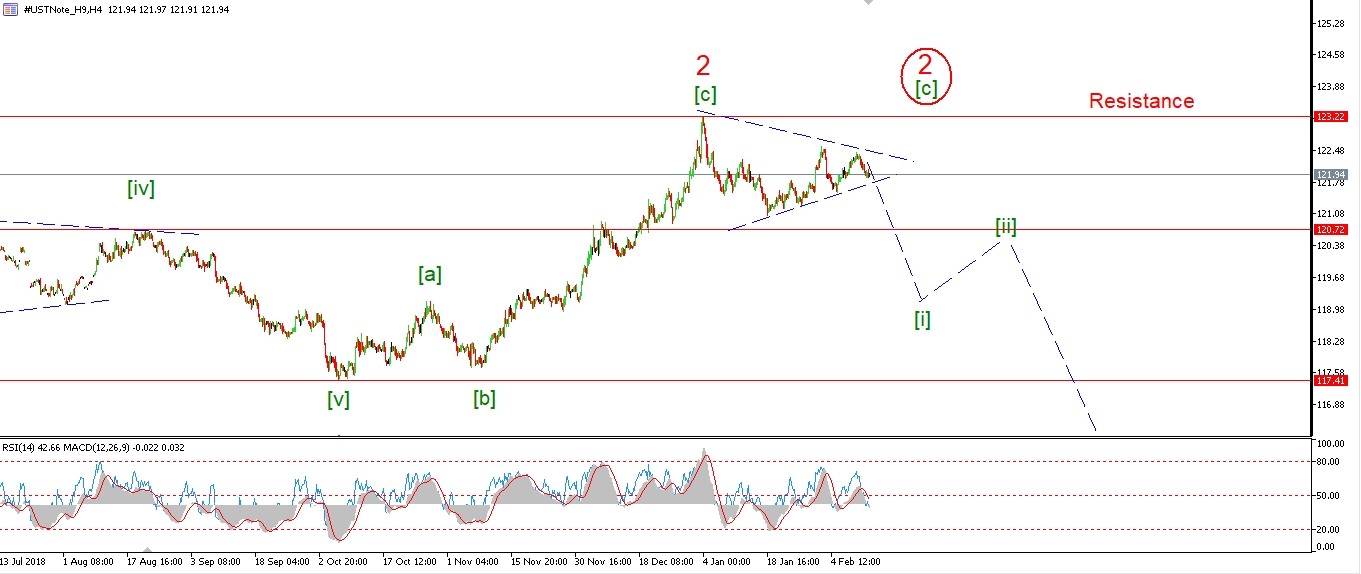 [/vc_column_text][vc_custom_heading text=”Daily” use_theme_fonts=”yes”][vc_column_text]
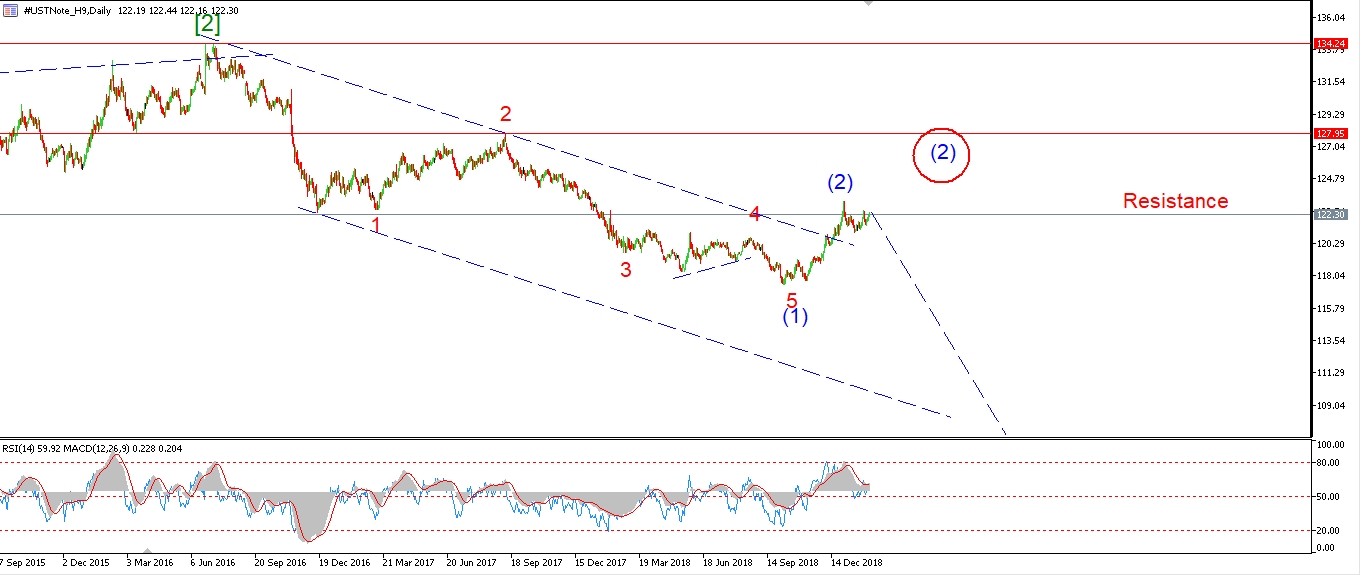 [/vc_column_text][/vc_column][/vc_row]
[vc_row][vc_column][vc_column_text]
The price is heading lower again today in a possible wave ‘iii’,
although we need confirmation of this wave with a break of support at 121.06.
The low of the session did not break the wave ‘i’ low at 121.56,
A break of this level will reduce the probability of that alternate count on the 4hr chart.
Tomorrow;
122.45 must hold and the low of wave ‘i’ should break at 121.56 to signal that wave ‘iii’ of (iii) is underway.
[/vc_column_text][/vc_column][/vc_row]
[/_s2If]
[_s2If current_user_can(access_s2member_ccap_silver)]
[vc_row][vc_column][vc_separator border_width=”5″][/vc_column][/vc_row][vc_row][vc_column][vc_column_text]
SILVER
[/vc_column_text][/vc_column][/vc_row][vc_row][vc_column][vc_separator border_width=”5″][/vc_column][/vc_row][vc_row][vc_column width=”2/3″][vc_custom_heading text=”1 hr” use_theme_fonts=”yes”][vc_column_text]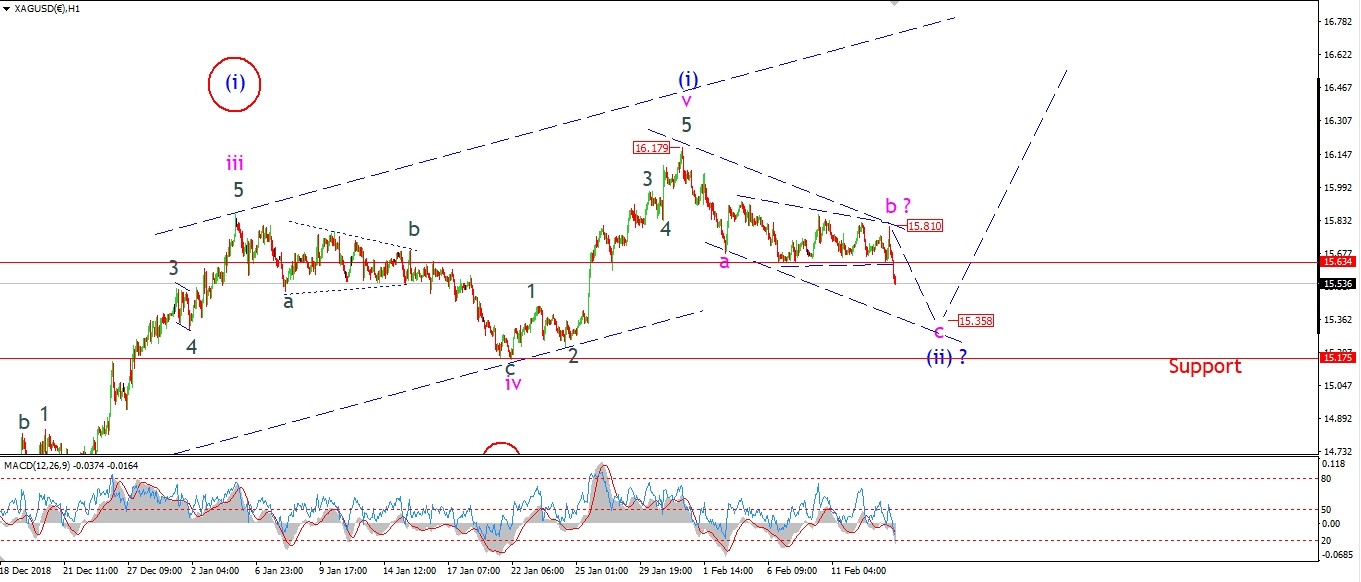 [/vc_column_text][/vc_column][vc_column width=”1/3″][vc_custom_heading text=”4 Hours” use_theme_fonts=”yes”][vc_column_text]
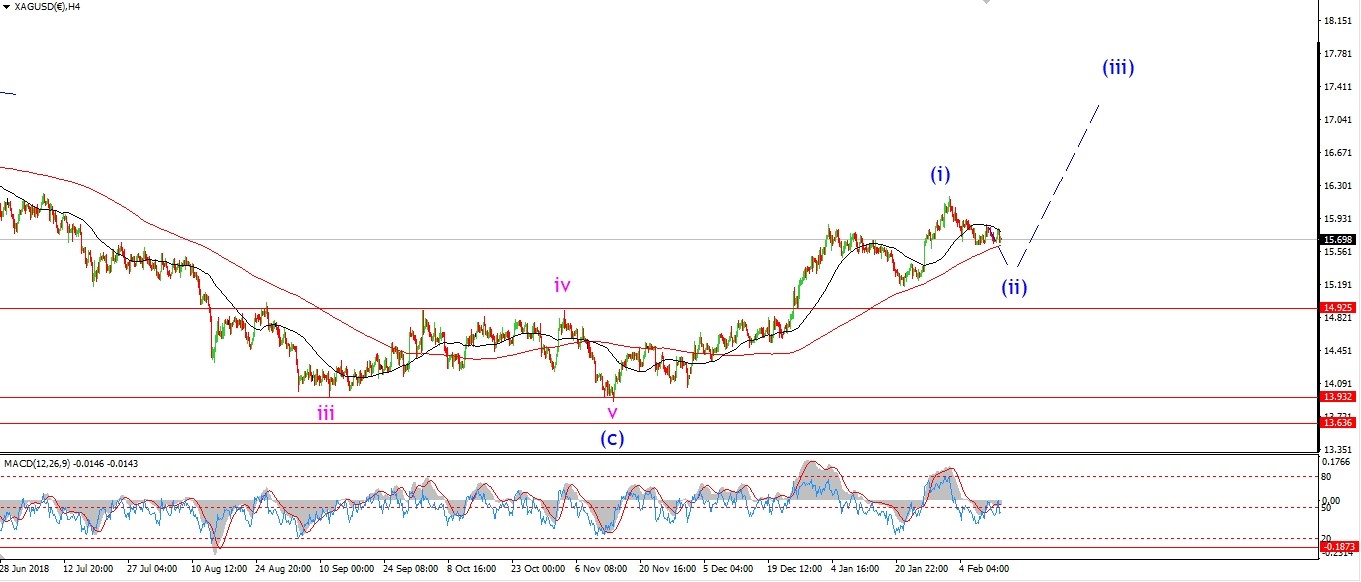 [/vc_column_text][vc_custom_heading text=”Daily” use_theme_fonts=”yes”][vc_column_text]
 [/vc_column_text][/vc_column][/vc_row]
[vc_row][vc_column][vc_column_text]
Silver is now declining in wave ‘c’ of (ii)
after after completing a triangle wave ‘b’ at todays highs.
The price is moving sharply lower,
this suggests a five wave move is underway
and wave ‘c’ should hit the lower trend channel line at about 15.35 to complete the larger wave (ii).
15.17 is the initial support level at the previous wave ‘iv’.
This level is at the lower end for wave (ii) to complete.
Tomorrow;
Watch for wave ‘c’ to continue lower into 15.35.
[/vc_column_text][/vc_column][/vc_row]
[/_s2If]
[_s2If current_user_can(access_s2member_ccap_sp500)]
[vc_row][vc_column][vc_separator border_width=”5″][/vc_column][/vc_row][vc_row][vc_column][vc_column_text]
S&P 500.
[/vc_column_text][/vc_column][/vc_row][vc_row][vc_column][vc_separator border_width=”5″][/vc_column][/vc_row][vc_row][vc_column width=”2/3″][vc_custom_heading text=”1 hr” use_theme_fonts=”yes”][vc_column_text] [/vc_column_text][/vc_column][vc_column width=”1/3″][vc_custom_heading text=”4 Hours” use_theme_fonts=”yes”][vc_column_text]
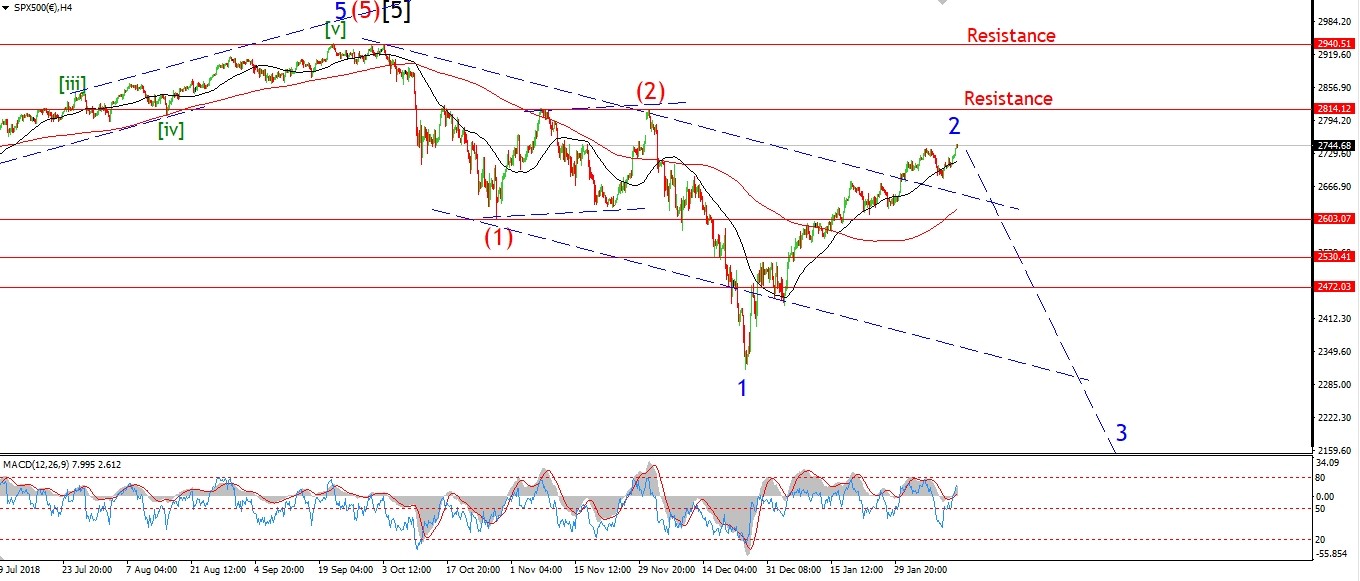 [/vc_column_text][vc_custom_heading text=”Daily” use_theme_fonts=”yes”][vc_column_text]
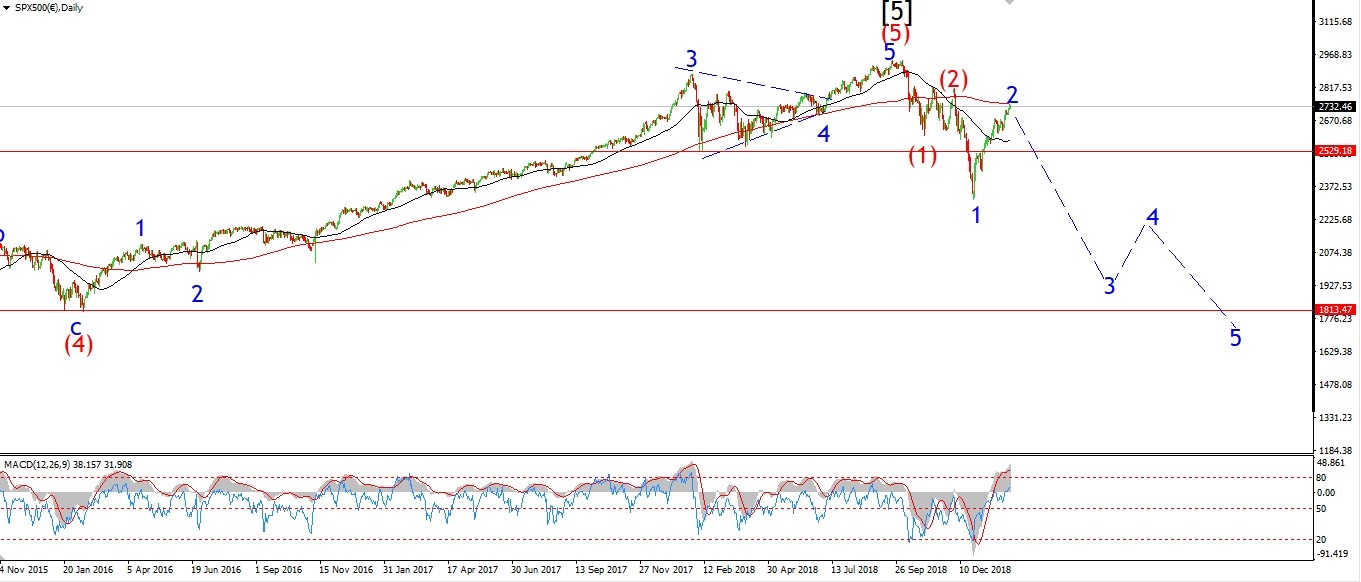 [/vc_column_text][/vc_column][/vc_row]
[vc_row][vc_column][vc_column_text]
The S&P is closer to the end of wave [c] than the DOW,
the price reached to within 8 points of the 162% wave [a] extension line at todays highs.
The line connecting the previous two highs is right at that target level,
and this should offer some resistance to the wave (v) high.
Also,
The internal structure of wave ‘v’ of (v)
looks to be a complete five wave move now.
The wave structure is stretched to its breaking point now.
I can only expect an equal and opposite recoil against this extended rally to begin now.
Tomorrow;
Watch for 2770 to offer resistance to this wave ‘v’ advance.
[/vc_column_text][/vc_column][/vc_row]
[/_s2If]
[vc_row][vc_column][vc_column_text]
[/vc_column_text][/vc_column][/vc_row]
[vc_row][vc_column][vc_separator border_width=”5″][/vc_column][/vc_row]