
[vc_row][vc_column][vc_separator border_width=”5″][/vc_column][/vc_row]
[vc_row][vc_column][vc_column_text]
Hi everyone,
heres a couple of charts to put into perspective the degree of bullishness in the stock market right now.
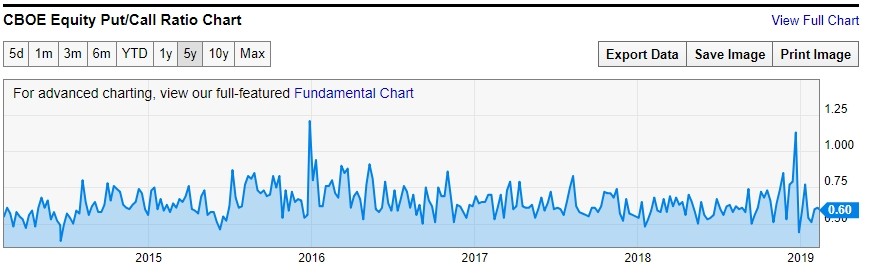
The Equity put call ratio is sitting right down at the peaceful bliss level for the last few weeks.
As far as I can see,
the recent jolt that the market experienced has been met with a nonchalant shrug of the shoulders.
Its hard to kill a 10 year bull market for sure.
But after rising for ten years, all this market knows is bullishness!
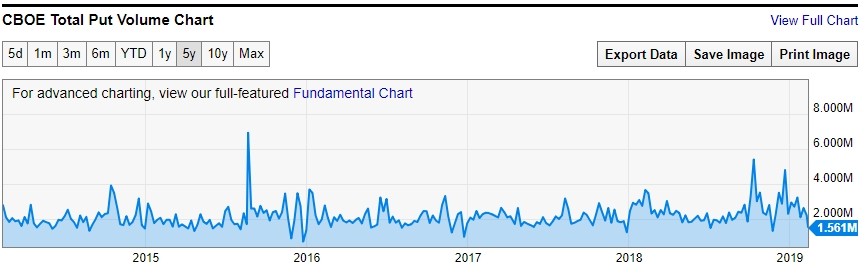
This chart shows total put volume on the CBOE.
Again the volume of put buying is at historic lows!
So there is no chance of a top any time soon according to option buyers………………………
Here we go!
[/vc_column_text][/vc_column][/vc_row]
[_s2If current_user_can(access_s2member_ccap_eurusd)]
[vc_row][vc_column][vc_separator border_width=”5″][/vc_column][/vc_row]
[vc_row][vc_column][vc_column_text]
EURUSD
[/vc_column_text][/vc_column][/vc_row]
[vc_row][vc_column][vc_separator border_width=”5″][/vc_column][/vc_row][vc_row][vc_column width=”2/3″][vc_custom_heading text=”1 hr” use_theme_fonts=”yes”][vc_column_text]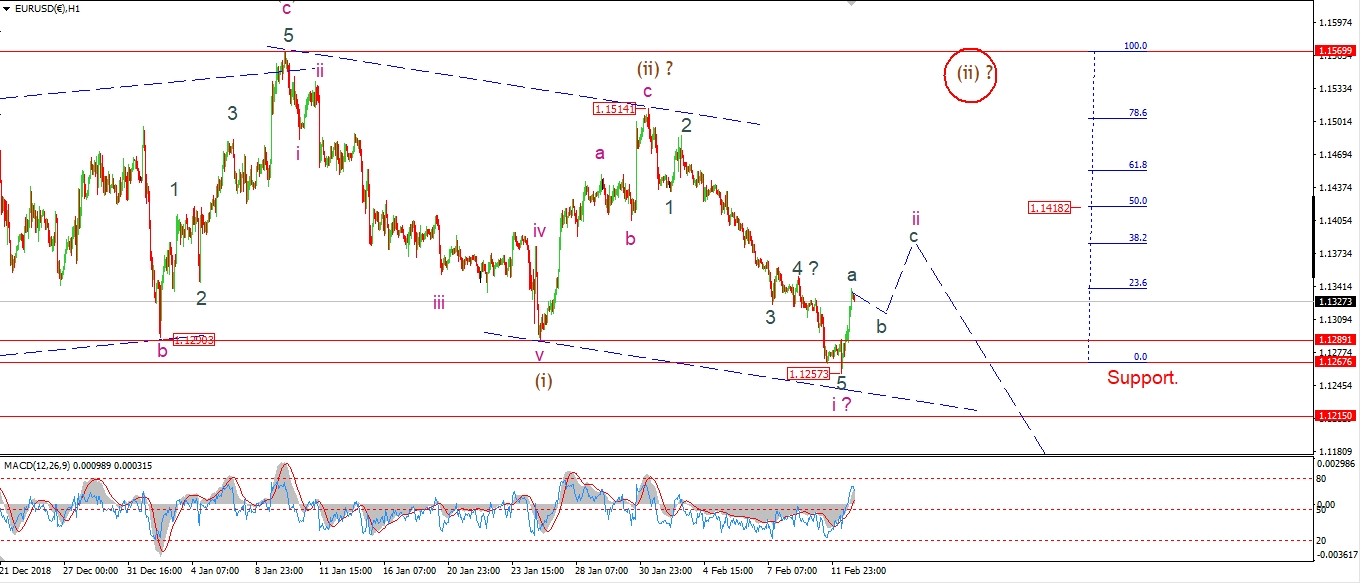 [/vc_column_text][/vc_column][vc_column width=”1/3″][vc_custom_heading text=”4 Hours” use_theme_fonts=”yes”][vc_column_text]
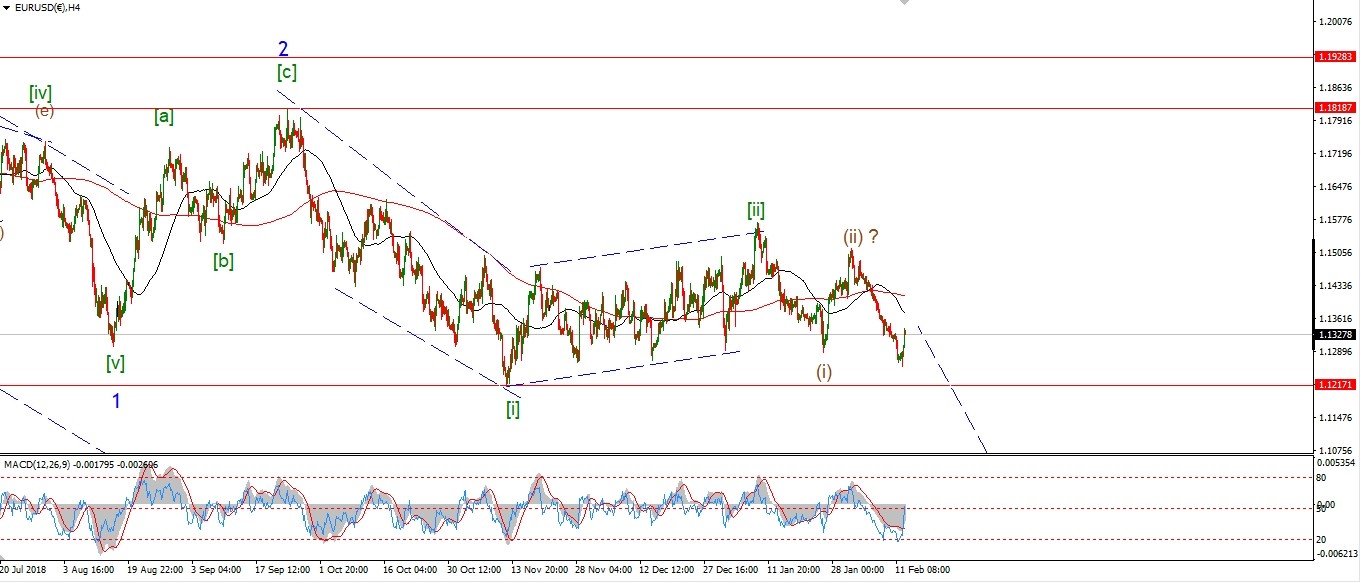 [/vc_column_text][vc_custom_heading text=”Daily” use_theme_fonts=”yes”][vc_column_text]
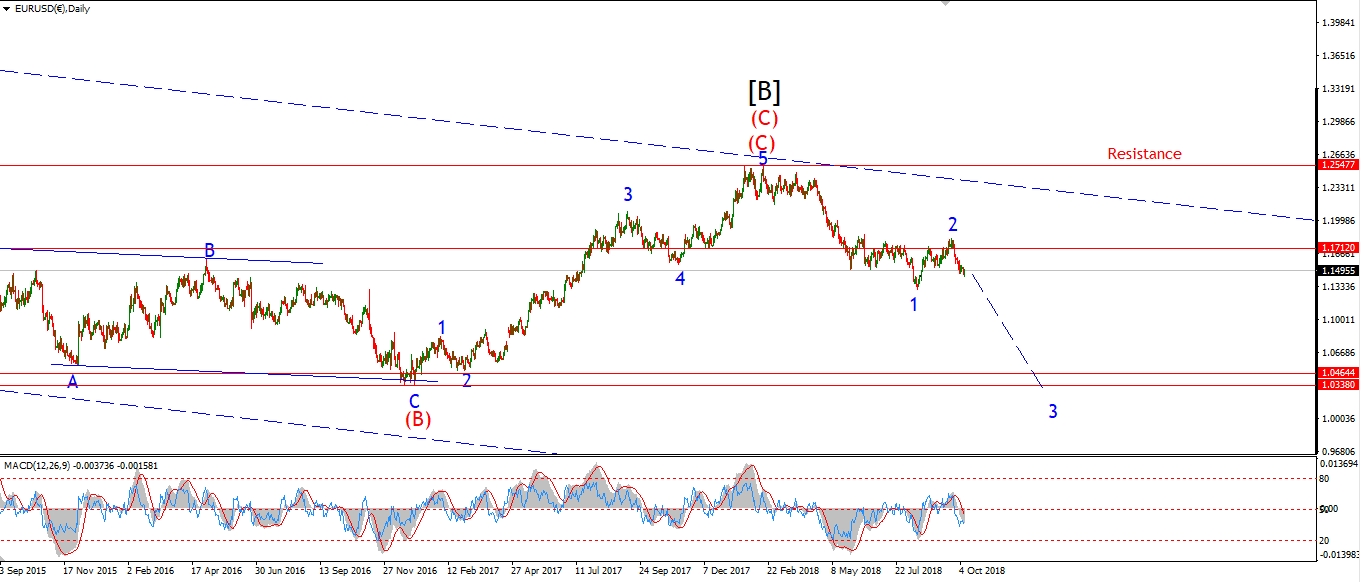 [/vc_column_text][/vc_column][/vc_row]
[vc_row][vc_column][vc_column_text]
EURUSD bounced back into life after breaking support at 1.1267 today.
The price range we are in right now has been tested five times over the course of this correction.
Todays break of 1.1267 takes out the previous wave (b) low.
This has kicked out another leg from under the stool so to say!
The rally today is labelled wave ‘a’ of ‘ii’.
the form of the rally looks to be in 5 waves,
So we are likely looking at a 5,3,5 zigzag correction.
Tomorrow;
Wave ‘b’ should come in tomorrow and fall in three waves to a higher low above 1.1257.
And wave ‘c’ should reach the area of the 50% retracement level at 1.1418.
[/vc_column_text][/vc_column][/vc_row]
[/_s2If]
[_s2If current_user_can(access_s2member_ccap_gbpusd)]
[vc_row][vc_column][vc_separator border_width=”5″][/vc_column][/vc_row][vc_row][vc_column][vc_column_text]
GBPUSD
[/vc_column_text][/vc_column][/vc_row][vc_row][vc_column][vc_separator border_width=”5″][/vc_column][/vc_row][vc_row][vc_column width=”2/3″][vc_custom_heading text=”1 hr” use_theme_fonts=”yes”][vc_column_text]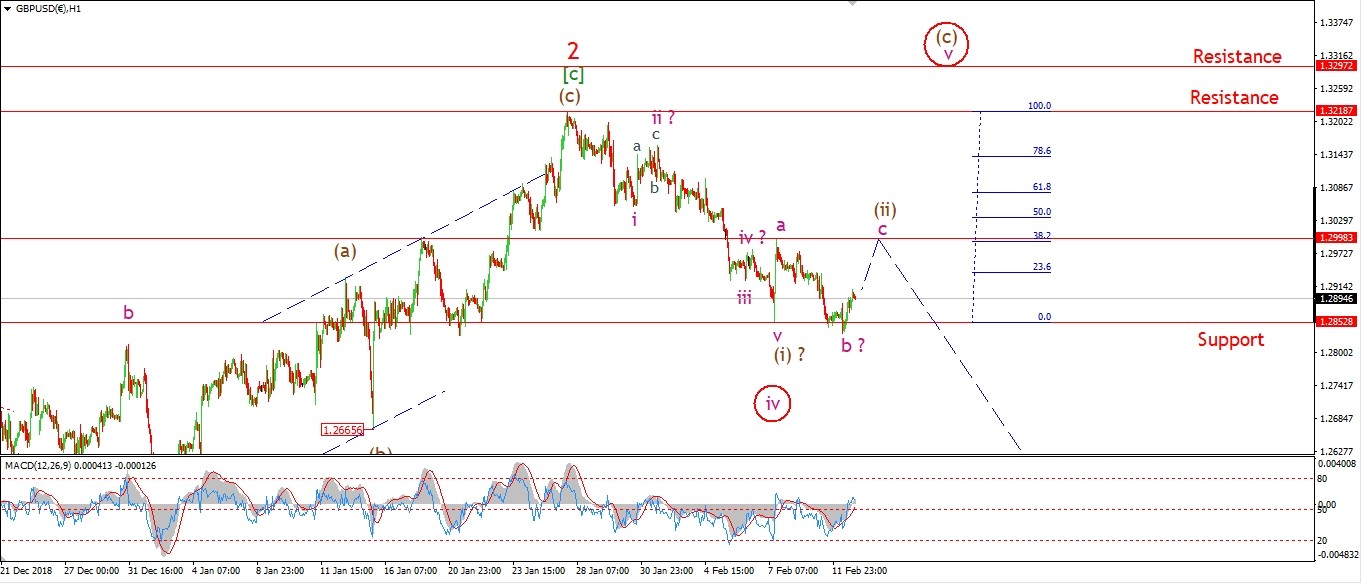 [/vc_column_text][/vc_column][vc_column width=”1/3″][vc_custom_heading text=”4 Hours” use_theme_fonts=”yes”][vc_column_text]
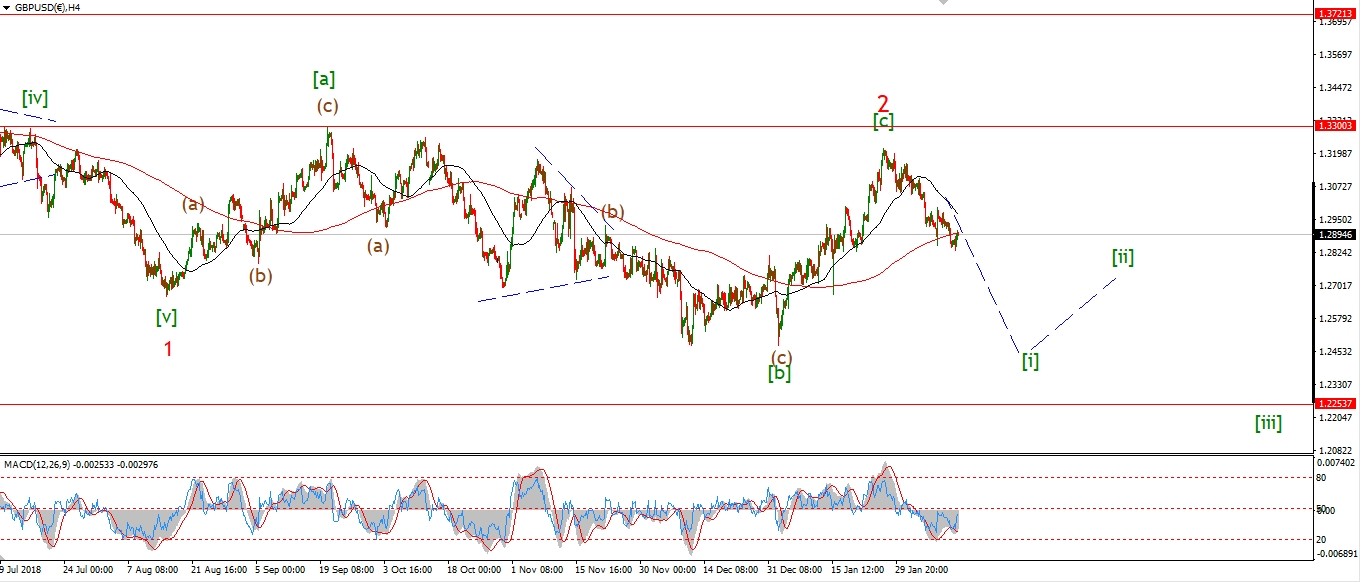 [/vc_column_text][vc_custom_heading text=”Daily” use_theme_fonts=”yes”][vc_column_text]
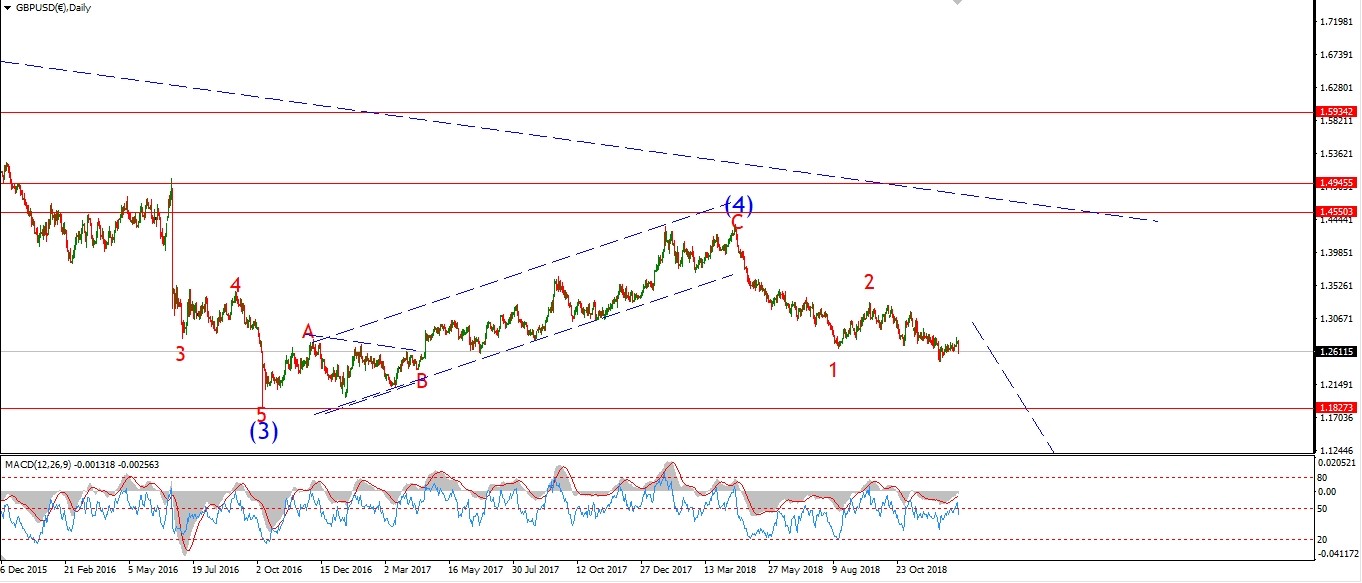 [/vc_column_text][/vc_column][/vc_row]
[vc_row][vc_column][vc_column_text]
Cable has risen off the lows of the day which did break support again.
I have labelled this decline as wave ‘b’ of (ii).
although the drop off the wave ‘a’ high can be viewed as a five wave structure.
so this has added a little doubt to the current short term count.
It may even mean that wave (iii) down has already begun.
I will wait for the action tomorrow to make a call on that idea.
Tomorrow;
Watch for wave ‘c’ of (ii) to continue higher into the wave ‘a’ high at 1.2998.
[/vc_column_text][/vc_column][/vc_row]
[/_s2If]
[_s2If current_user_can(access_s2member_ccap_usdjpy)]
[vc_row][vc_column][vc_separator border_width=”5″][/vc_column][/vc_row][vc_row][vc_column][vc_column_text]
USDJPY
[/vc_column_text][/vc_column][/vc_row][vc_row][vc_column][vc_separator border_width=”5″][/vc_column][/vc_row][vc_row][vc_column width=”2/3″][vc_custom_heading text=”1 hr” use_theme_fonts=”yes”][vc_column_text]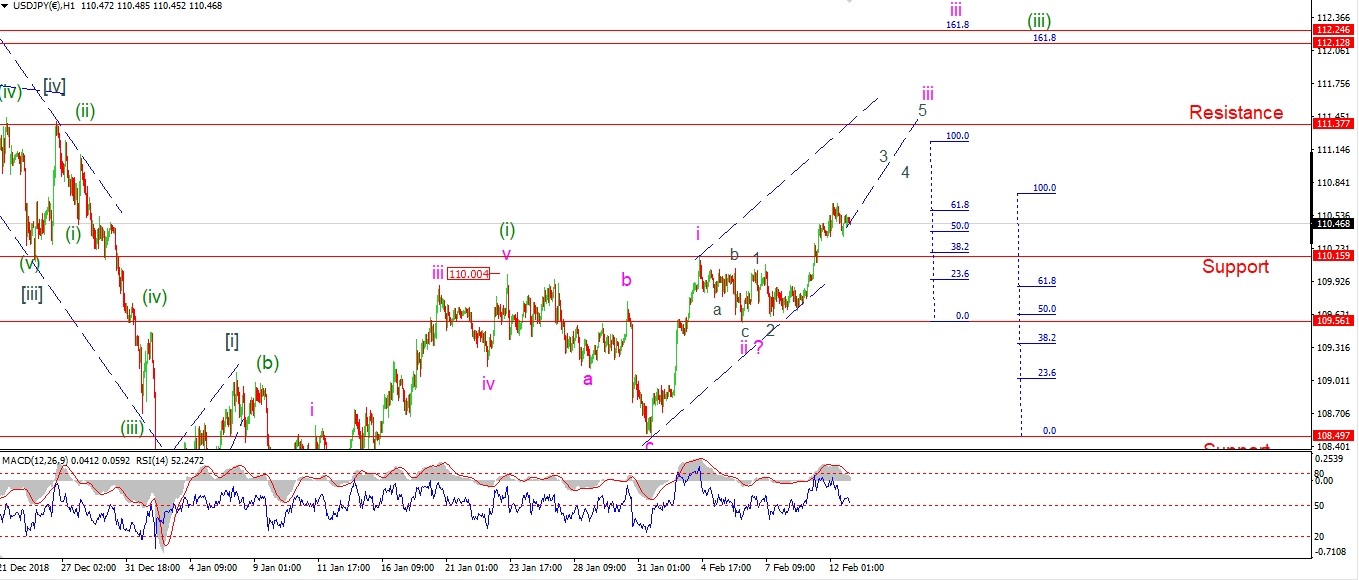 [/vc_column_text][/vc_column][vc_column width=”1/3″][vc_custom_heading text=”4 Hours” use_theme_fonts=”yes”][vc_column_text]
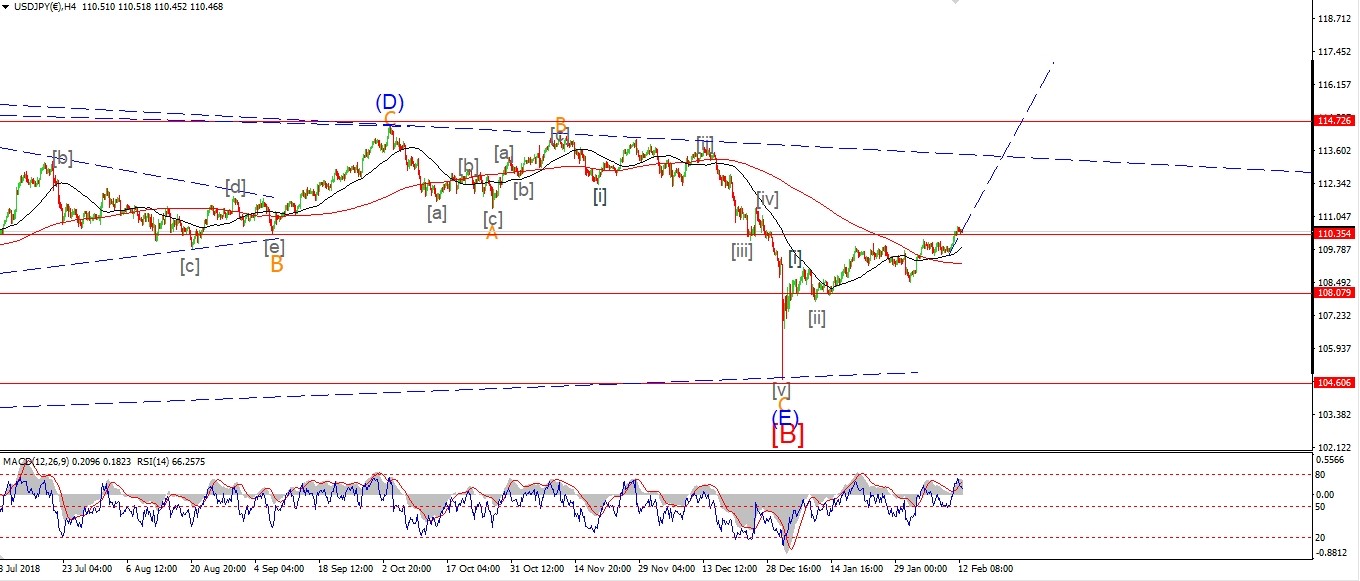 [/vc_column_text][vc_custom_heading text=”Daily” use_theme_fonts=”yes”][vc_column_text]
 [/vc_column_text][/vc_column][/vc_row]
[vc_row][vc_column][vc_column_text]
USDJPY has stalled today within wave ‘3’ of ‘iii’ higher.
This could be an internal fourth wave correction within that wave ‘3’.
If that is the case,
I would like to see that recent high at 110.15 continue to support the price for now.
and for wave ‘3’ to continue higher.
The 162% Fibonacci extension shown for wave ‘iii’ lies at 112.24.
This is a long shot, but still possible none the less.
Tomorrow;
Watch for wave ‘3’ to hold above 110.15.
[/vc_column_text][/vc_column][/vc_row]
[/_s2If]
[_s2If current_user_can(access_s2member_ccap_dow_jones)]
[vc_row][vc_column][vc_separator border_width=”5″][/vc_column][/vc_row][vc_row][vc_column][vc_column_text]
DOW JONES INDUSTRIALS
[/vc_column_text][/vc_column][/vc_row][vc_row][vc_column][vc_separator border_width=”5″][/vc_column][/vc_row][vc_row][vc_column width=”2/3″][vc_custom_heading text=”1 hr” use_theme_fonts=”yes”][vc_column_text]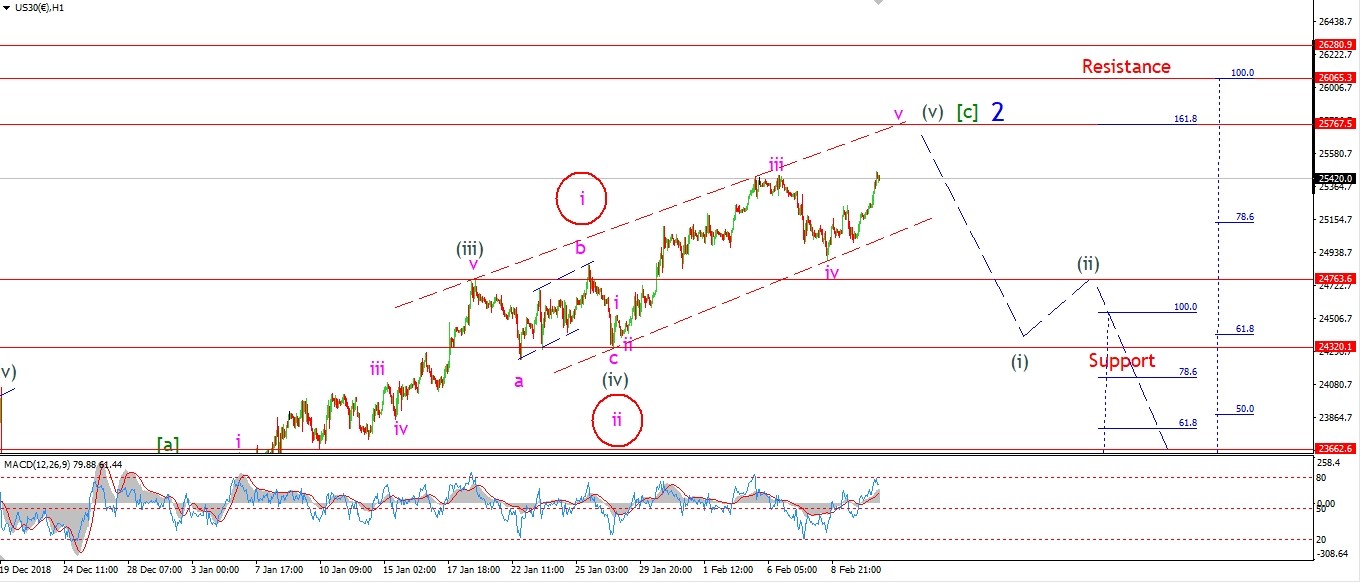 [/vc_column_text][/vc_column][vc_column width=”1/3″][vc_custom_heading text=”4 Hours” use_theme_fonts=”yes”][vc_column_text]
 [/vc_column_text][vc_custom_heading text=”Daily” use_theme_fonts=”yes”][vc_column_text]
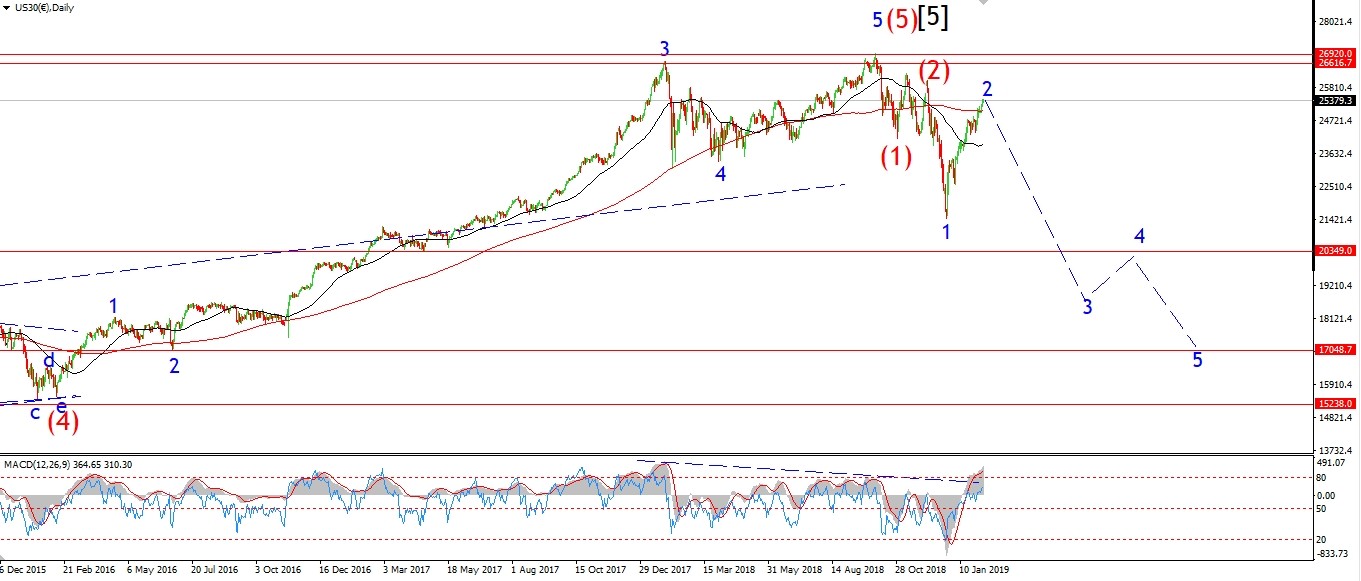 [/vc_column_text][/vc_column][/vc_row]
[vc_row][vc_column][vc_column_text]
Easy come easy go!
This market has been a lesson in patience this last month,
that is for dang sure!
Todays new high opens up another possibility for wave [c] and wave (v) of [c].
A common relationship between wave [a] and [c] in a correction is for wave [c] to reach 162% of wave [a].
That level is shown at 25767.
This now forms our last best hope for a top in wave [c] of ‘2’.
I have shown an alternate count for wave (v) grey also,
this involves a possible ending diagonal formation.
Todays new high has fulfilled the minimum target for wave ‘v’ of (v).
Lets see how plays out tomorrow.
The market seems hell bent on paying higher prices for stocks.
So much so that that put volume has collapsed to match the levels of the all time highs in the market last October,
According to futures traders,
there is little to no risk in equities right now.
How did that work out the last time?
[/vc_column_text][/vc_column][/vc_row]
[/_s2If]
[_s2If current_user_can(access_s2member_ccap_gold)]
[vc_row][vc_column][vc_separator border_width=”5″][/vc_column][/vc_row][vc_row][vc_column][vc_column_text]
GOLD
[/vc_column_text][/vc_column][/vc_row][vc_row][vc_column][vc_separator border_width=”5″][/vc_column][/vc_row][vc_row][vc_column width=”2/3″][vc_custom_heading text=”1 hr” use_theme_fonts=”yes”][vc_column_text]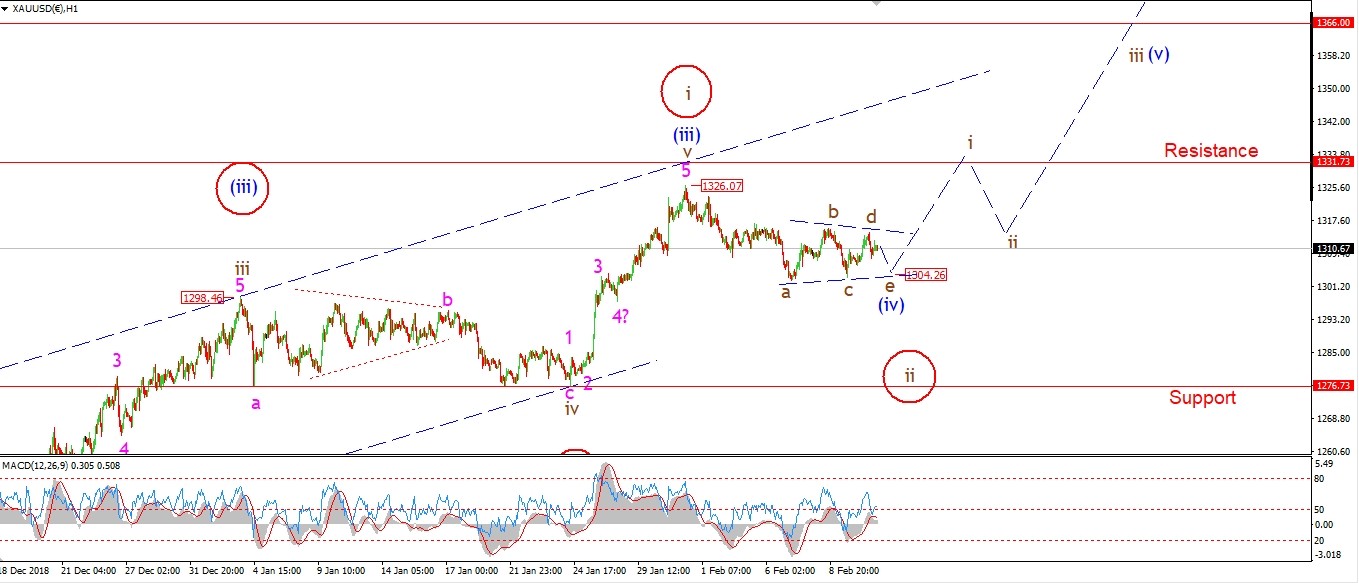 [/vc_column_text][/vc_column][vc_column width=”1/3″][vc_custom_heading text=”4 Hours” use_theme_fonts=”yes”][vc_column_text]
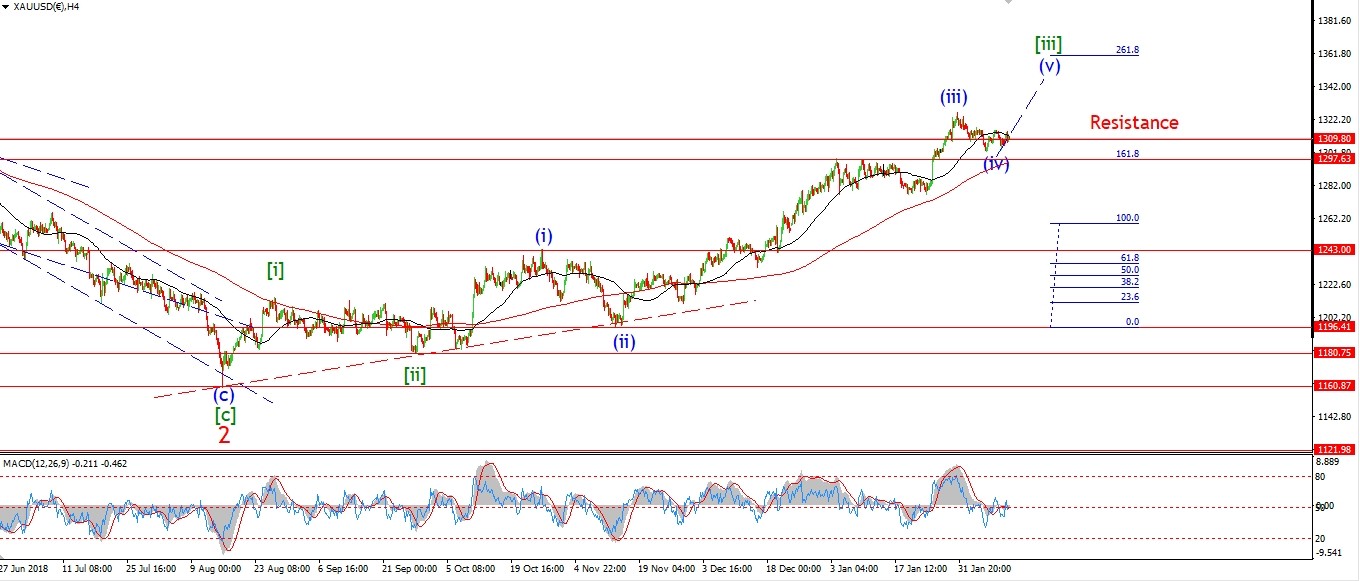 [/vc_column_text][vc_custom_heading text=”Daily” use_theme_fonts=”yes”][vc_column_text]
 [/vc_column_text][/vc_column][/vc_row]
[vc_row][vc_column][vc_column_text]
I have shown another possible interpretation for wave (iv) today.
The action continued to contract in a triangle formation.
With this in mind,
I have shown a possible triangle wave (iv) blue.
If this is correct,
then wave ‘e’ of (iv) is now nearing completion.
Wave ‘e’ must not break below the low of wave ‘c’ at 1303.
If we see a break of that low,
I will revert back to the previous idea for wave (iv).
Tomorrow;
Wave ‘e’ should hit the trend line at about 1304,
and then we should see an initial rise into wave ‘i’ of (v).
[/vc_column_text][/vc_column][/vc_row]
[/_s2If]
[_s2If current_user_can(access_s2member_ccap_crude)]
[vc_row][vc_column][vc_separator border_width=”5″][/vc_column][/vc_row][vc_row][vc_column][vc_column_text]
U.S CRUDE OIL
[/vc_column_text][/vc_column][/vc_row][vc_row][vc_column][vc_separator border_width=”5″][/vc_column][/vc_row][vc_row][vc_column width=”2/3″][vc_custom_heading text=”1 hr” use_theme_fonts=”yes”][vc_column_text]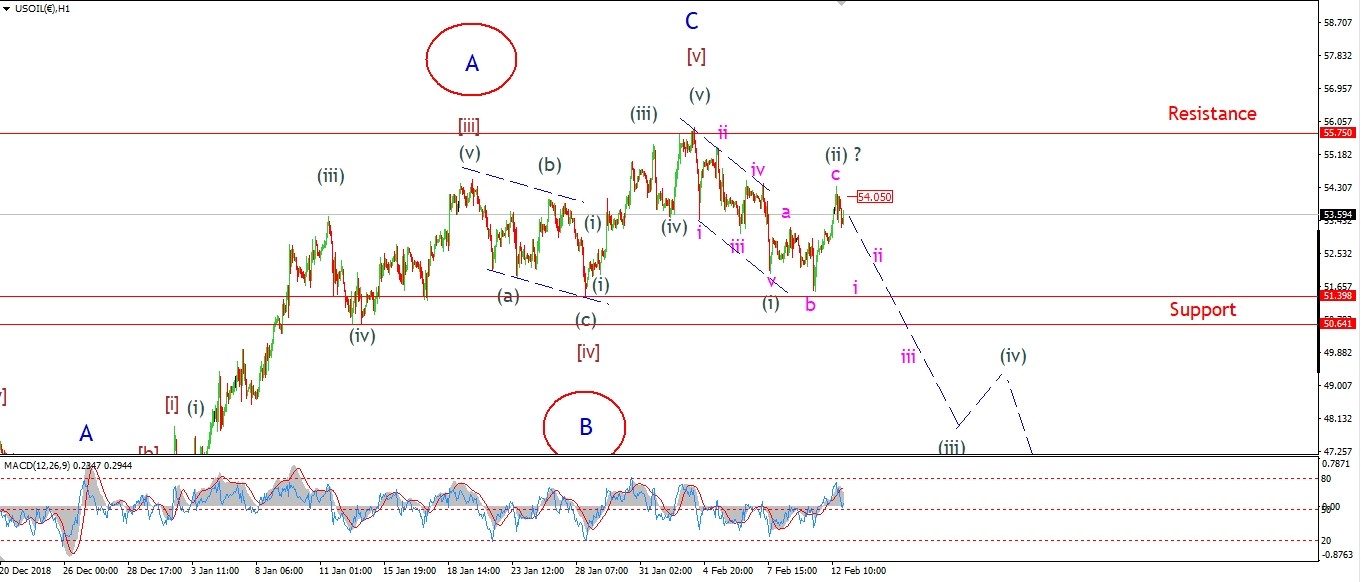 [/vc_column_text][/vc_column][vc_column width=”1/3″][vc_custom_heading text=”4 Hours” use_theme_fonts=”yes”][vc_column_text]
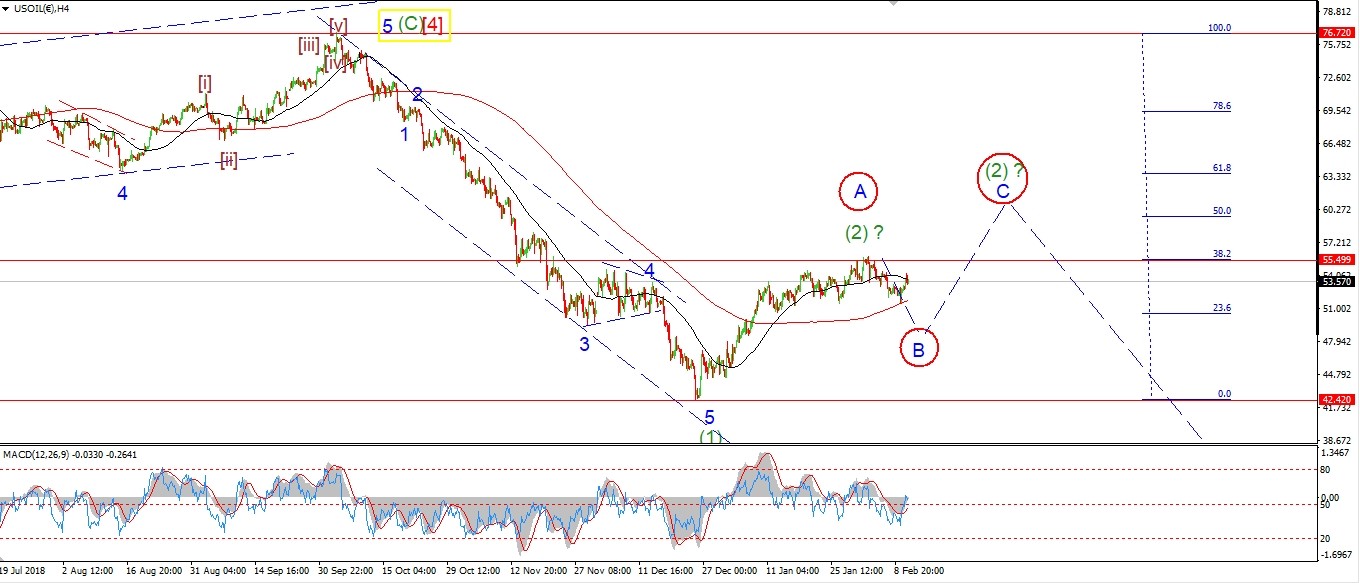 [/vc_column_text][vc_custom_heading text=”Daily” use_theme_fonts=”yes”][vc_column_text]
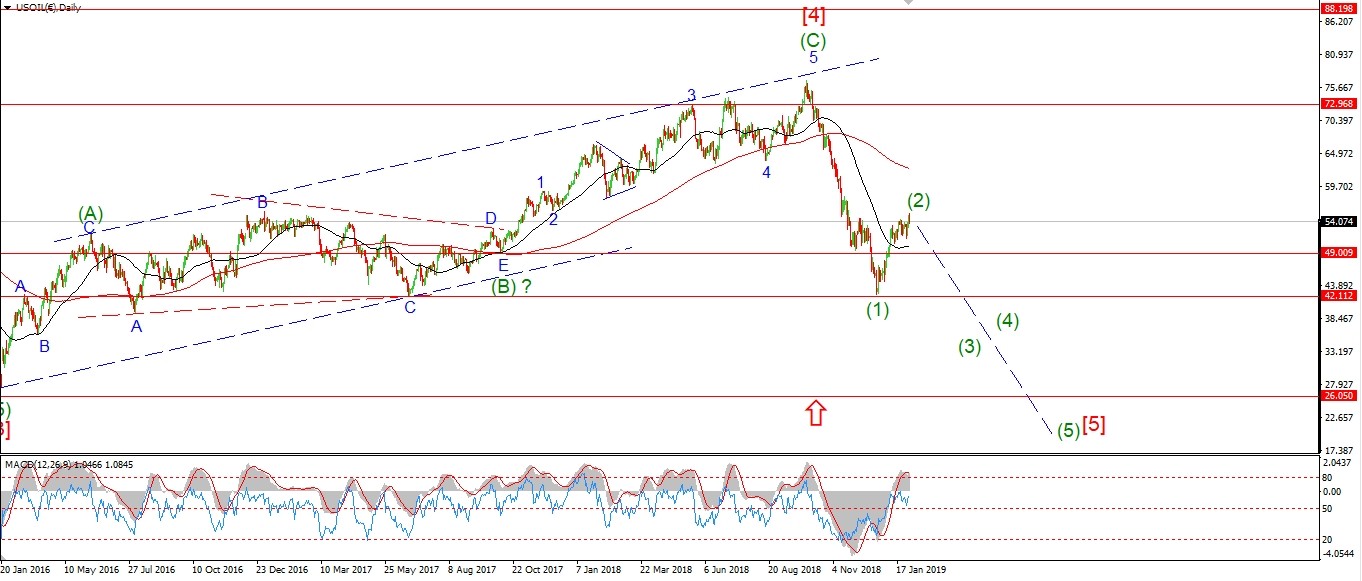 [/vc_column_text][/vc_column][/vc_row]
[vc_row][vc_column][vc_column_text]
Crude rallied strongly today in wave ‘c’ of (ii).
This action has completed an expanded flat for wave (ii),
and now we must see a return lower in wave (iii) which will be confirmed with a break of 51.40 again.
The price is off the highs again this evening,
this could be the beginning of wave ‘i’ of (iii).
If so,
Then todays high at 54.05 must hold.
Tomorrow;
It is a fairly unorthodox wave pattern off the recent highs,
but if it plays out like I think it could,
then wave (iii) down should come in quickly and carry us back below 50.00 again.
Watch for 54.05 to hold tomorrow.
[/vc_column_text][/vc_column][/vc_row]
[/_s2If]
[_s2If current_user_can(access_s2member_ccap_us10yr)]
[vc_row][vc_column][vc_separator border_width=”5″][/vc_column][/vc_row][vc_row][vc_column][vc_column_text]
US 10 yr Treasuries.
[/vc_column_text][/vc_column][/vc_row][vc_row][vc_column][vc_separator border_width=”5″][/vc_column][/vc_row][vc_row][vc_column width=”2/3″][vc_custom_heading text=”1 hr” use_theme_fonts=”yes”][vc_column_text]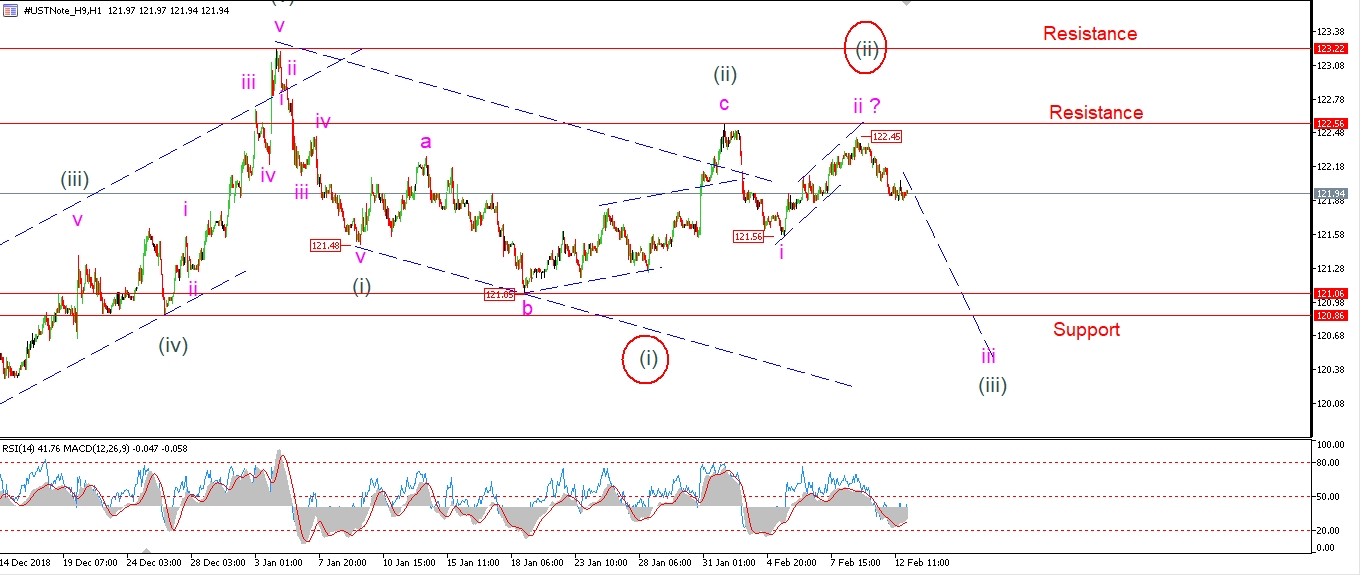 [/vc_column_text][/vc_column][vc_column width=”1/3″][vc_custom_heading text=”4 Hours” use_theme_fonts=”yes”][vc_column_text]
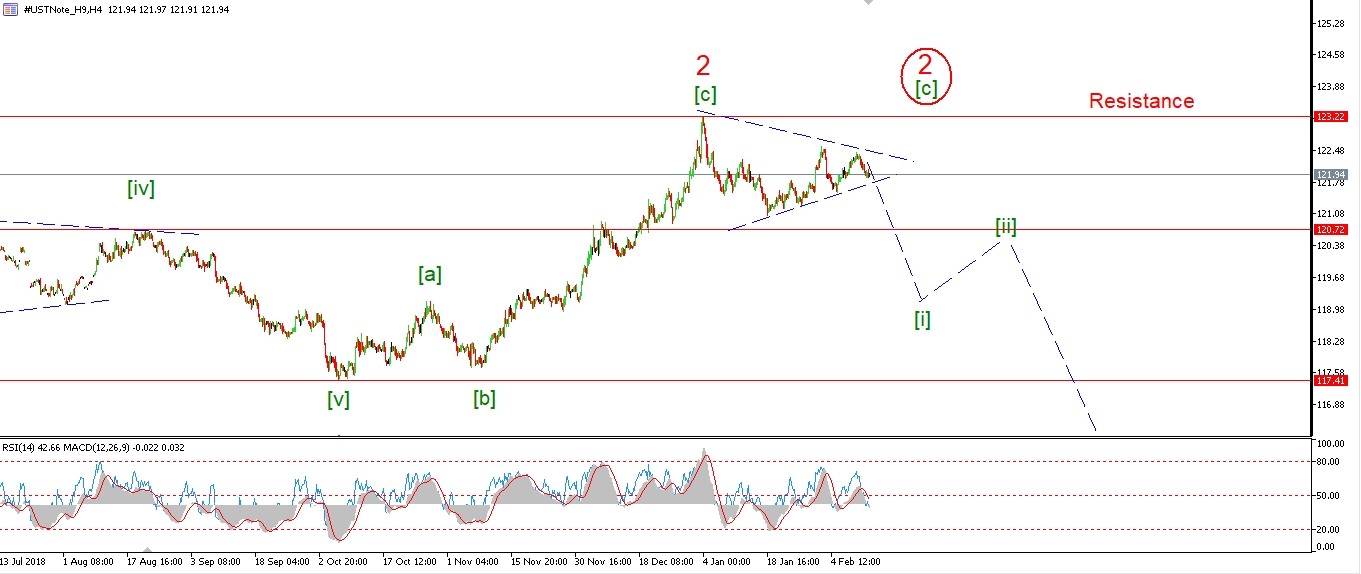 [/vc_column_text][vc_custom_heading text=”Daily” use_theme_fonts=”yes”][vc_column_text]
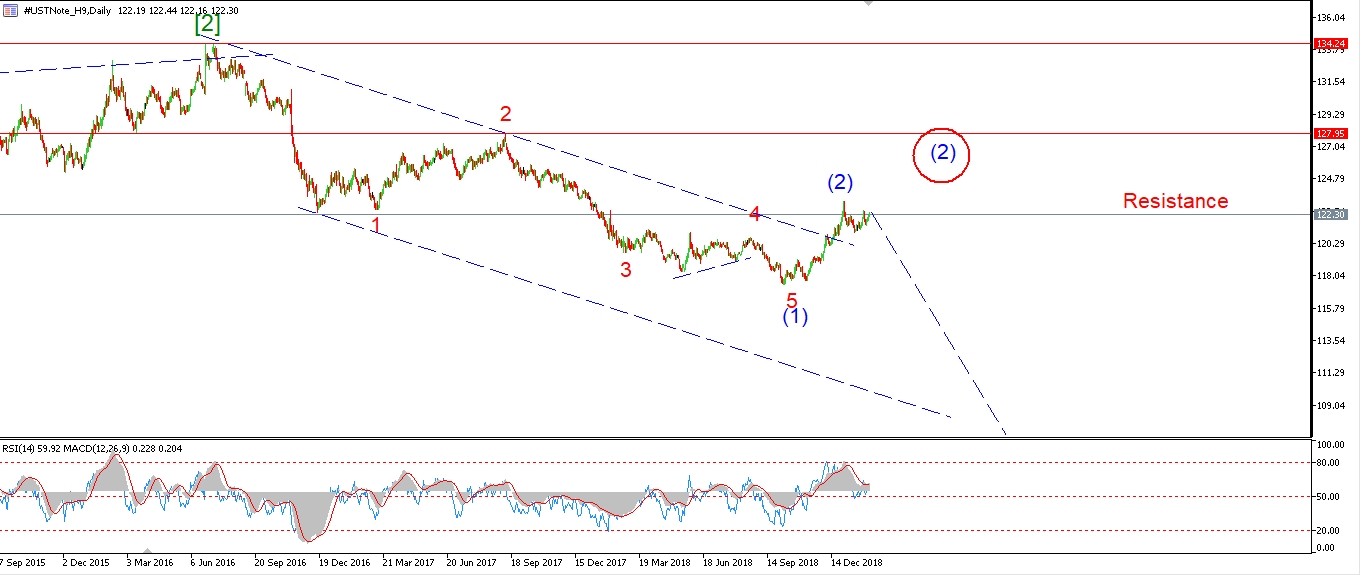 [/vc_column_text][/vc_column][/vc_row]
[vc_row][vc_column][vc_column_text]
Treasuries are drifting lower off the 122.45 high labelled wave ‘ii’.
I am looking for a larger decline to follow in wave ‘iii’ of (iii).
If the market does not accelerate lower this week,
then I will have to rethink the short term count.
The alternate shown on the 4hr chart is showing a possible triangle wave (iv).
If the price breaks below 121.56 again,
that should rule out the triangle idea.
Tomorrow;
watch for wave ‘iii’ to continue lower and break 121.56.
[/vc_column_text][/vc_column][/vc_row]
[/_s2If]
[_s2If current_user_can(access_s2member_ccap_silver)]
[vc_row][vc_column][vc_separator border_width=”5″][/vc_column][/vc_row][vc_row][vc_column][vc_column_text]
SILVER
[/vc_column_text][/vc_column][/vc_row][vc_row][vc_column][vc_separator border_width=”5″][/vc_column][/vc_row][vc_row][vc_column width=”2/3″][vc_custom_heading text=”1 hr” use_theme_fonts=”yes”][vc_column_text]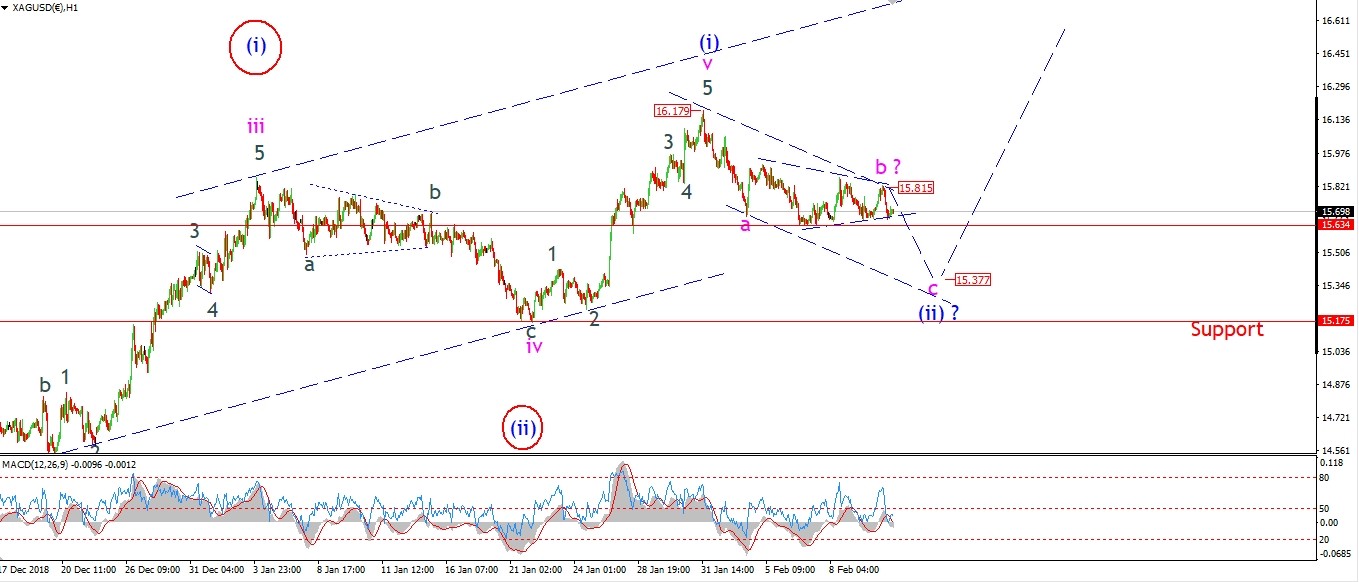 [/vc_column_text][/vc_column][vc_column width=”1/3″][vc_custom_heading text=”4 Hours” use_theme_fonts=”yes”][vc_column_text]
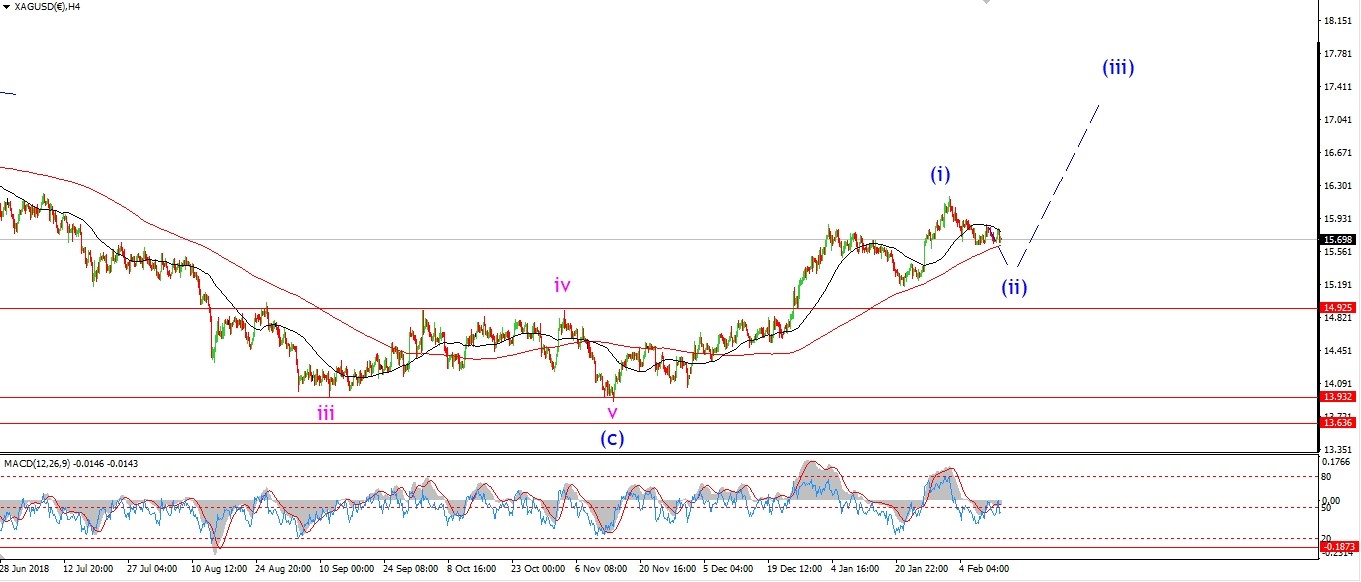 [/vc_column_text][vc_custom_heading text=”Daily” use_theme_fonts=”yes”][vc_column_text]
 [/vc_column_text][/vc_column][/vc_row]
[vc_row][vc_column][vc_column_text]
I have not altered the wave count for silver today.
The short term action is slightly different, and the wave count is different also.
Gold is correcting in wave (iv),
and silver is stuck in wave (ii).
And we should not expect to see a second wave form as a triangle as per the EW guidelines.
The price hit the 15.80 target at todays high.
This should complete wave ‘b’.
And so far the price is dropping again in wave ‘c’ of (ii).
Tomorrow;
Watch for wave ‘c’ to push below the lower bounds of that triangle at 15.63 as a minimum target.
Wave ‘c’ will reach equality with wave ‘a’ at 15.37.
[/vc_column_text][/vc_column][/vc_row]
[/_s2If]
[_s2If current_user_can(access_s2member_ccap_sp500)]
[vc_row][vc_column][vc_separator border_width=”5″][/vc_column][/vc_row][vc_row][vc_column][vc_column_text]
S&P 500.
[/vc_column_text][/vc_column][/vc_row][vc_row][vc_column][vc_separator border_width=”5″][/vc_column][/vc_row][vc_row][vc_column width=”2/3″][vc_custom_heading text=”1 hr” use_theme_fonts=”yes”][vc_column_text]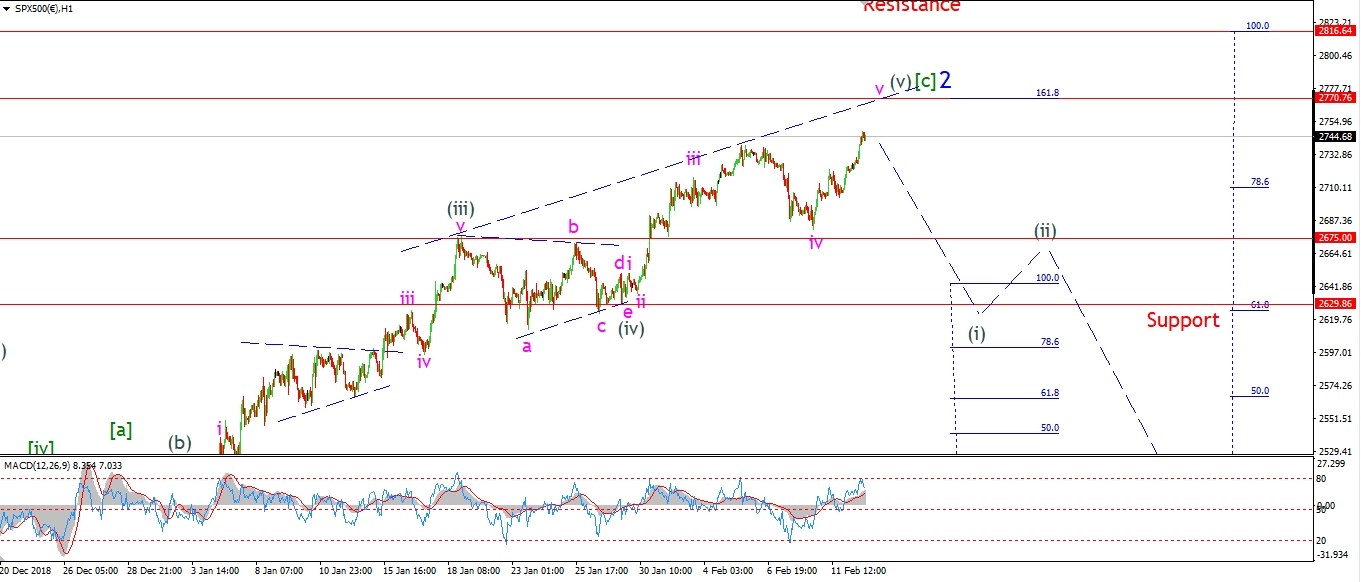 [/vc_column_text][/vc_column][vc_column width=”1/3″][vc_custom_heading text=”4 Hours” use_theme_fonts=”yes”][vc_column_text]
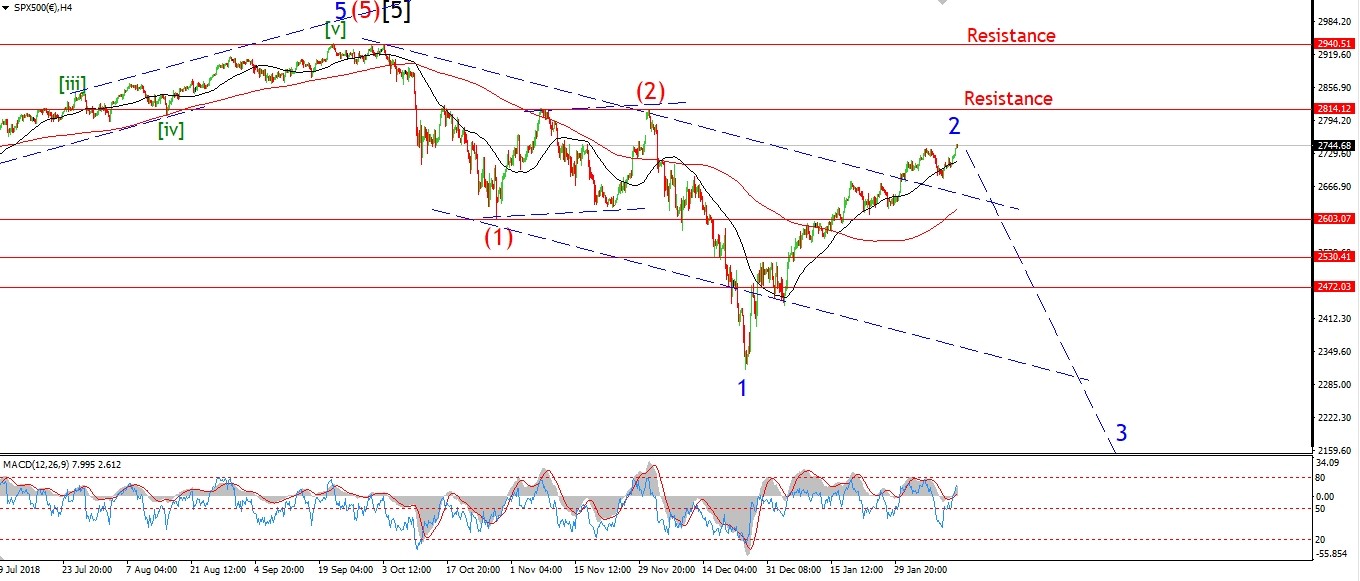 [/vc_column_text][vc_custom_heading text=”Daily” use_theme_fonts=”yes”][vc_column_text]
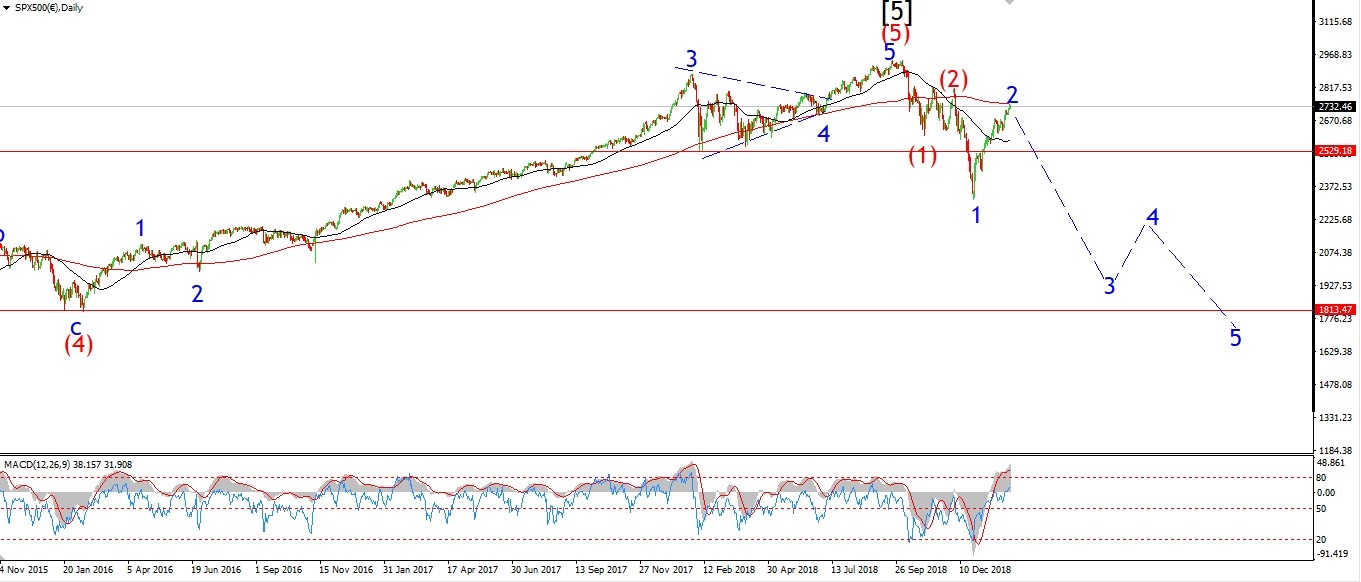 [/vc_column_text][/vc_column][/vc_row]
[vc_row][vc_column][vc_column_text]
The ending diagonal idea I showed for the DOW does not work as well in the S&P off the wave (iv) lows.
Wave (iv) fits the triangle form quite well.
So there is little point in changing that labeling.
That leaves us with wave (v) to contend with.
The recent decline seems to fit a five wave decline pretty well.
In that case it can only be a ‘c’ wave decline within an expanded flat wave ‘iv’.
The break to a new high today rules out the previous count,
and is now labelled wave ‘v’ of (v).
As with the DOW,
The next level to focus on is where wave [c] reaches 162% of wave [a].
that level lies at 2770 as shown on the chart.
Tomorrow;
Watch for a final end to this relentless rally in wave (v) grey.
2770 is the target.
[/vc_column_text][/vc_column][/vc_row]
[/_s2If]
[vc_row][vc_column][vc_column_text]
[/vc_column_text][/vc_column][/vc_row]
[vc_row][vc_column][vc_separator border_width=”5″][/vc_column][/vc_row]