
[vc_row][vc_column][vc_separator border_width=”5″][/vc_column][/vc_row]
[vc_row][vc_column][vc_column_text]
Welcome back to another pivotal week in the markets.
This one should prove interesting if the current wave setup in stocks holds true.
on that note.
Down to it.
[/vc_column_text][/vc_column][/vc_row]
[_s2If current_user_can(access_s2member_ccap_eurusd)]
[vc_row][vc_column][vc_separator border_width=”5″][/vc_column][/vc_row]
[vc_row][vc_column][vc_column_text]
EURUSD
[/vc_column_text][/vc_column][/vc_row]
[vc_row][vc_column][vc_separator border_width=”5″][/vc_column][/vc_row][vc_row][vc_column width=”2/3″][vc_custom_heading text=”1 hr” use_theme_fonts=”yes”][vc_column_text]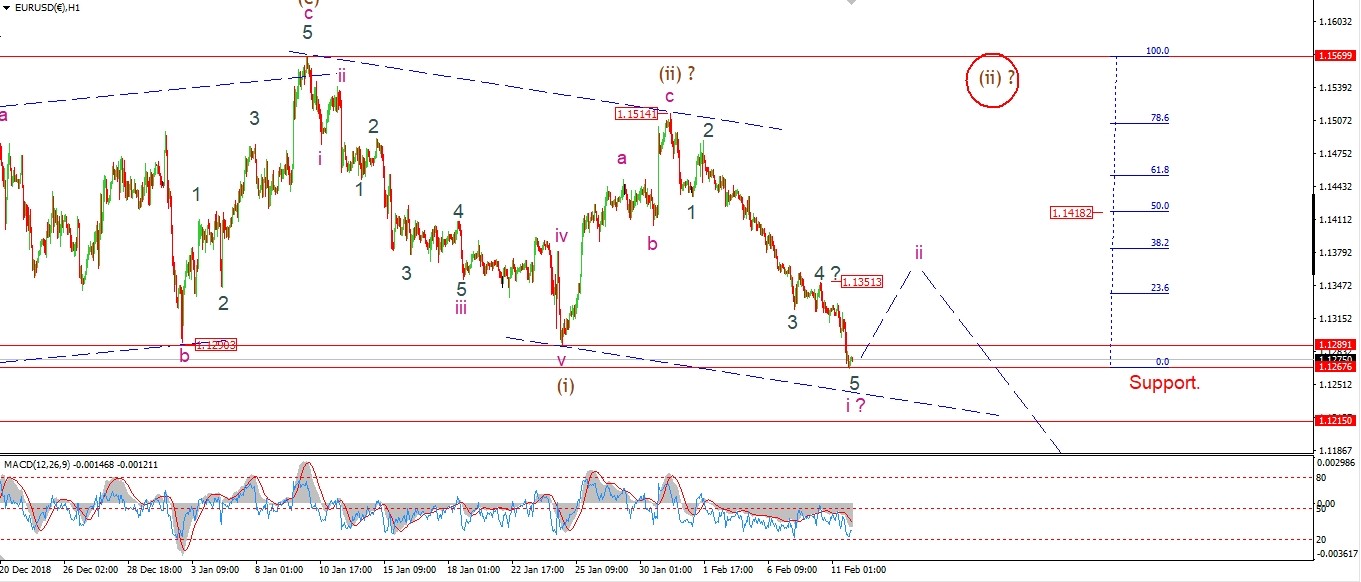 [/vc_column_text][/vc_column][vc_column width=”1/3″][vc_custom_heading text=”4 Hours” use_theme_fonts=”yes”][vc_column_text]
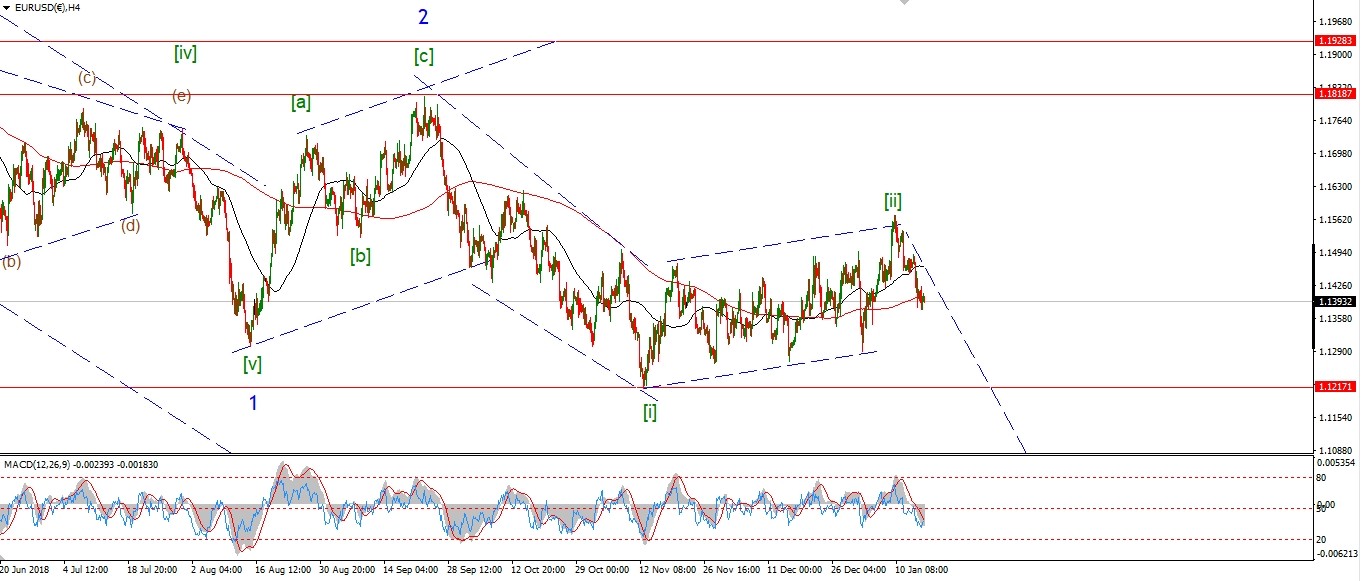 [/vc_column_text][vc_custom_heading text=”Daily” use_theme_fonts=”yes”][vc_column_text]
 [/vc_column_text][/vc_column][/vc_row]
[vc_row][vc_column][vc_column_text]
Its been a bad few weeks for the EURO.
The price is now back down at support again.
the lows today broke through that double bottom at 1.1289.
The next support at 1.1267 is holding the decline for now.
This may be enough to end wave ‘i’ down.
If we see a push back above 1.1350 again that will signal wave ‘ii’ has begun.
Tomorrow;
It is not clear yet if wave ‘5’ of ‘i’ is even complete.
1.1215 should offer support,
but a break of 1.1215 will confirm the new down trend has begun.
Watch for wave ‘i’ to complete and wave ‘ii’ to create a three wave recovery above 1.1350.
[/vc_column_text][/vc_column][/vc_row]
[/_s2If]
[_s2If current_user_can(access_s2member_ccap_gbpusd)]
[vc_row][vc_column][vc_separator border_width=”5″][/vc_column][/vc_row][vc_row][vc_column][vc_column_text]
GBPUSD
[/vc_column_text][/vc_column][/vc_row][vc_row][vc_column][vc_separator border_width=”5″][/vc_column][/vc_row][vc_row][vc_column width=”2/3″][vc_custom_heading text=”1 hr” use_theme_fonts=”yes”][vc_column_text]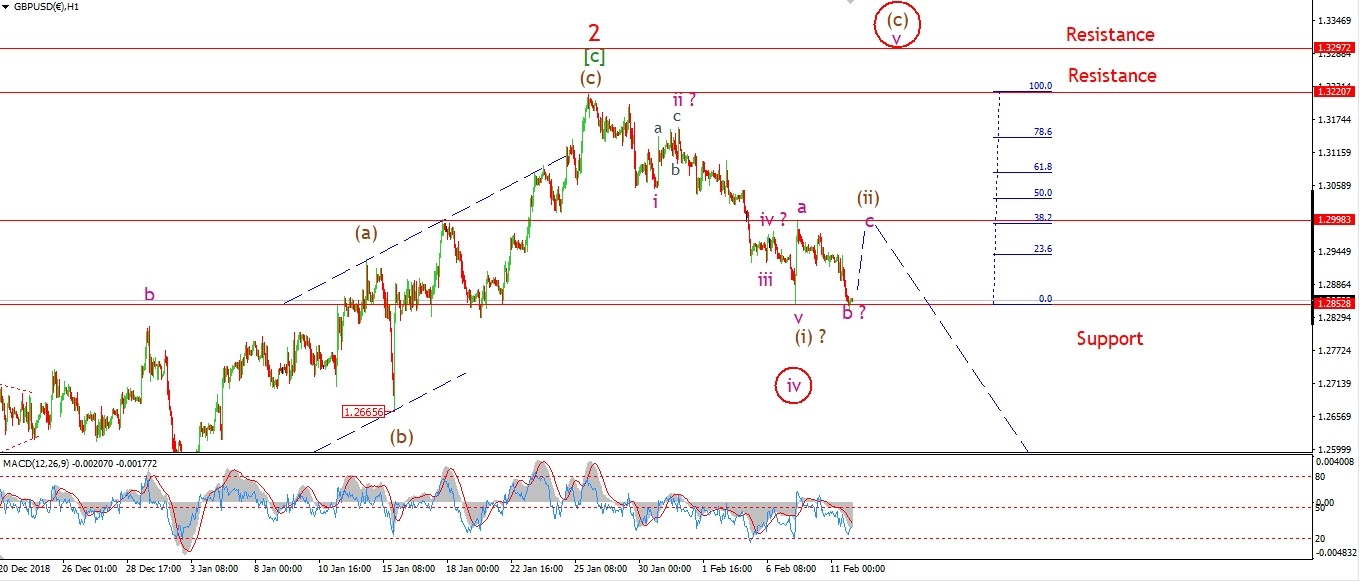 [/vc_column_text][/vc_column][vc_column width=”1/3″][vc_custom_heading text=”4 Hours” use_theme_fonts=”yes”][vc_column_text]
 [/vc_column_text][vc_custom_heading text=”Daily” use_theme_fonts=”yes”][vc_column_text]
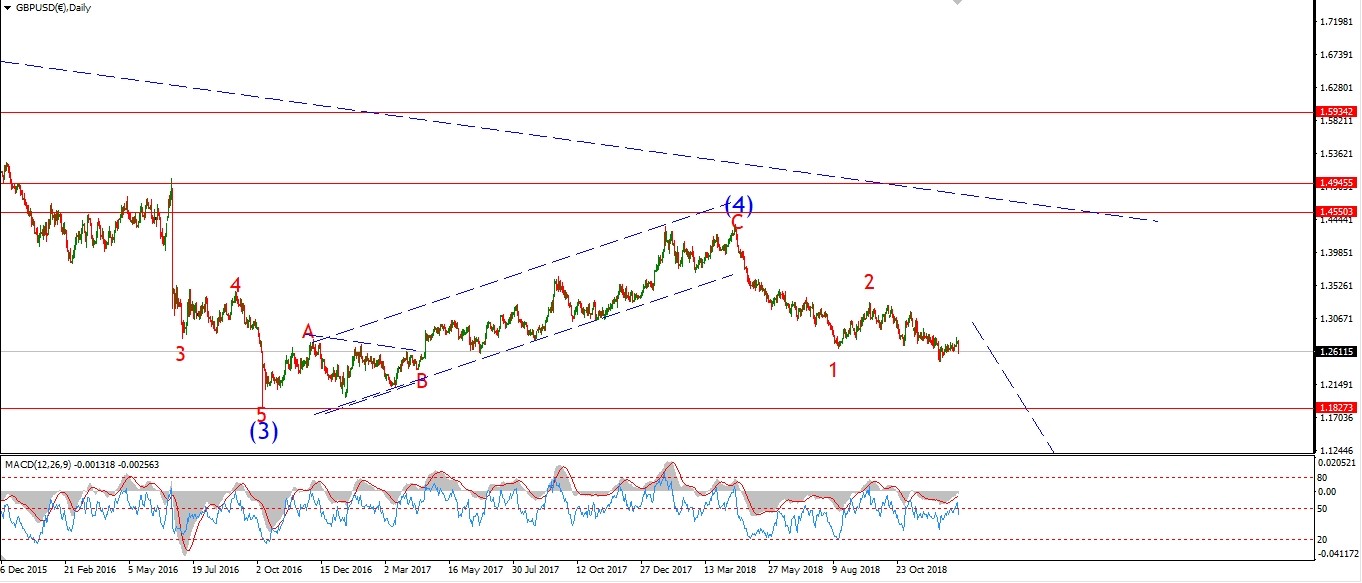 [/vc_column_text][/vc_column][/vc_row]
[vc_row][vc_column][vc_column_text]
Cable seems to be still correcting within wave (ii) brown.
The drop off the wave ‘a’ high is more likely a three wave structure,
therefore it is still viewed as wave ‘b’ of (ii).
Wave ‘c’ should break the wave ‘a’ high again at 1.2998 to complete an expanded flat wave (ii).
And then wave (iii) will be set to carry prices lower again.
Tomorrow;
Watch for a possible rally in wave ‘c’ of (ii) into 1.3000 to complete the correction.
A break of 1.2665 will confirm wave (iii) down.
[/vc_column_text][/vc_column][/vc_row]
[/_s2If]
[_s2If current_user_can(access_s2member_ccap_usdjpy)]
[vc_row][vc_column][vc_separator border_width=”5″][/vc_column][/vc_row][vc_row][vc_column][vc_column_text]
USDJPY
[/vc_column_text][/vc_column][/vc_row][vc_row][vc_column][vc_separator border_width=”5″][/vc_column][/vc_row][vc_row][vc_column width=”2/3″][vc_custom_heading text=”1 hr” use_theme_fonts=”yes”][vc_column_text]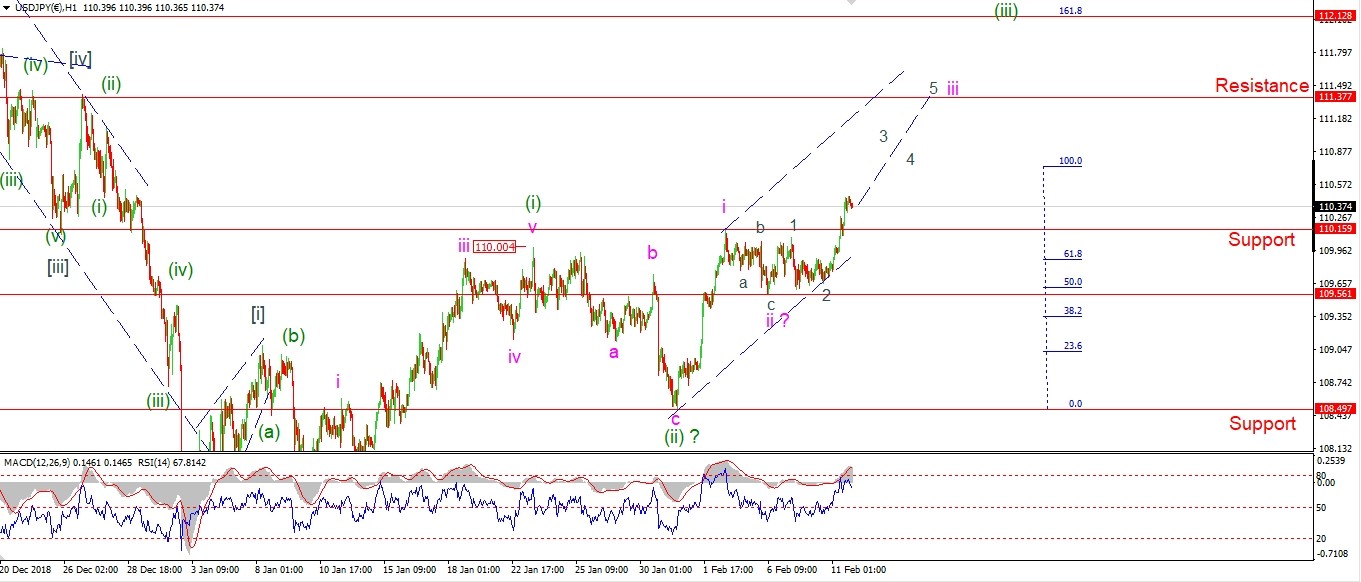 [/vc_column_text][/vc_column][vc_column width=”1/3″][vc_custom_heading text=”4 Hours” use_theme_fonts=”yes”][vc_column_text]
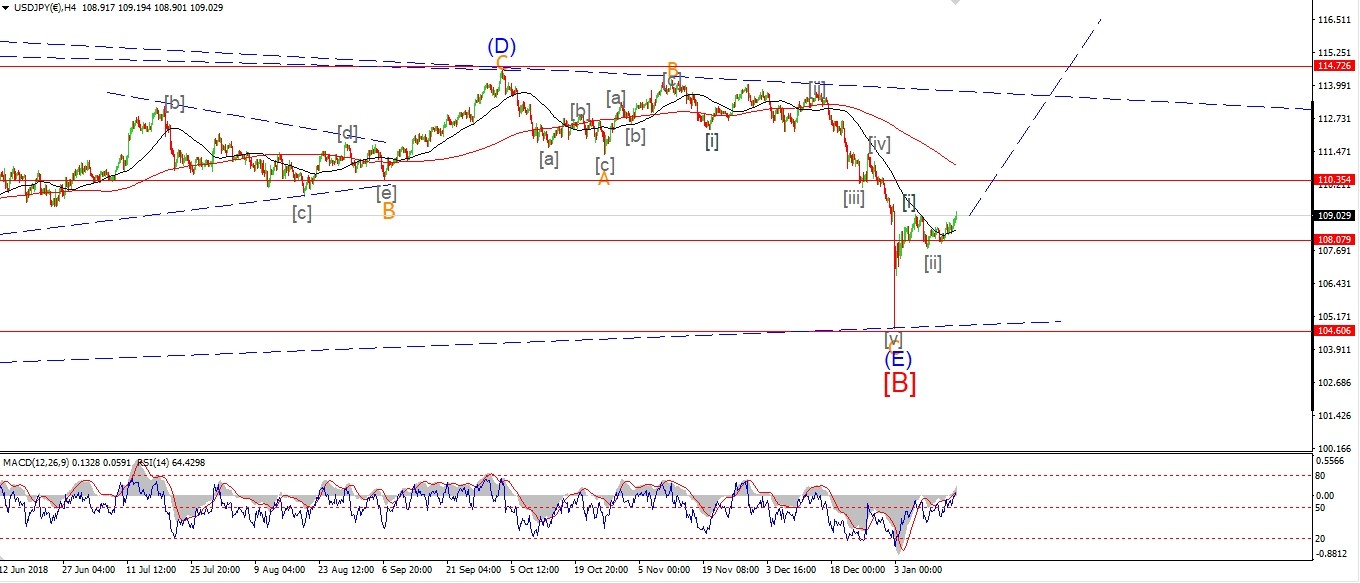 [/vc_column_text][vc_custom_heading text=”Daily” use_theme_fonts=”yes”][vc_column_text]
 [/vc_column_text][/vc_column][/vc_row]
[vc_row][vc_column][vc_column_text]
USDJPY broke above the wave ‘i’ high at 110.15 today
which rules out of the idea of a complex wave ‘ii’ as per Fridays charts.
Wave ‘iii’ up is now underway so long as that 110.15 high at wave ‘i’ holds.
If the current count is correct,
then the price is now rising in wave ‘iii’ of (iii) of [iii].
The initial target for wave (iii) green lies at 112.12.
Where wave (iii) reaches 161.8% of wave (i).
Tomorrow;
Watch for 110.15 to hold and wave ‘iii’ to continue higher.
[/vc_column_text][/vc_column][/vc_row]
[/_s2If]
[_s2If current_user_can(access_s2member_ccap_dow_jones)]
[vc_row][vc_column][vc_separator border_width=”5″][/vc_column][/vc_row][vc_row][vc_column][vc_column_text]
DOW JONES INDUSTRIALS
[/vc_column_text][/vc_column][/vc_row][vc_row][vc_column][vc_separator border_width=”5″][/vc_column][/vc_row][vc_row][vc_column width=”2/3″][vc_custom_heading text=”1 hr” use_theme_fonts=”yes”][vc_column_text] [/vc_column_text][/vc_column][vc_column width=”1/3″][vc_custom_heading text=”4 Hours” use_theme_fonts=”yes”][vc_column_text]
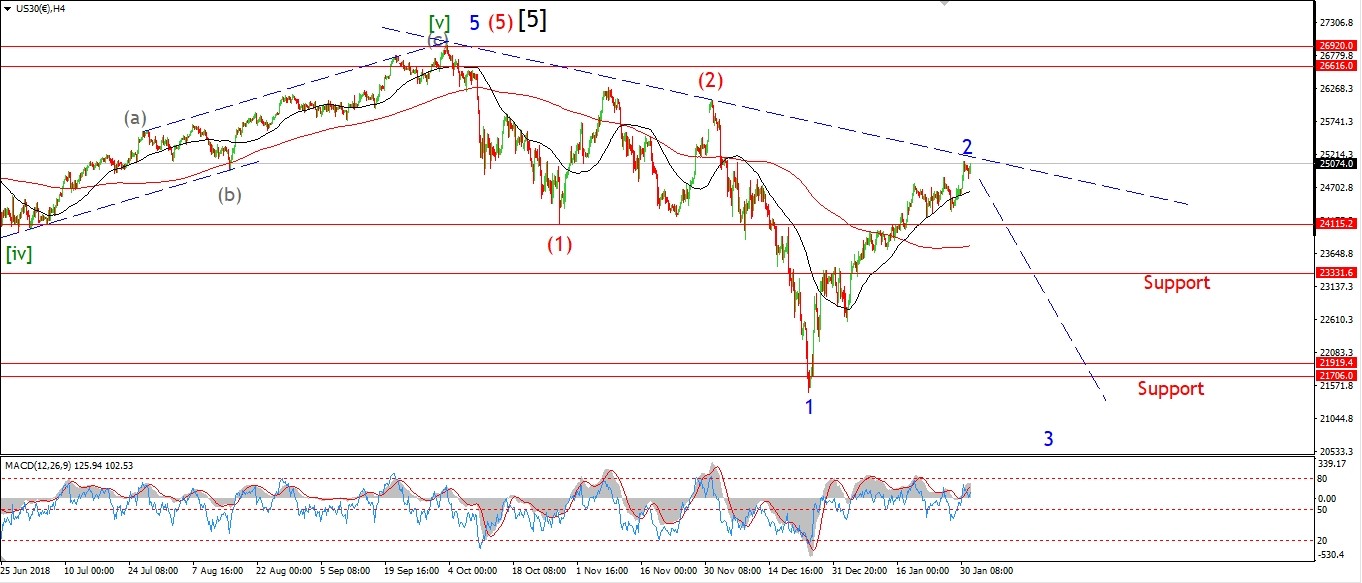 [/vc_column_text][vc_custom_heading text=”Daily” use_theme_fonts=”yes”][vc_column_text]
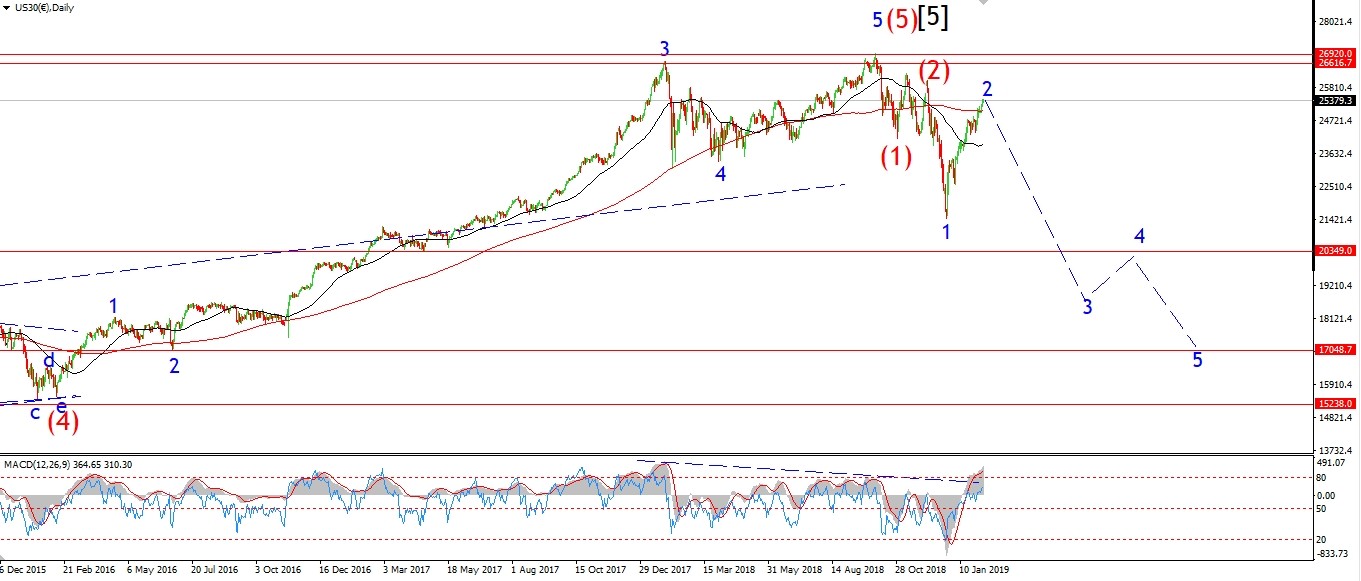 [/vc_column_text][/vc_column][/vc_row]
[vc_row][vc_column][vc_column_text]
The Market gaped higher this morning and has given back all of that advance and some.
Prices are now back below Fridays evenings close again.
The rise off Fridays lows looks like a three wave structure so far.
The market may now be declining in a third wave.
A push back below 24320 over the coming days
will greatly increase the odds that the turn is in for wave ‘3’ down.
I am still looking for a solid five wave structure lower off the wave ‘2’ high
to confirm that view.
So far so good on that front.
Tomorrow;
Wave ‘iii’ down should push below 24760 at the previous wave (iii) high.
Watch for todays high at wave ‘ii’ to hold,
and further declines to begin.
[/vc_column_text][/vc_column][/vc_row]
[/_s2If]
[_s2If current_user_can(access_s2member_ccap_gold)]
[vc_row][vc_column][vc_separator border_width=”5″][/vc_column][/vc_row][vc_row][vc_column][vc_column_text]
GOLD
[/vc_column_text][/vc_column][/vc_row][vc_row][vc_column][vc_separator border_width=”5″][/vc_column][/vc_row][vc_row][vc_column width=”2/3″][vc_custom_heading text=”1 hr” use_theme_fonts=”yes”][vc_column_text]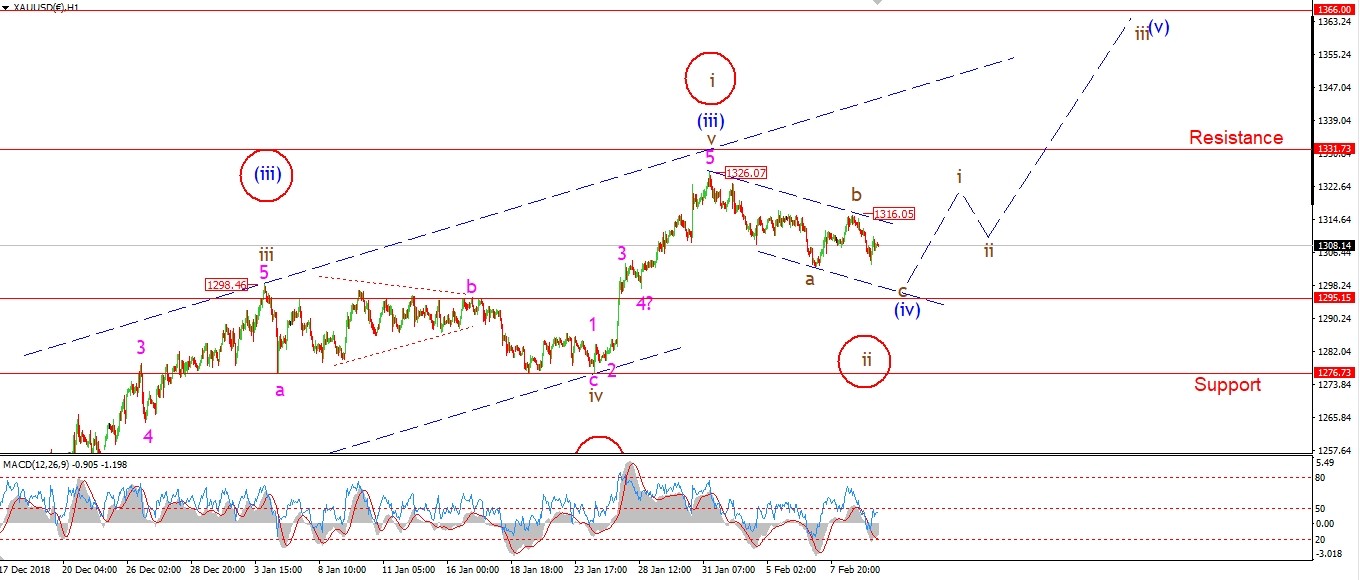 [/vc_column_text][/vc_column][vc_column width=”1/3″][vc_custom_heading text=”4 Hours” use_theme_fonts=”yes”][vc_column_text]
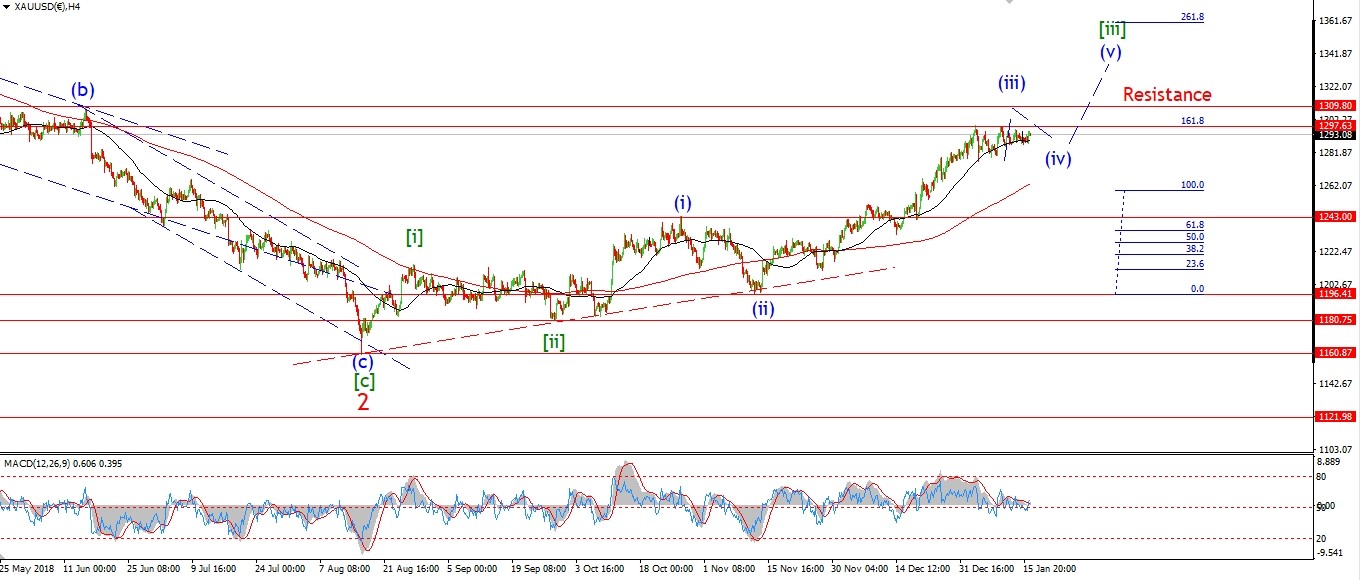 [/vc_column_text][vc_custom_heading text=”Daily” use_theme_fonts=”yes”][vc_column_text]
 [/vc_column_text][/vc_column][/vc_row]
[vc_row][vc_column][vc_column_text]
The correction in wave (iv) seems to be extending into a larger zigzag wave form after todays action.
A zigzag should trace out a 5,3,5 internal structure.
Wave ‘a’ down can be counted in 5 waves.
Wave ‘b’ is a pretty clear 3 waves.
And so far wave ‘c’ is moving in a five wave form.
Tomorrow;
The trend channel suggests a low at about 1295 to complete wave ‘c’.
Watch for a continued decline to that level to close out the trend channel again.
if the price breaks 1316 again at wave ‘b’,
that will indicate wave ‘i’ of (v) has begun.
[/vc_column_text][/vc_column][/vc_row]
[/_s2If]
[_s2If current_user_can(access_s2member_ccap_crude)]
[vc_row][vc_column][vc_separator border_width=”5″][/vc_column][/vc_row][vc_row][vc_column][vc_column_text]
U.S CRUDE OIL
[/vc_column_text][/vc_column][/vc_row][vc_row][vc_column][vc_separator border_width=”5″][/vc_column][/vc_row][vc_row][vc_column width=”2/3″][vc_custom_heading text=”1 hr” use_theme_fonts=”yes”][vc_column_text] [/vc_column_text][/vc_column][vc_column width=”1/3″][vc_custom_heading text=”4 Hours” use_theme_fonts=”yes”][vc_column_text]
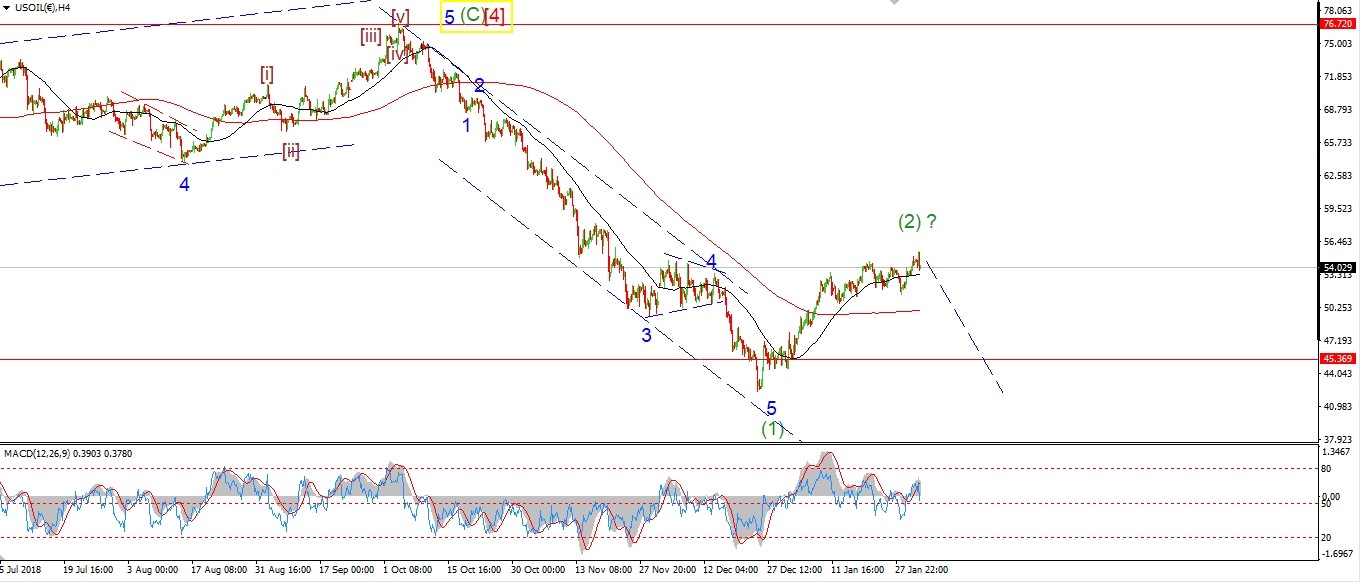 [/vc_column_text][vc_custom_heading text=”Daily” use_theme_fonts=”yes”][vc_column_text]
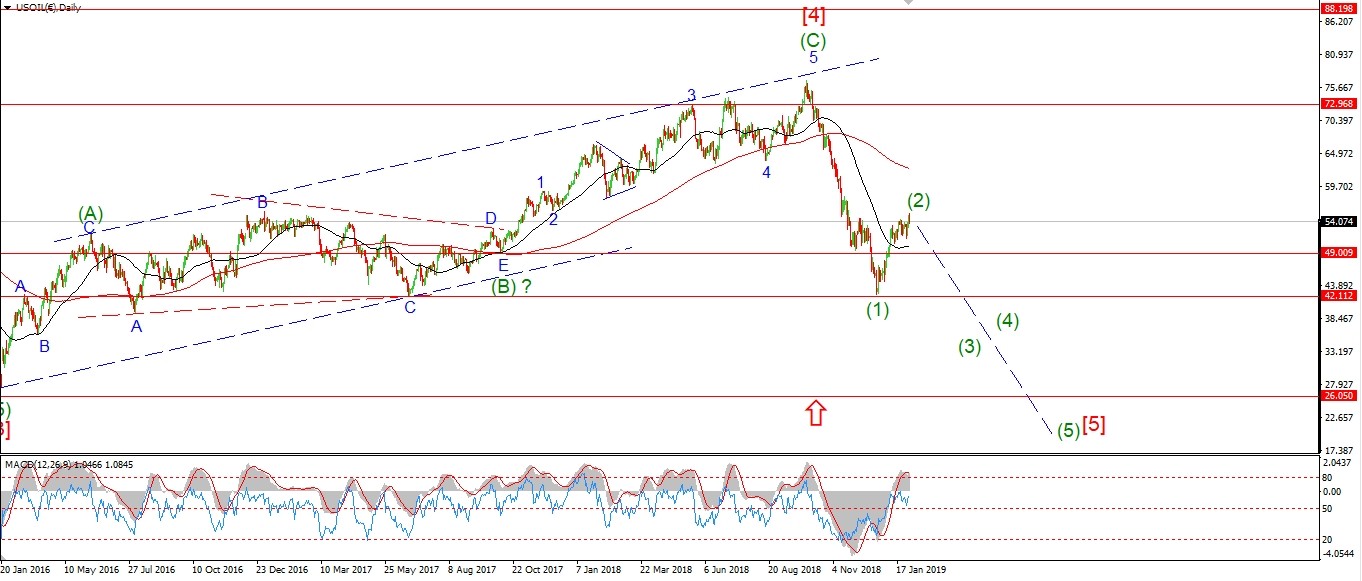 [/vc_column_text][/vc_column][/vc_row]
[vc_row][vc_column][vc_column_text]
Wave (ii) grey is still churning away after an initial drop this morning.
It looks like wave (ii) will complete an expanded flat correction in the area of 53.40 again.
Wave ‘c’ of (ii) should break the wave ‘a’ high at 53.22 at a minimum.
Once this action completes,
Then we are free to move lower again in wave (iii) of [i].
A break of the 50.00 handle again will signal wave (iii) down has begun.
Tomorrow;
Watch for wave ‘c’ of (ii) to hit 53.40 to complete.
55.75 must hold.
[/vc_column_text][/vc_column][/vc_row]
[/_s2If]
[_s2If current_user_can(access_s2member_ccap_us10yr)]
[vc_row][vc_column][vc_separator border_width=”5″][/vc_column][/vc_row][vc_row][vc_column][vc_column_text]
US 10 yr Treasuries.
[/vc_column_text][/vc_column][/vc_row][vc_row][vc_column][vc_separator border_width=”5″][/vc_column][/vc_row][vc_row][vc_column width=”2/3″][vc_custom_heading text=”1 hr” use_theme_fonts=”yes”][vc_column_text] [/vc_column_text][/vc_column][vc_column width=”1/3″][vc_custom_heading text=”4 Hours” use_theme_fonts=”yes”][vc_column_text]
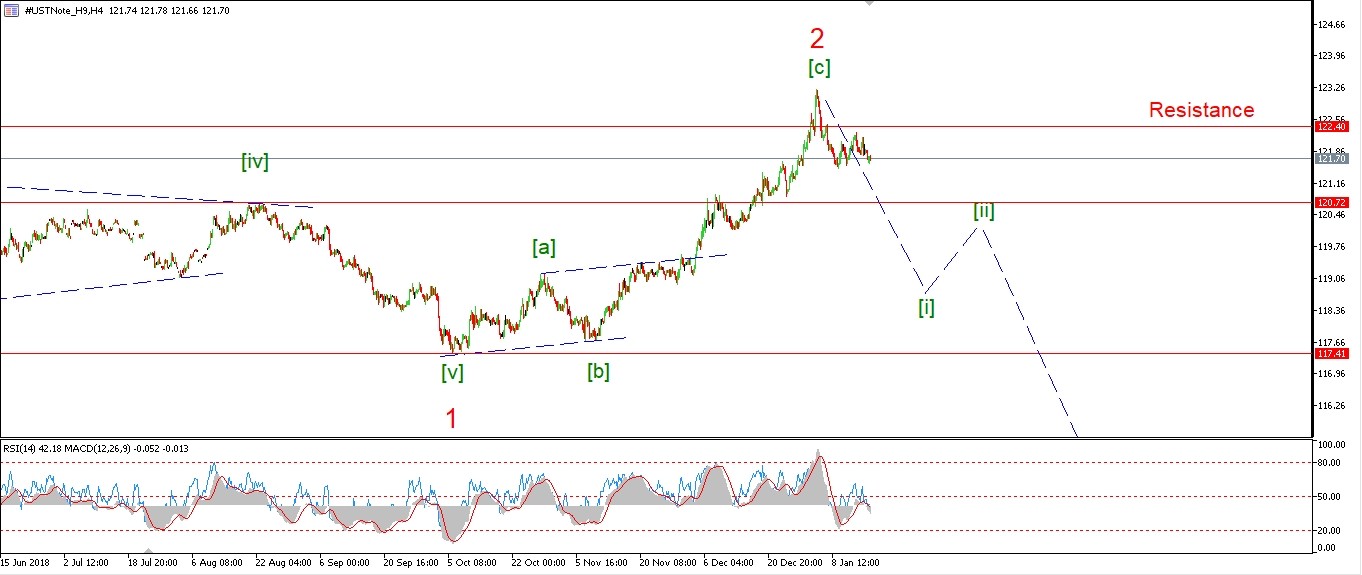 [/vc_column_text][vc_custom_heading text=”Daily” use_theme_fonts=”yes”][vc_column_text]
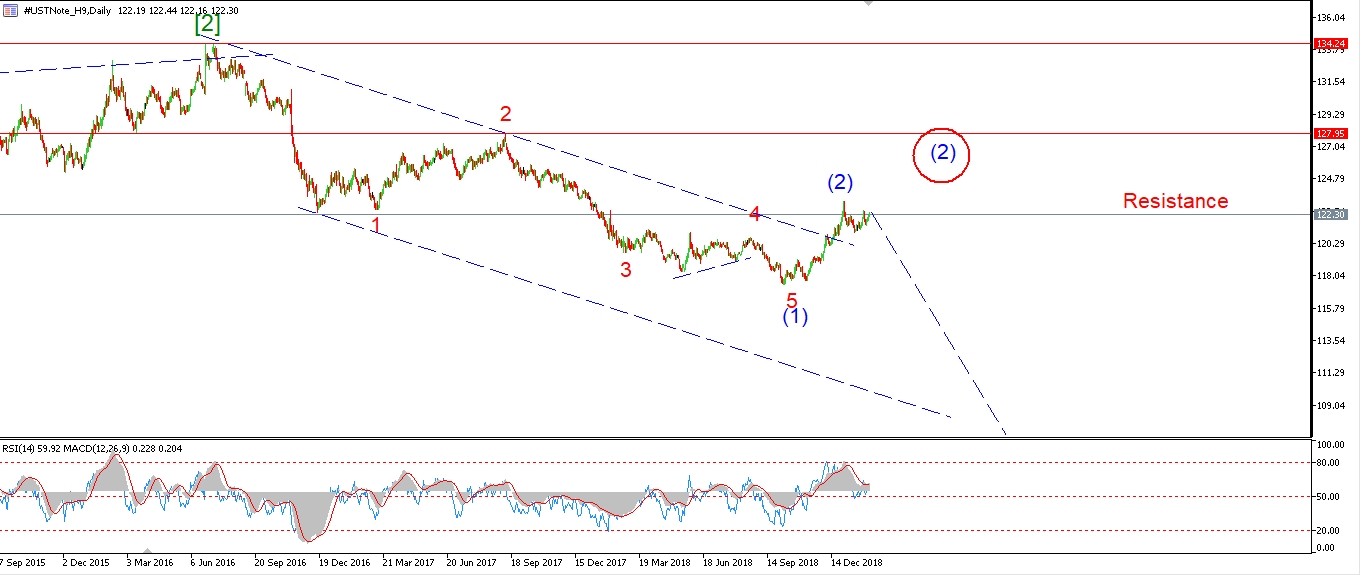 [/vc_column_text][/vc_column][/vc_row]
[vc_row][vc_column][vc_column_text]
The 10YR came down off the high labelled wave ‘ii’ today
which saves the current bearish count for the moment.
it’s still too close to call.
1.2256 must hold for the impulse waves ‘i’ and ‘ii’ lower to remain valid.
and a break of 121.56 will signal that wave ‘iii’ has begun.
The alternate count on the 4hr chart will be ruled out with a break of 121.06.
So that level is key for the week ahead.
Tomorrow;
watch for 122.56 to hold,
and wave ‘iii’ down to continue and be confirmed with a break of 121.56.
[/vc_column_text][/vc_column][/vc_row]
[/_s2If]
[_s2If current_user_can(access_s2member_ccap_silver)]
[vc_row][vc_column][vc_separator border_width=”5″][/vc_column][/vc_row][vc_row][vc_column][vc_column_text]
SILVER
[/vc_column_text][/vc_column][/vc_row][vc_row][vc_column][vc_separator border_width=”5″][/vc_column][/vc_row][vc_row][vc_column width=”2/3″][vc_custom_heading text=”1 hr” use_theme_fonts=”yes”][vc_column_text]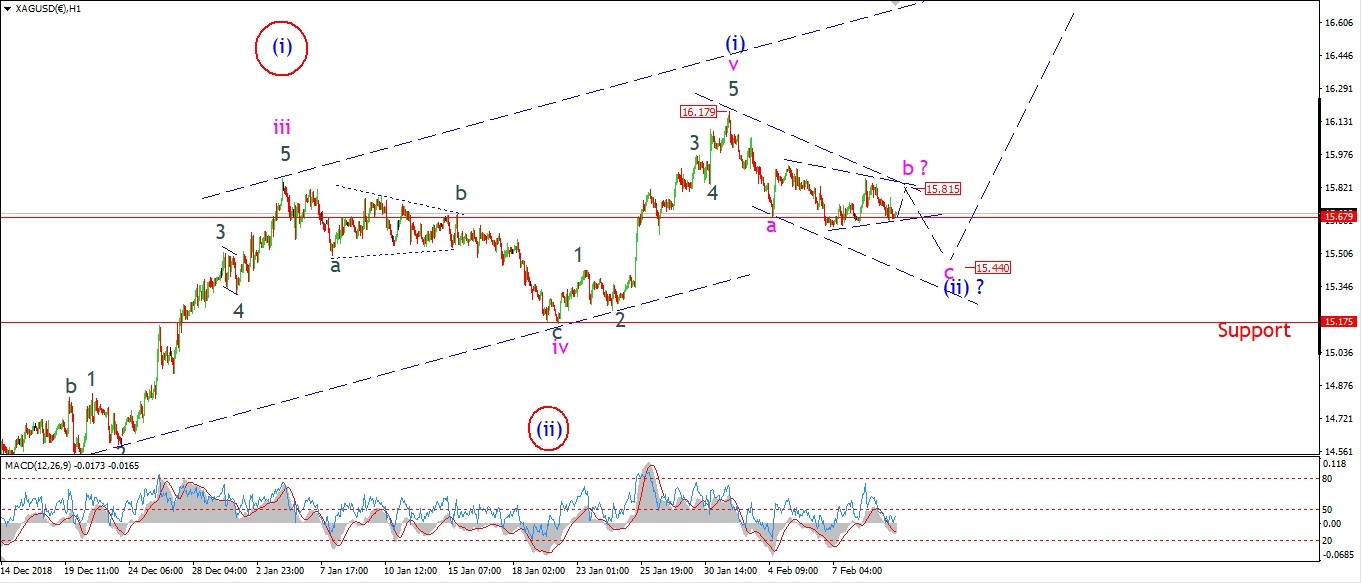 [/vc_column_text][/vc_column][vc_column width=”1/3″][vc_custom_heading text=”4 Hours” use_theme_fonts=”yes”][vc_column_text]
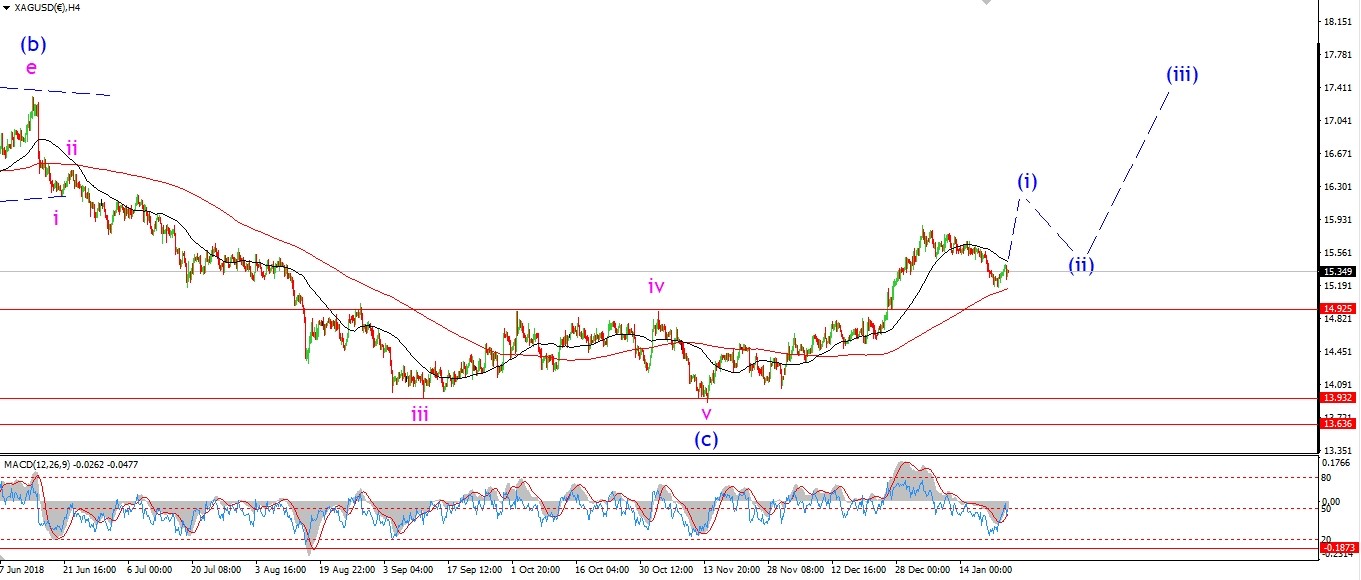 [/vc_column_text][vc_custom_heading text=”Daily” use_theme_fonts=”yes”][vc_column_text]
 [/vc_column_text][/vc_column][/vc_row]
[vc_row][vc_column][vc_column_text]
Wave ‘b’ of (ii) is dragging on in Silver today.
The price is contracting in a possible triangle wave ‘b’.
Wave ‘b’ should hit 15.80 again to complete.
And then one last drop in wave ‘c’ is expected to complete in the region of 15.40.
Tomorrow;
watch for this triangle to close out wave ‘b’ at about 15.80.
wave ‘c’ may even be done by tomorrows close.
[/vc_column_text][/vc_column][/vc_row]
[/_s2If]
[_s2If current_user_can(access_s2member_ccap_sp500)]
[vc_row][vc_column][vc_separator border_width=”5″][/vc_column][/vc_row][vc_row][vc_column][vc_column_text]
S&P 500.
[/vc_column_text][/vc_column][/vc_row][vc_row][vc_column][vc_separator border_width=”5″][/vc_column][/vc_row][vc_row][vc_column width=”2/3″][vc_custom_heading text=”1 hr” use_theme_fonts=”yes”][vc_column_text]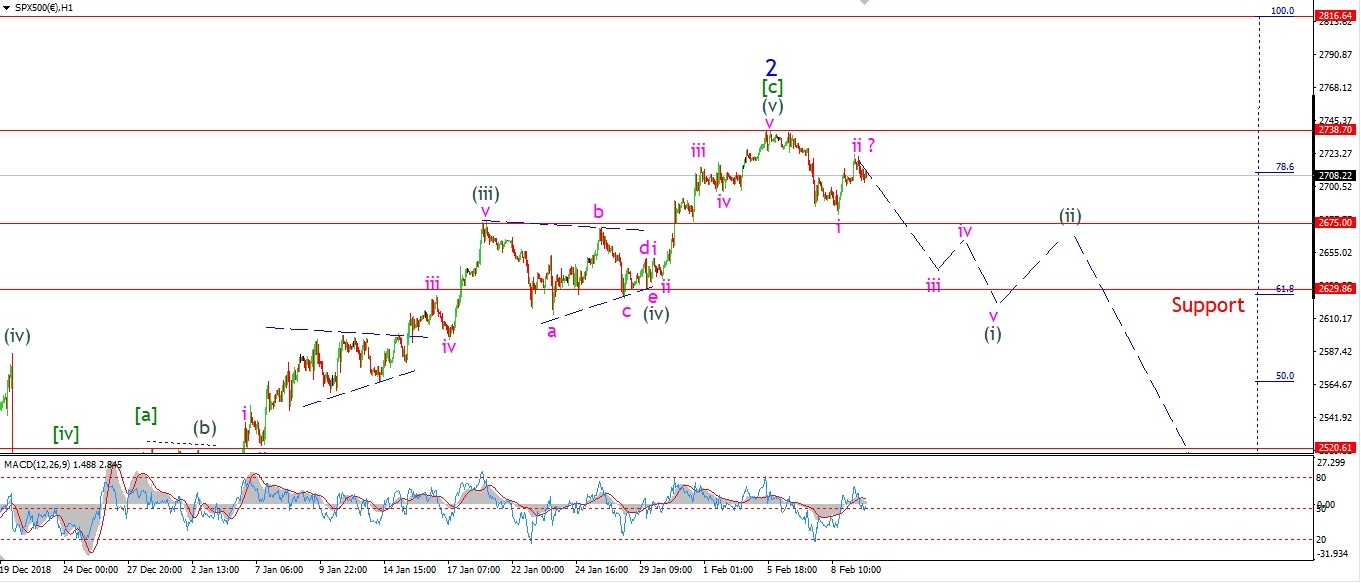 [/vc_column_text][/vc_column][vc_column width=”1/3″][vc_custom_heading text=”4 Hours” use_theme_fonts=”yes”][vc_column_text]
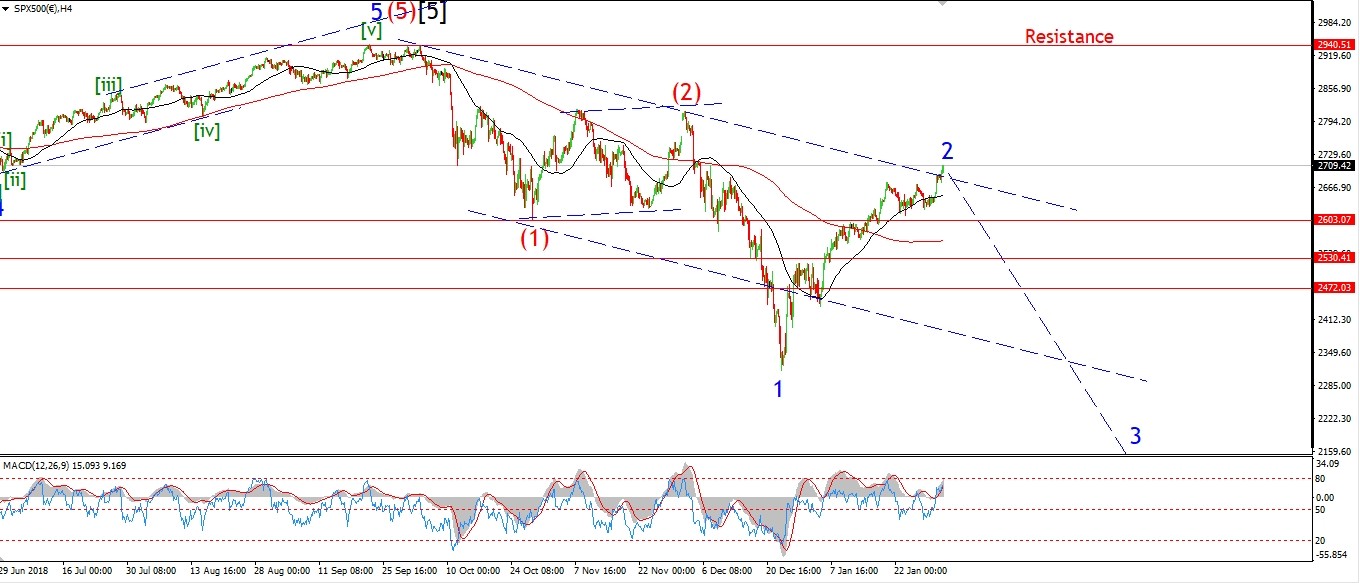 [/vc_column_text][vc_custom_heading text=”Daily” use_theme_fonts=”yes”][vc_column_text]
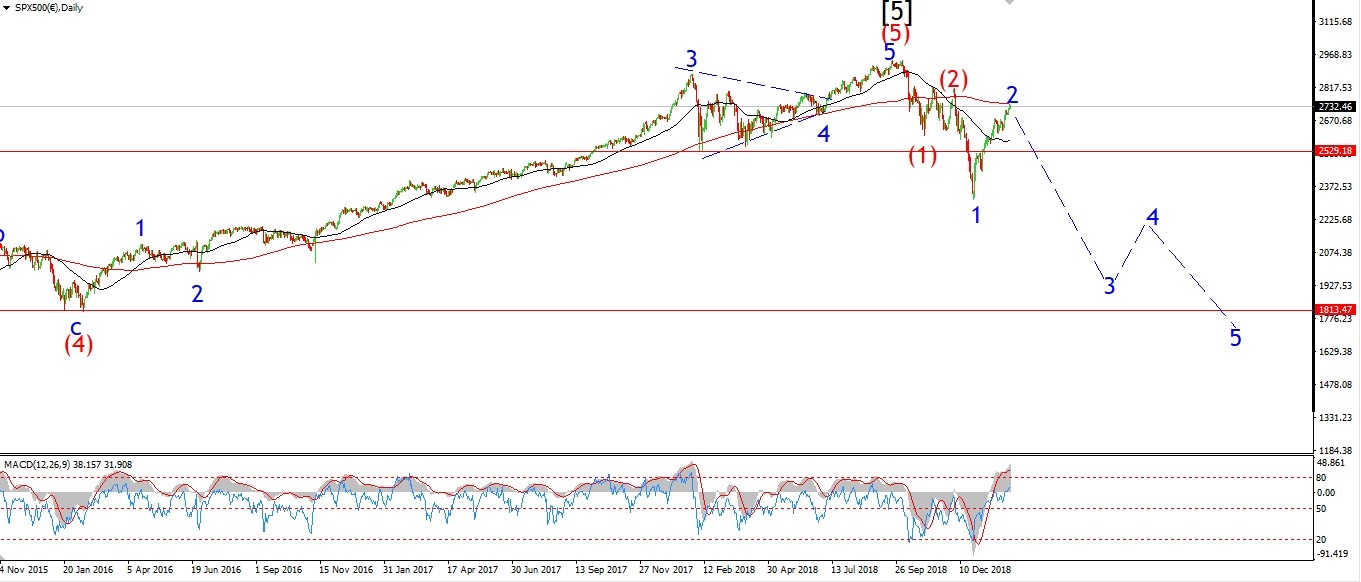 [/vc_column_text][/vc_column][/vc_row]
[vc_row][vc_column][vc_column_text]
The gap higher this morning was filled by the decline also today,
but the market rose back into that gap again this evening,
which puts a bit of a damper on the bearish potential.
The rise off the low at wave ‘i’ still reads best as a three wave structure,
labelled wave ‘ii’.
But todays high at 2717 must hold now,
and wave ‘iii’ must drop below 2681 to confirm that wave ‘ii’ is complete.
The aim of the game this week is to complete a five wave decline off that wave ‘2’ high,
this will shift the focus lower
and gear us up for a large degree decline in wave ‘3’ over the coming weeks.
Tomorrow;
Watch for a drop in wave ‘iii’ of (i) to begin with a break of 2681.
[/vc_column_text][/vc_column][/vc_row]
[/_s2If]
[vc_row][vc_column][vc_column_text]
[/vc_column_text][/vc_column][/vc_row]
[vc_row][vc_column][vc_separator border_width=”5″][/vc_column][/vc_row]