
[vc_row][vc_column][vc_separator border_width=”5″][/vc_column][/vc_row]
[vc_row][vc_column][vc_column_text]
Hello everyone.
[/vc_column_text][/vc_column][/vc_row]
[vc_row][vc_column][vc_separator border_width=”5″][/vc_column][/vc_row]
[vc_row][vc_column][vc_column_text]
EURUSD
[/vc_column_text][/vc_column][/vc_row]
[vc_row][vc_column][vc_separator border_width=”5″][/vc_column][/vc_row][vc_row][vc_column width=”2/3″][vc_custom_heading text=”30 min” use_theme_fonts=”yes”][vc_column_text]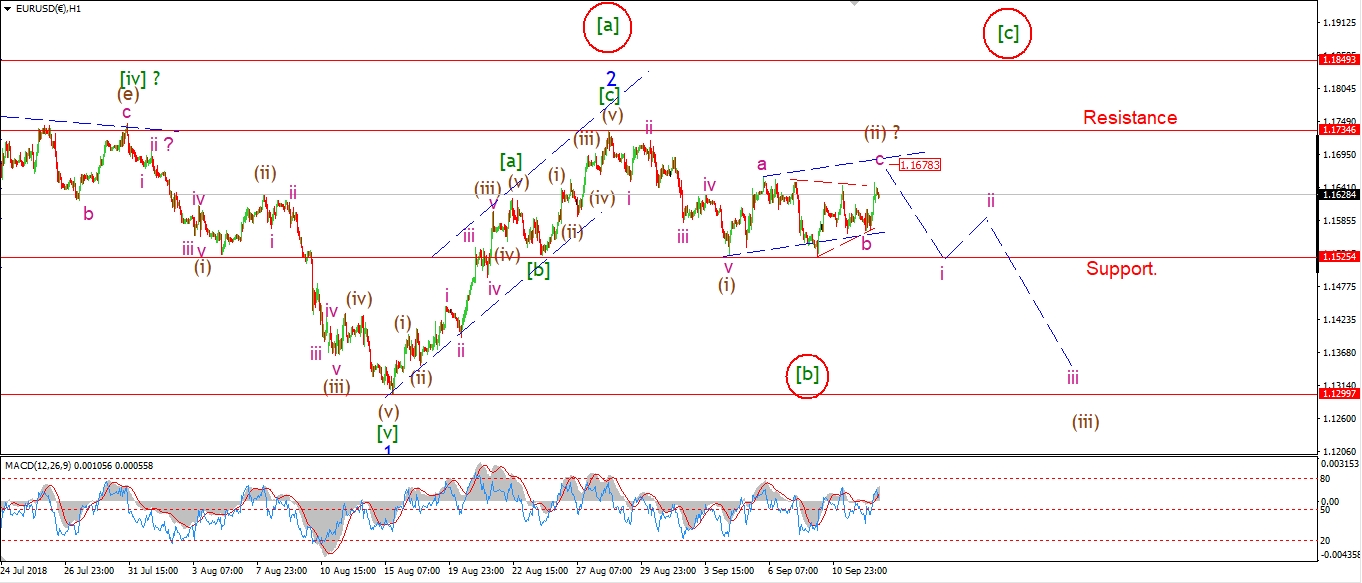 [/vc_column_text][/vc_column][vc_column width=”1/3″][vc_custom_heading text=”4 Hours” use_theme_fonts=”yes”][vc_column_text]
 [/vc_column_text][vc_custom_heading text=”Daily” use_theme_fonts=”yes”][vc_column_text]
 [/vc_column_text][/vc_column][/vc_row]
[vc_row][vc_column][vc_column_text]
The current correction in wave (ii) brown is causing a daily headache!
But that is the very nature of a correction.
I have shown another interpretation for wave (ii) tonight.
This involves a three wave rise in wave ‘a’,
a contracting triangle wave ‘b’ which completed overnight.
And a final five wave rally in wave ‘c’ which should break the wave ‘a’ high at 1.1659.
The trend channel suggests a top at 1.1678.
And the price must not break 1.1734.
Tomorrow;
Watch for wave ‘c’ to complete above 1.1659.
[/vc_column_text][/vc_column][/vc_row]
[vc_row][vc_column][vc_separator border_width=”5″][/vc_column][/vc_row][vc_row][vc_column][vc_column_text]
GBPUSD
[/vc_column_text][/vc_column][/vc_row][vc_row][vc_column][vc_separator border_width=”5″][/vc_column][/vc_row][vc_row][vc_column width=”2/3″][vc_custom_heading text=”30 min” use_theme_fonts=”yes”][vc_column_text]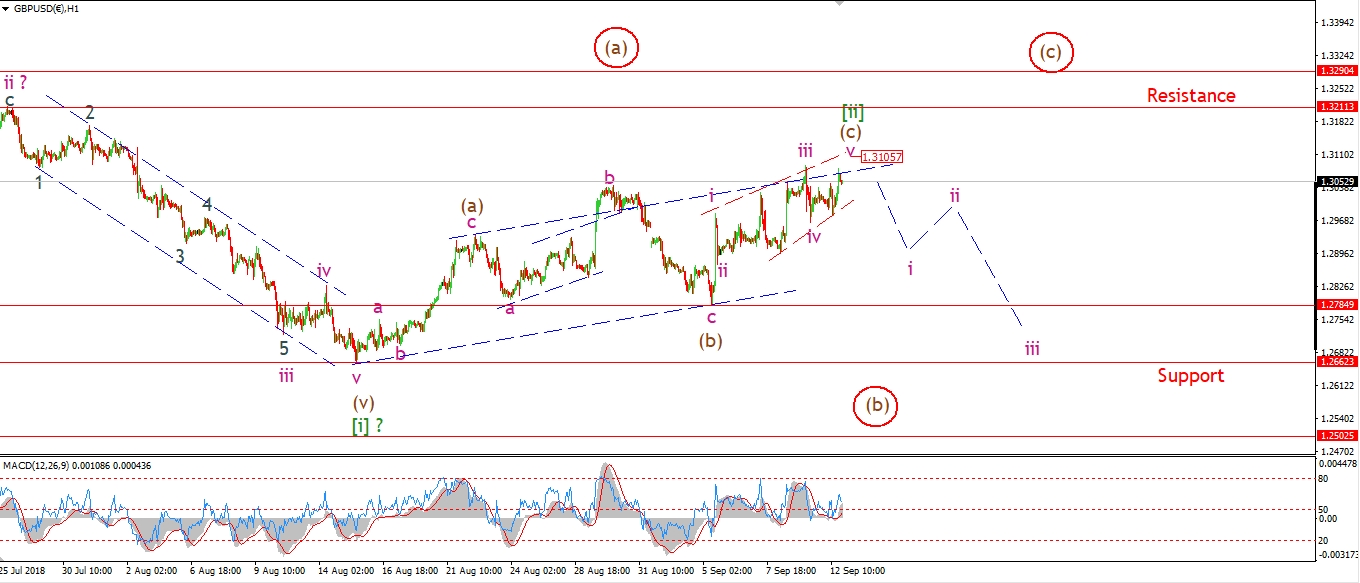 [/vc_column_text][/vc_column][vc_column width=”1/3″][vc_custom_heading text=”4 Hours” use_theme_fonts=”yes”][vc_column_text]
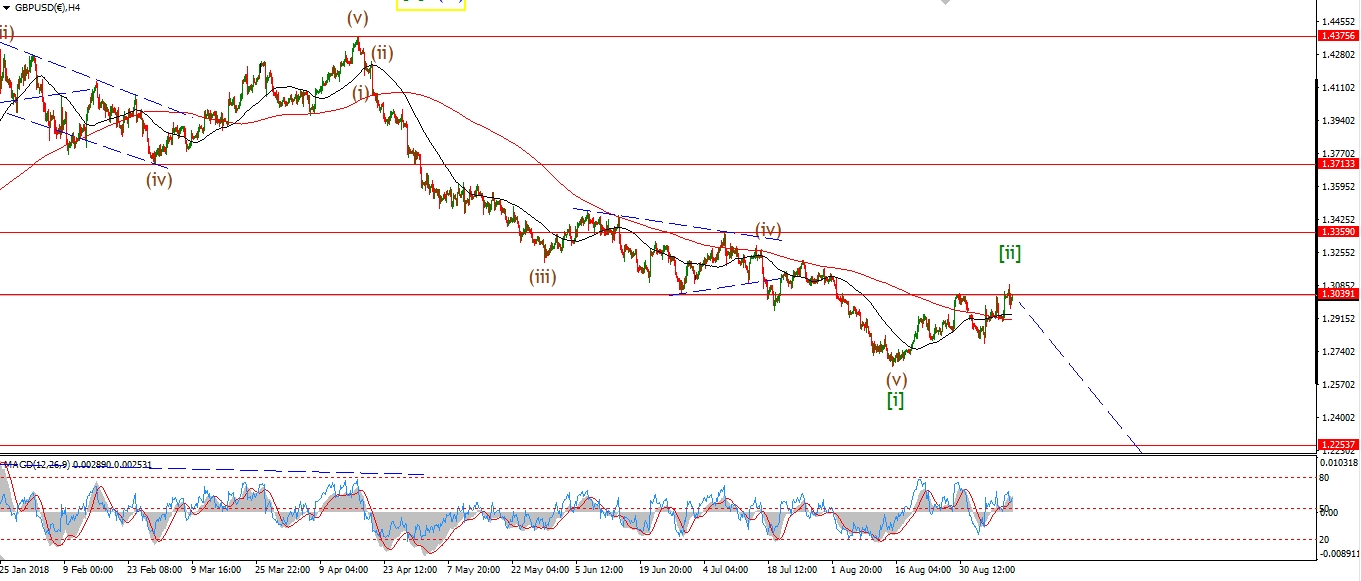 [/vc_column_text][vc_custom_heading text=”Daily” use_theme_fonts=”yes”][vc_column_text]
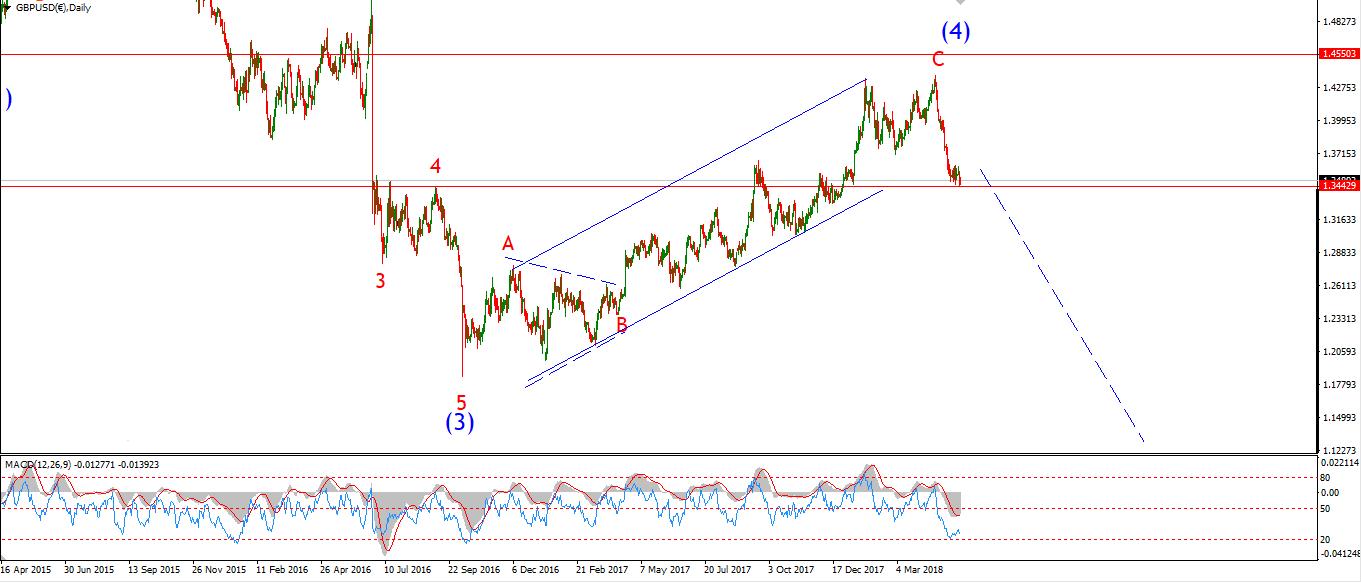 [/vc_column_text][/vc_column][/vc_row]
[vc_row][vc_column][vc_column_text]
The pattern in cable is just as awkward as EURUSD this week.
Wave (c) brown has gone through three different wave forms so far.
Todays action has forced another rethink of the short term count.
The overlapping nature of the rise off wave (b) at 1.2784 can be counted as an ending diagonal wave (c).
This accounts well for the decline in momentum,
and the contracting price channel off wave (b).
The outlook is the same as previous.
Wave (c) should complete at about 1.3100 and then begin a decline in wave (c).
Tomorrow;
Watch for a reaction off the upper trend line at about 1.3100.
Wave [iii] green should begin before the end of the week.
[/vc_column_text][/vc_column][/vc_row]
[vc_row][vc_column][vc_separator border_width=”5″][/vc_column][/vc_row][vc_row][vc_column][vc_column_text]
USDJPY
[/vc_column_text][/vc_column][/vc_row][vc_row][vc_column][vc_separator border_width=”5″][/vc_column][/vc_row][vc_row][vc_column width=”2/3″][vc_custom_heading text=”30 min” use_theme_fonts=”yes”][vc_column_text]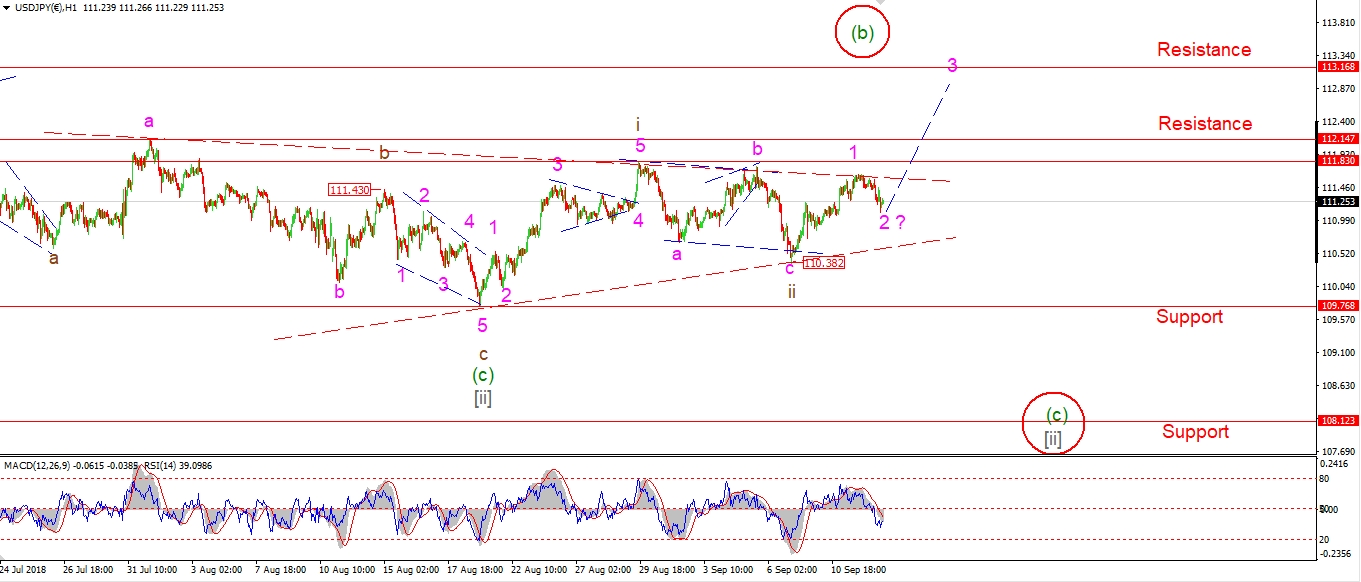 [/vc_column_text][/vc_column][vc_column width=”1/3″][vc_custom_heading text=”4 Hours” use_theme_fonts=”yes”][vc_column_text]
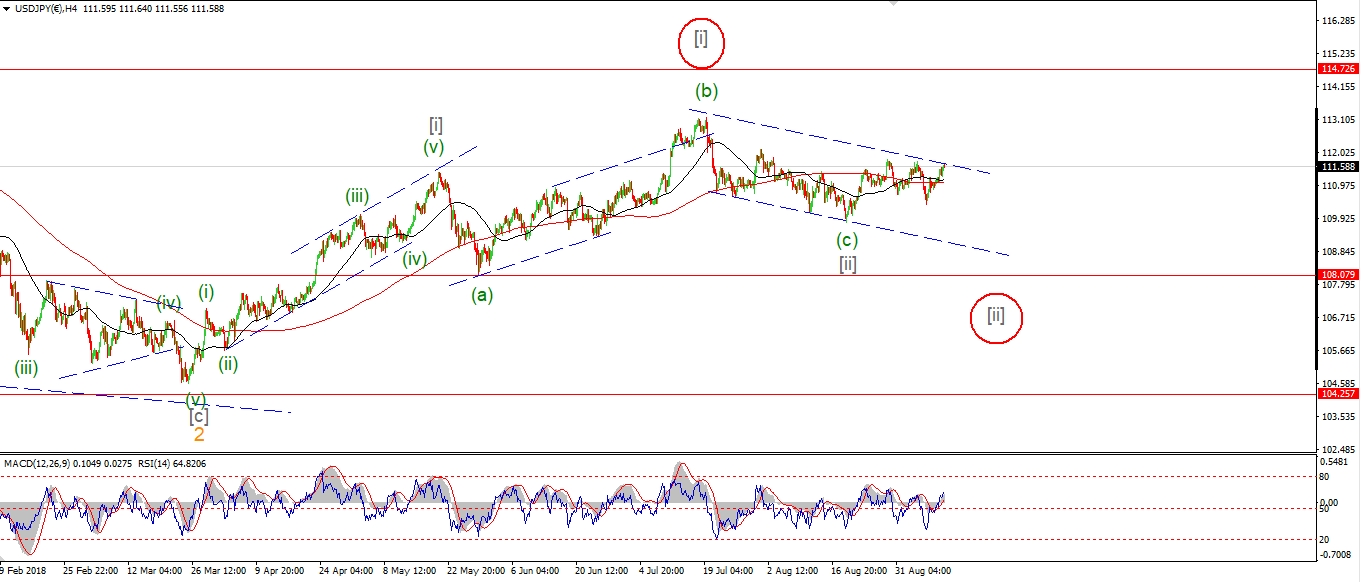 [/vc_column_text][vc_custom_heading text=”Daily” use_theme_fonts=”yes”][vc_column_text]
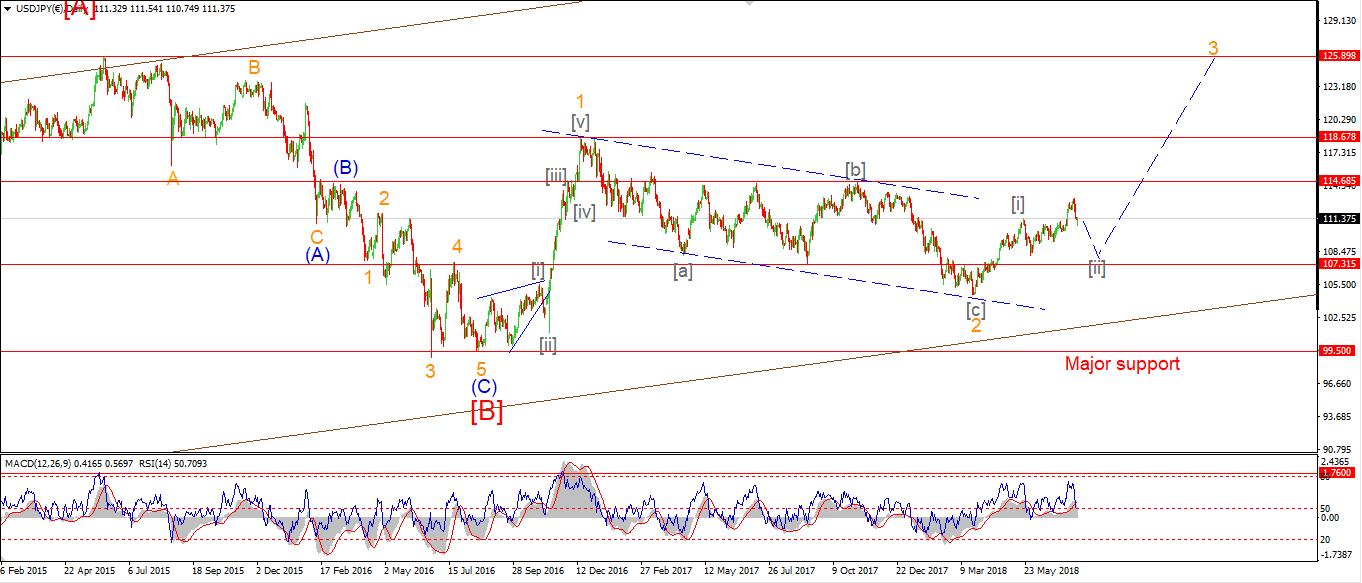 [/vc_column_text][/vc_column][/vc_row]
[vc_row][vc_column][vc_column_text]
The alternate count has not been ruled out yet after today’s action.
Price has held below the trendline in red today in a possible wave ‘2’ decline.
If we don’t see an impulsive break above 111.83 before the end of this week,
the I will have to switch to the alternate count shown circled in red.
Tomorrow;
Watch for wave ‘2’ to complete above 110.38,
and a rally above resistance in wave ‘3’ to begin.
[/vc_column_text][/vc_column][/vc_row]
[vc_row][vc_column][vc_separator border_width=”5″][/vc_column][/vc_row][vc_row][vc_column][vc_column_text]
DOW JONES INDUSTRIALS
[/vc_column_text][/vc_column][/vc_row][vc_row][vc_column][vc_separator border_width=”5″][/vc_column][/vc_row][vc_row][vc_column width=”2/3″][vc_custom_heading text=”30 min” use_theme_fonts=”yes”][vc_column_text]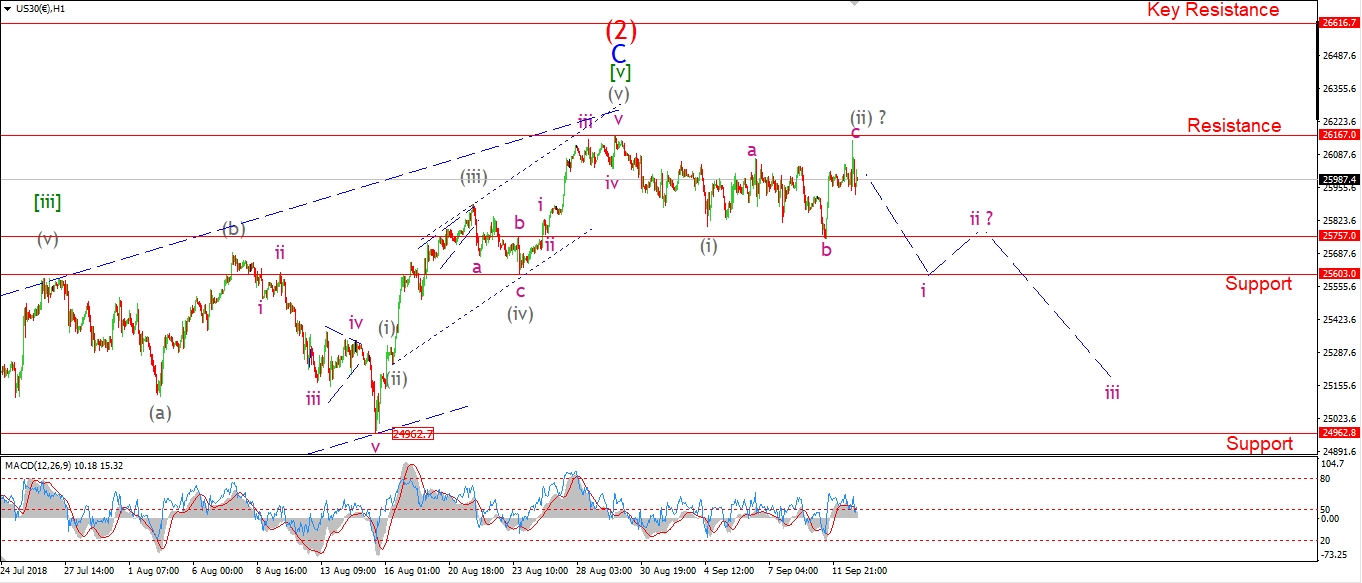 [/vc_column_text][/vc_column][vc_column width=”1/3″][vc_custom_heading text=”4 Hours” use_theme_fonts=”yes”][vc_column_text]
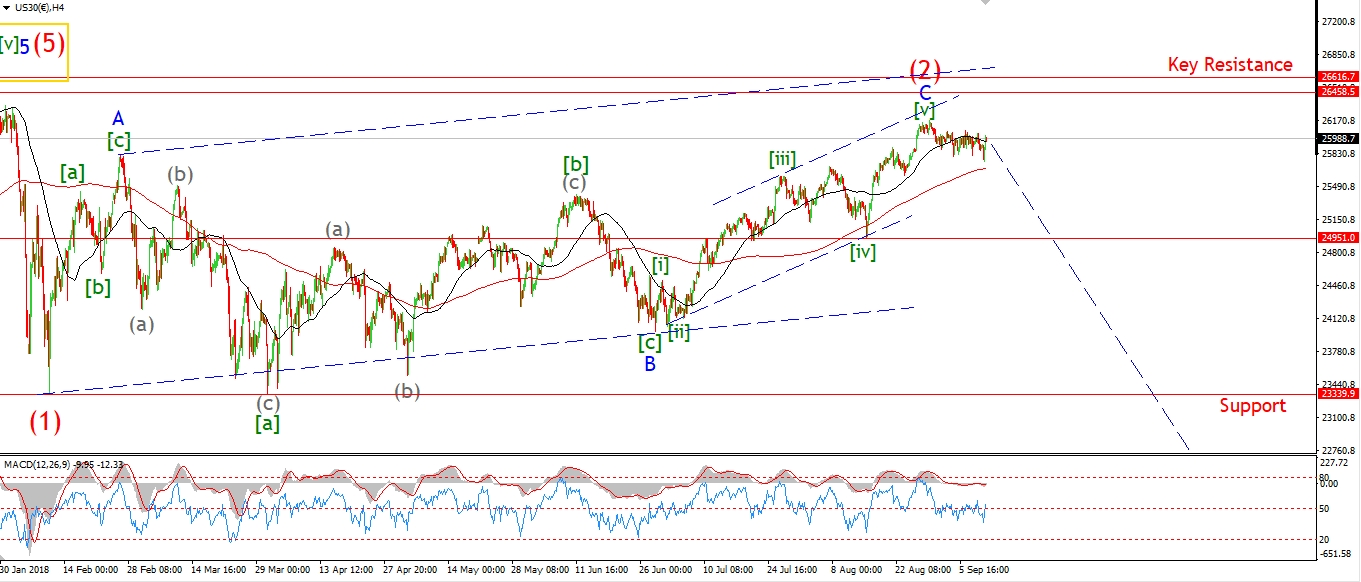 [/vc_column_text][vc_custom_heading text=”Daily” use_theme_fonts=”yes”][vc_column_text]
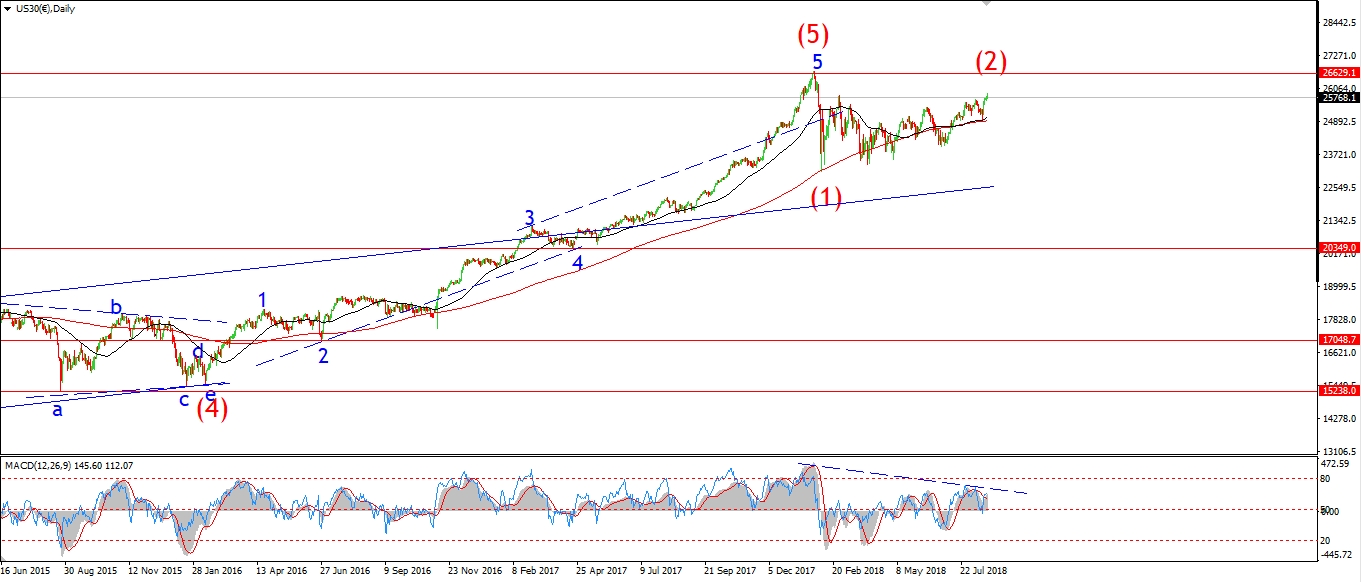 [/vc_column_text][/vc_column][/vc_row]
[vc_row][vc_column][vc_column_text]
Its been a strange day of action in the DOW.
We saw a sharp rally out of the gate this morning,
but the price did not break to a new high above 26167.
The high reached 26144 and we are closing almost flat this evening.
The price structure still counts as a five wave decline in wave (i),
And a three wave expanded flat in wave (ii).
the internal wave structure of wave (ii) fits the 3,3,5 pattern.
Tomorrow;
I am still waiting for the price to signal a decline into wave (iii) grey.
If the decline continues tomorrow and breaks 25757,
that will be enough to confirm wave (iii) down.
[/vc_column_text][/vc_column][/vc_row]
[vc_row][vc_column][vc_separator border_width=”5″][/vc_column][/vc_row][vc_row][vc_column][vc_column_text]
GOLD
[/vc_column_text][/vc_column][/vc_row][vc_row][vc_column][vc_separator border_width=”5″][/vc_column][/vc_row][vc_row][vc_column width=”2/3″][vc_custom_heading text=”30 min” use_theme_fonts=”yes”][vc_column_text]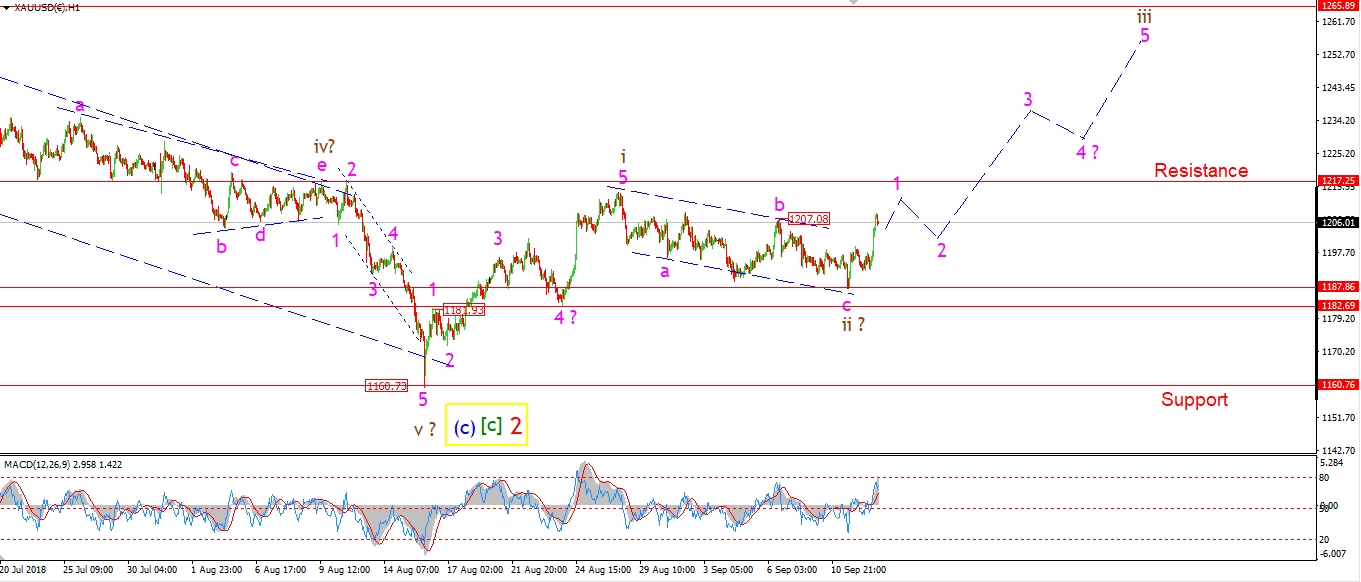 [/vc_column_text][/vc_column][vc_column width=”1/3″][vc_custom_heading text=”4 Hours” use_theme_fonts=”yes”][vc_column_text]
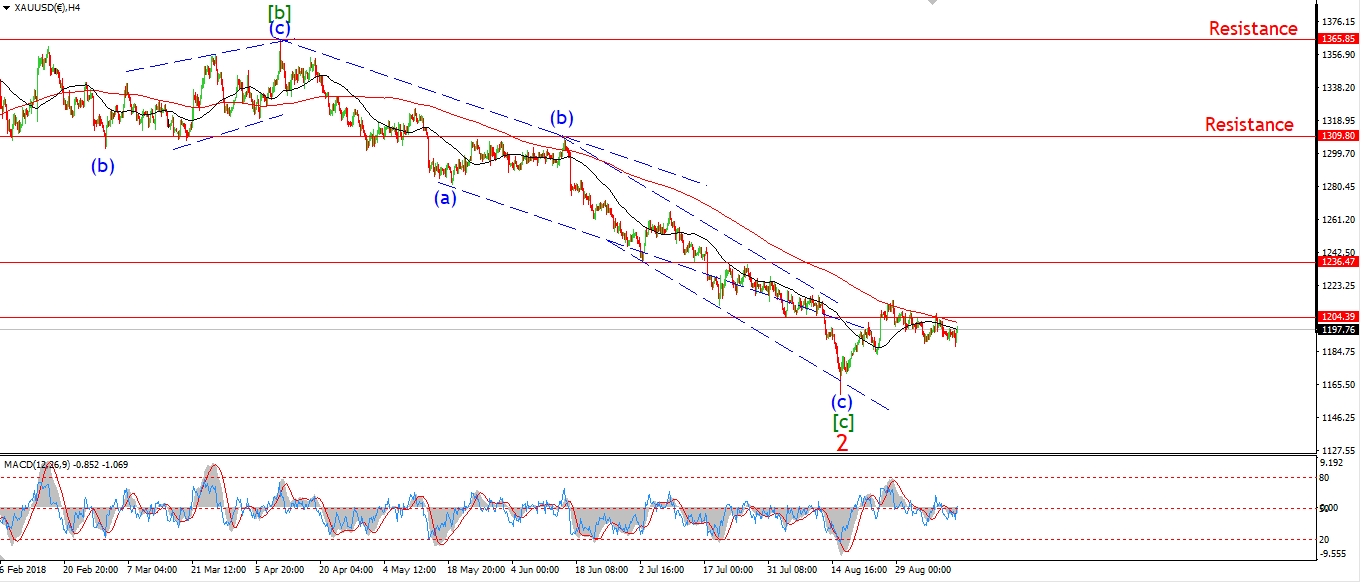 [/vc_column_text][vc_custom_heading text=”Daily” use_theme_fonts=”yes”][vc_column_text]
 [/vc_column_text][/vc_column][/vc_row]
[vc_row][vc_column][vc_column_text]
GOLD has taken out 1207 today and given the first sign that wave ‘iii’ has begun.
Wave ‘iii’ will be confirmed with a break of 1217.
It would be good to see a break of 1217 in wave ‘1’ of ‘iii’.
Lets see if that occurs tomorrow.
The low of wave ‘ii’ now stands at 1187.86.
This low must hold from here on.
Tomorrow;
Watch for a bullish break of 1217 in wave ‘iii’ brown.
[/vc_column_text][/vc_column][/vc_row]
[vc_row][vc_column][vc_separator border_width=”5″][/vc_column][/vc_row][vc_row][vc_column][vc_column_text]
U.S CRUDE OIL
[/vc_column_text][/vc_column][/vc_row][vc_row][vc_column][vc_separator border_width=”5″][/vc_column][/vc_row][vc_row][vc_column width=”2/3″][vc_custom_heading text=”30 min” use_theme_fonts=”yes”][vc_column_text] [/vc_column_text][/vc_column][vc_column width=”1/3″][vc_custom_heading text=”4 Hours” use_theme_fonts=”yes”][vc_column_text]
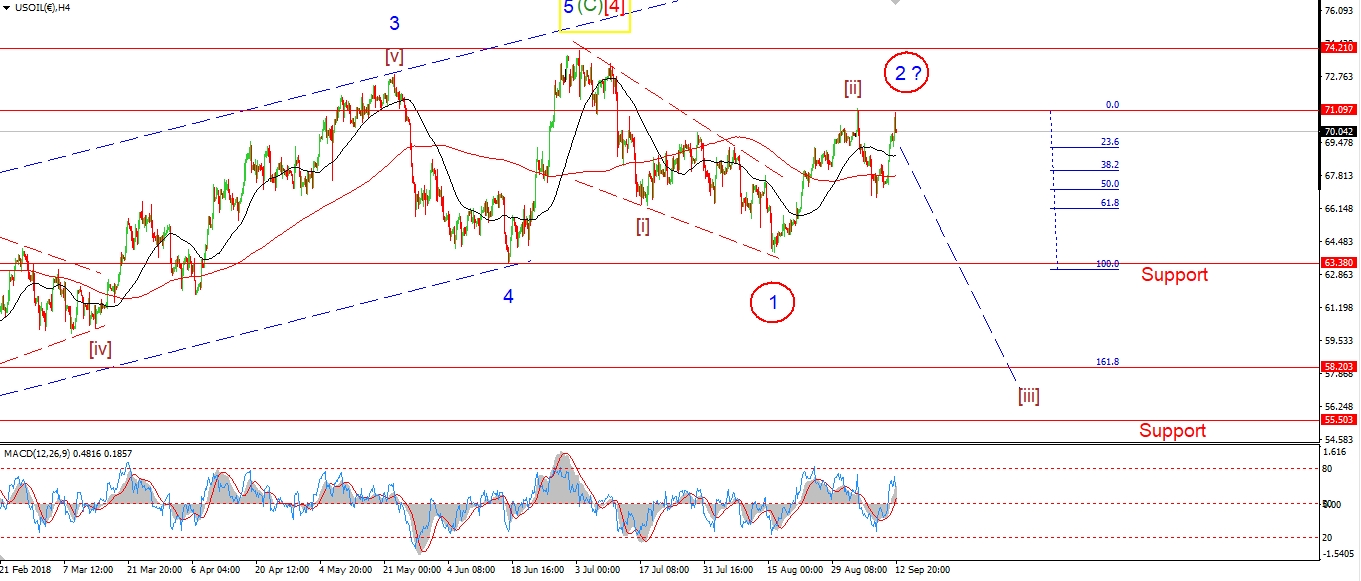 [/vc_column_text][vc_custom_heading text=”Daily” use_theme_fonts=”yes”][vc_column_text]
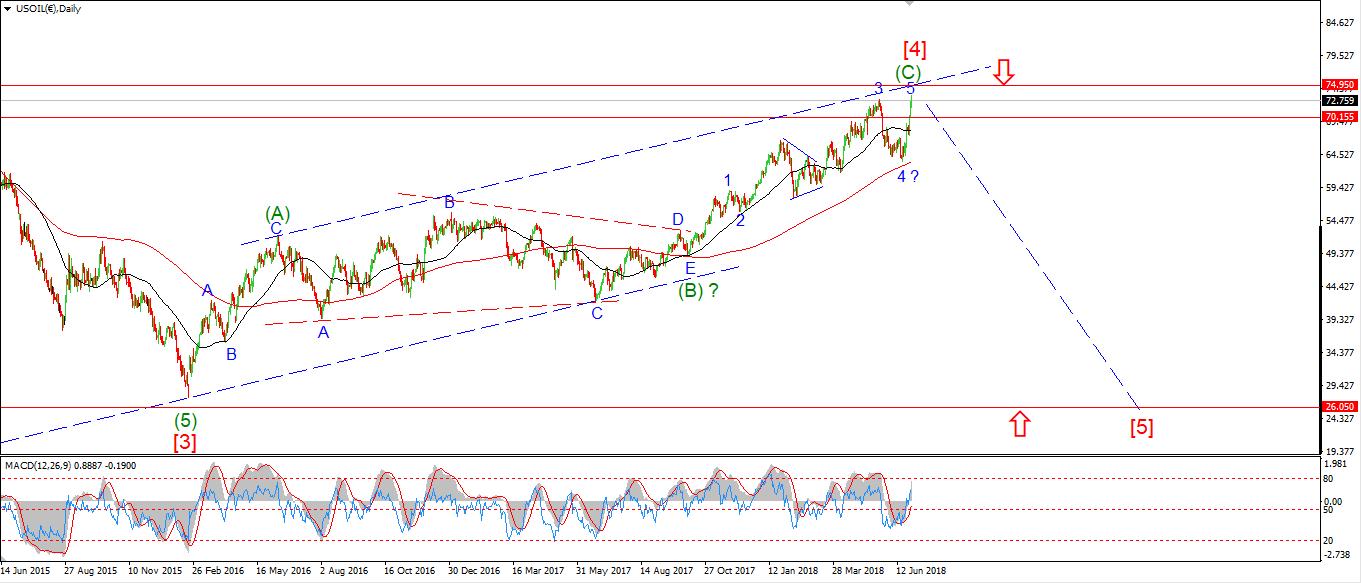 [/vc_column_text][/vc_column][/vc_row]
[vc_row][vc_column][vc_column_text]
Crude pushed higher towards resistance again today with prices reaching 71.26 at the high.
This rally can still be viewed as wave ‘c’ of (ii).
Although the extent of the rally has raised the possibility of a larger correction in wave ‘2’ blue.
This is shown best on the 4hr chart.
A break of the high at 71.40 will confirm that alternate count.
The wave ‘a’ high lies at 68.52.
If price breaks that level it will be the first sign that wave ‘i’ of (iii) has begun.
Tomorrow;
Watch for 71.40 to hold and a decline into wave ‘i’ of (iii).
[/vc_column_text][/vc_column][/vc_row]
[vc_row][vc_column][vc_separator border_width=”5″][/vc_column][/vc_row][vc_row][vc_column][vc_column_text]
US 10 yr Treasuries.
[/vc_column_text][/vc_column][/vc_row][vc_row][vc_column][vc_separator border_width=”5″][/vc_column][/vc_row][vc_row][vc_column width=”2/3″][vc_custom_heading text=”30 min” use_theme_fonts=”yes”][vc_column_text]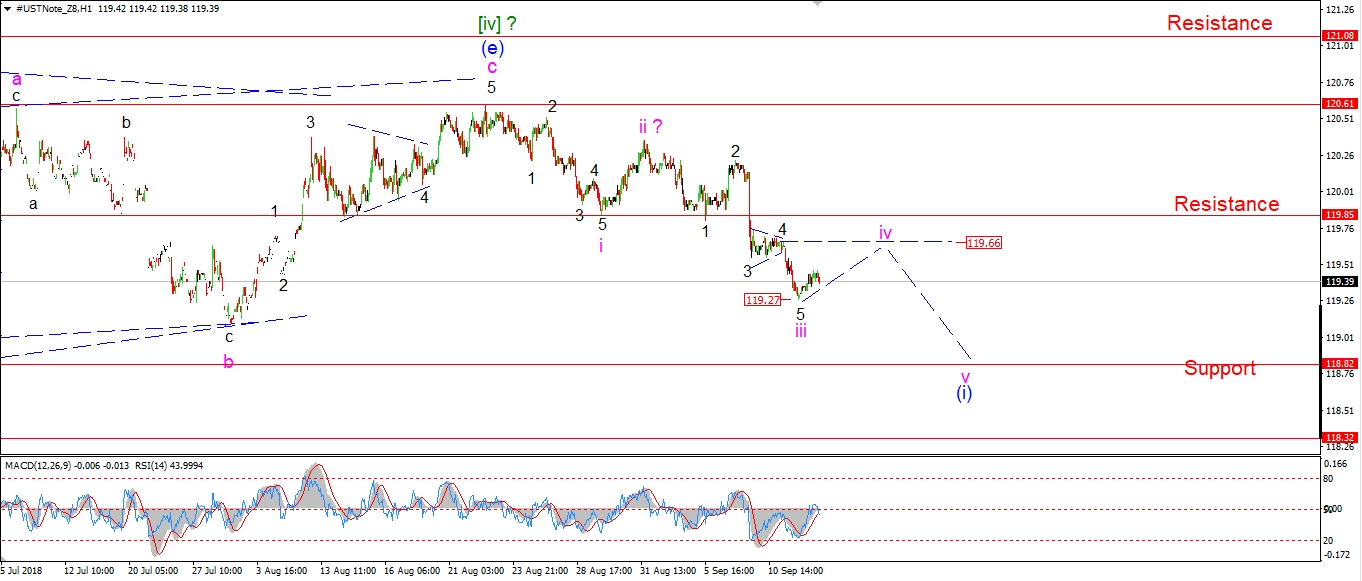 [/vc_column_text][/vc_column][vc_column width=”1/3″][vc_custom_heading text=”4 Hours” use_theme_fonts=”yes”][vc_column_text]
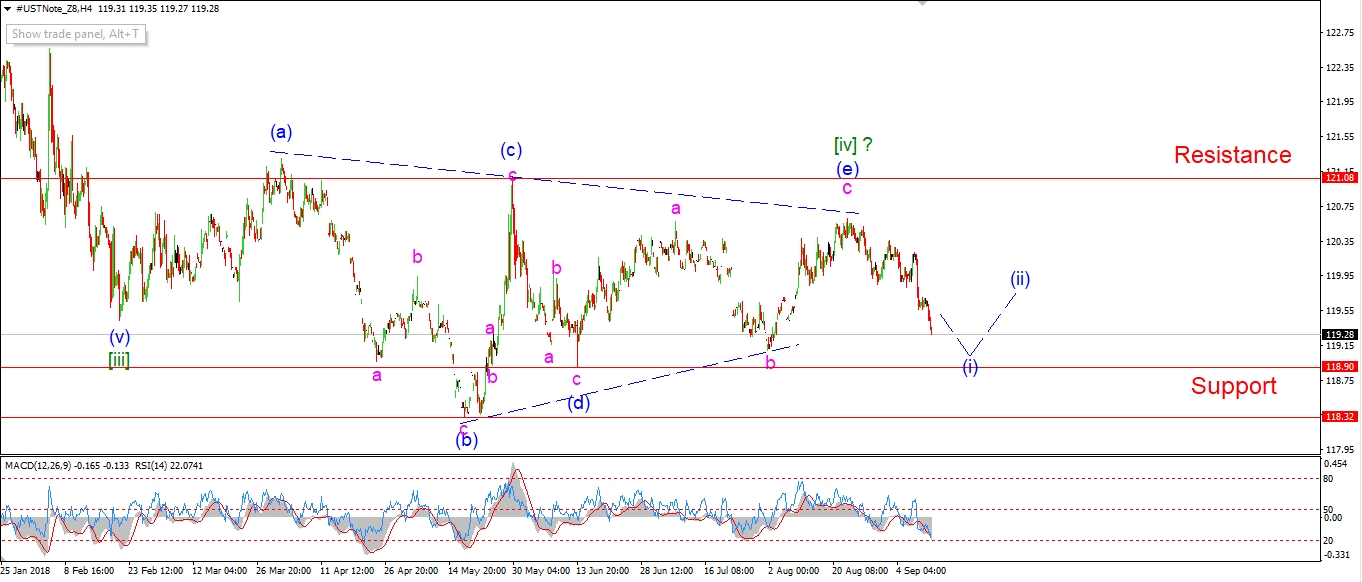 [/vc_column_text][vc_custom_heading text=”Daily” use_theme_fonts=”yes”][vc_column_text]
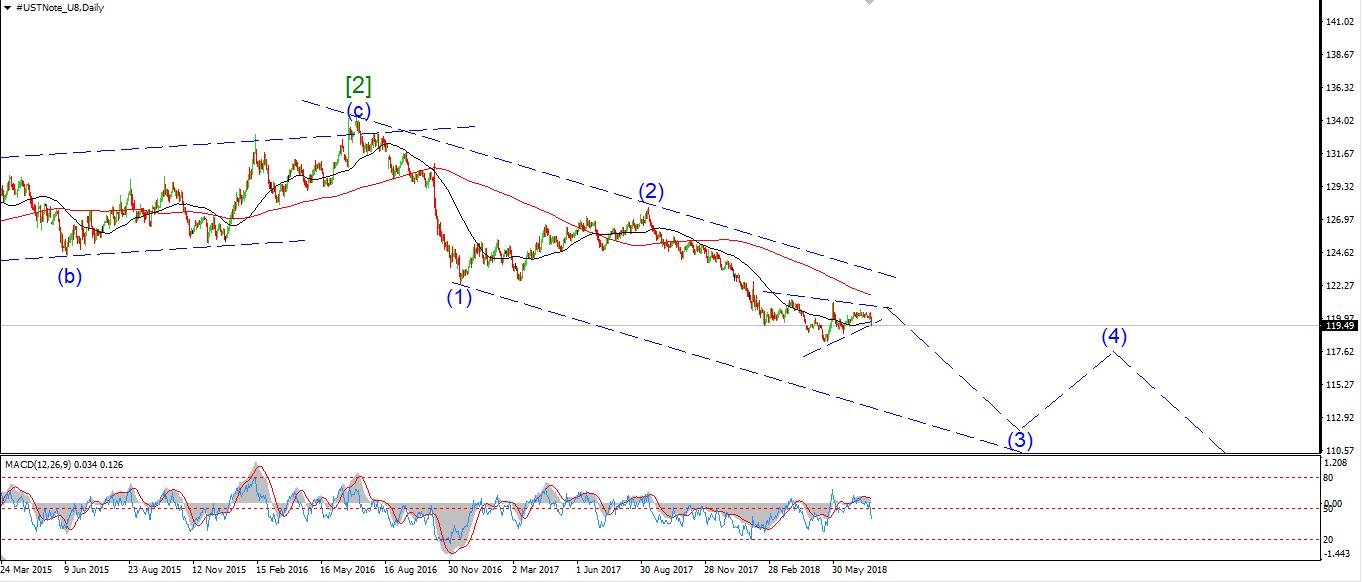 [/vc_column_text][/vc_column][/vc_row]
[vc_row][vc_column][vc_column_text]
The 10yr rose slightly higher today off yesterdays low at 119.27.
There is a chance that wave ‘iv’ pink is now underway.
Wave ‘iv’ pink must not break 119.85,
which is the low of wave ‘i’ pink.
The previous wave ‘4’ at one lower degree lies at 119.66.
So this is the initial target for wave ‘iv’ pink.
Tomorrow;
watch for 119.66 to hold as wave ‘iv’ develops.
Lets see what pattern emerges in wave ‘iv’ pink.
[/vc_column_text][/vc_column][/vc_row]
[vc_row][vc_column][vc_separator border_width=”5″][/vc_column][/vc_row][vc_row][vc_column][vc_column_text]
SILVER
[/vc_column_text][/vc_column][/vc_row][vc_row][vc_column][vc_separator border_width=”5″][/vc_column][/vc_row][vc_row][vc_column width=”2/3″][vc_custom_heading text=”30 min” use_theme_fonts=”yes”][vc_column_text]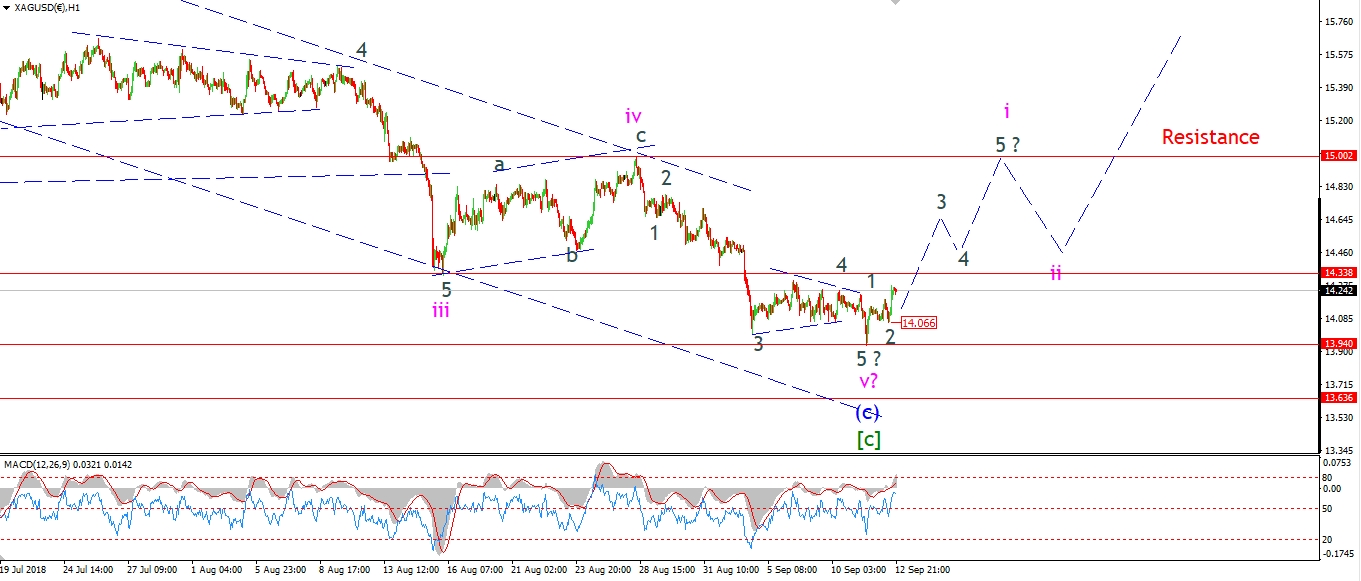 [/vc_column_text][/vc_column][vc_column width=”1/3″][vc_custom_heading text=”4 Hours” use_theme_fonts=”yes”][vc_column_text]
 [/vc_column_text][vc_custom_heading text=”Daily” use_theme_fonts=”yes”][vc_column_text]
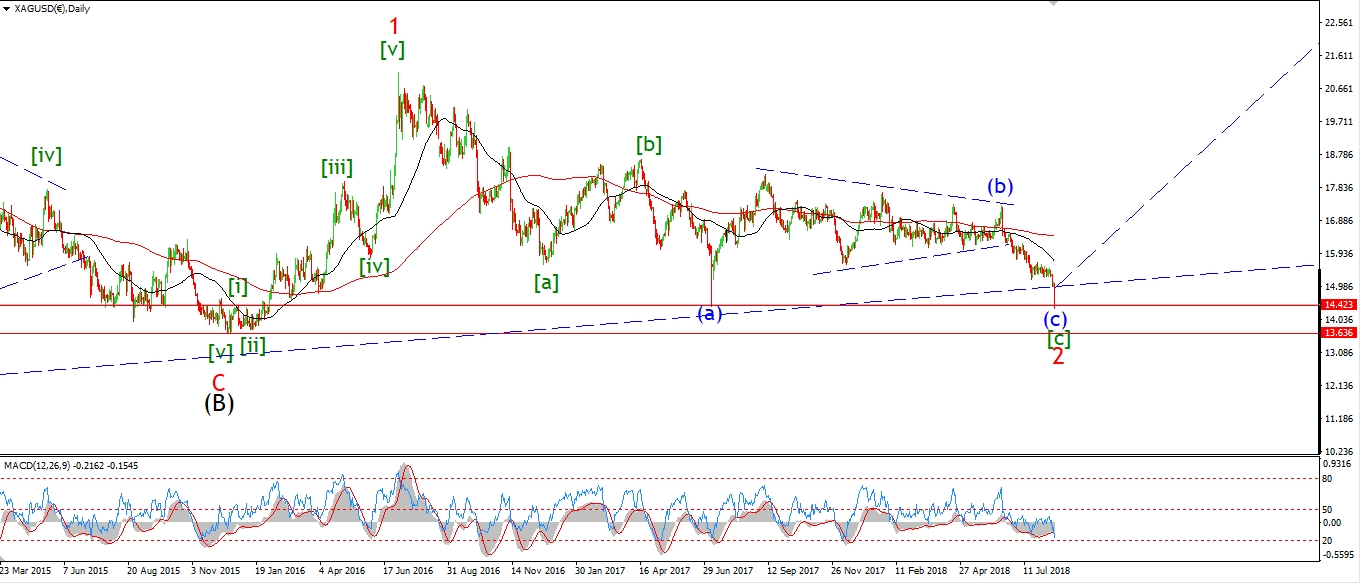 [/vc_column_text][/vc_column][/vc_row]
[vc_row][vc_column][vc_column_text]
Silver is creeping higher off the recent low at 13.94.
The price is back above 14.00 again which is a start!
But we have a way to go before we see a five wave rise complete in wave ‘i’ pink.
Momentum on the 4hr chart has just turned positive again with a break above the centreline today.
So, we are looking good in the short term for a turn higher.
Tomorrow;
Watch for a continued rise in wave ‘i’ pink out of the 13.94 low.
14.06 should hold at wave ‘2’ grey.
[/vc_column_text][/vc_column][/vc_row]
[vc_row][vc_column][vc_separator border_width=”5″][/vc_column][/vc_row][vc_row][vc_column][vc_column_text]
S&P 500.
[/vc_column_text][/vc_column][/vc_row][vc_row][vc_column][vc_separator border_width=”5″][/vc_column][/vc_row][vc_row][vc_column width=”2/3″][vc_custom_heading text=”30 min” use_theme_fonts=”yes”][vc_column_text]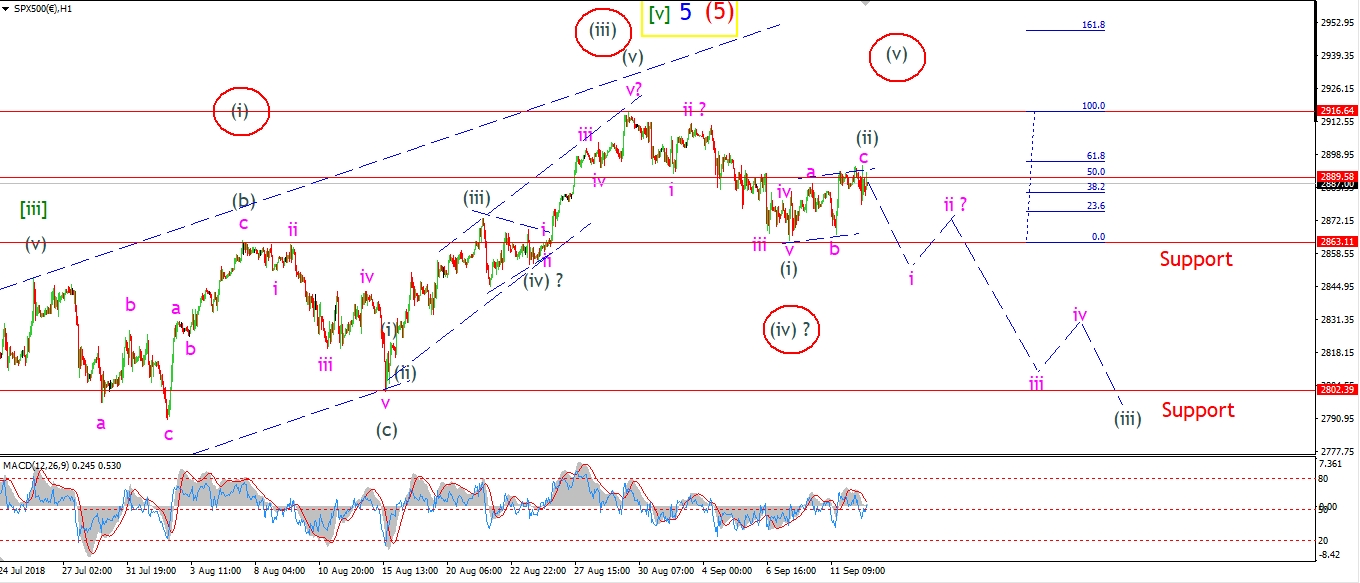 [/vc_column_text][/vc_column][vc_column width=”1/3″][vc_custom_heading text=”4 Hours” use_theme_fonts=”yes”][vc_column_text]
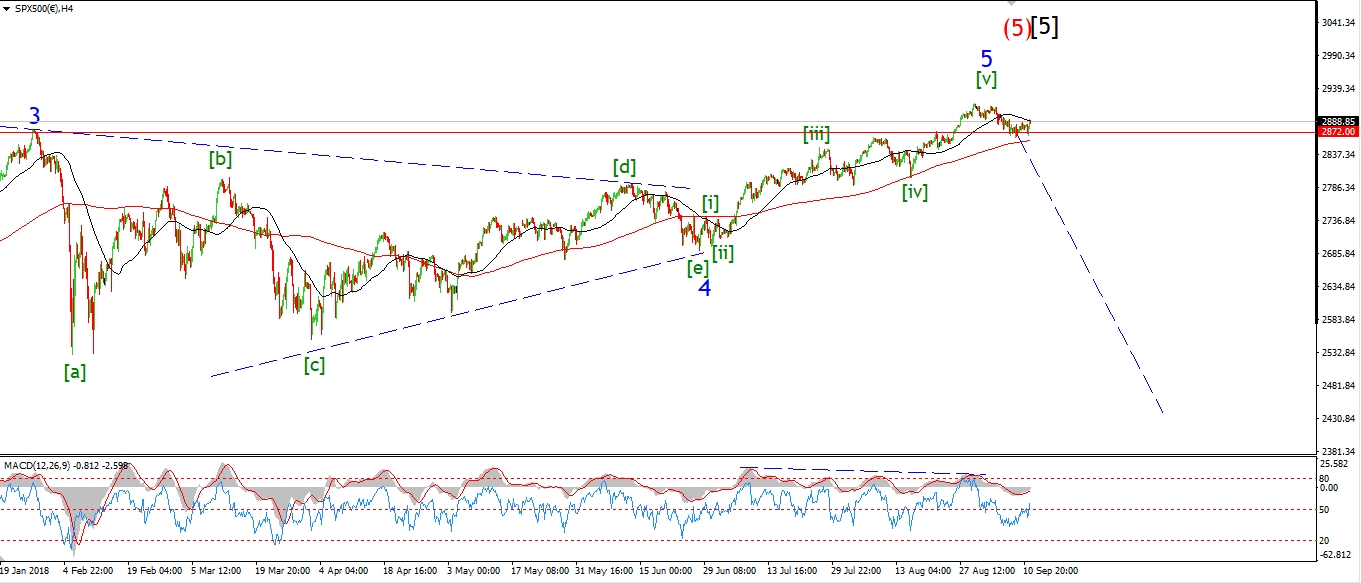 [/vc_column_text][vc_custom_heading text=”Daily” use_theme_fonts=”yes”][vc_column_text]
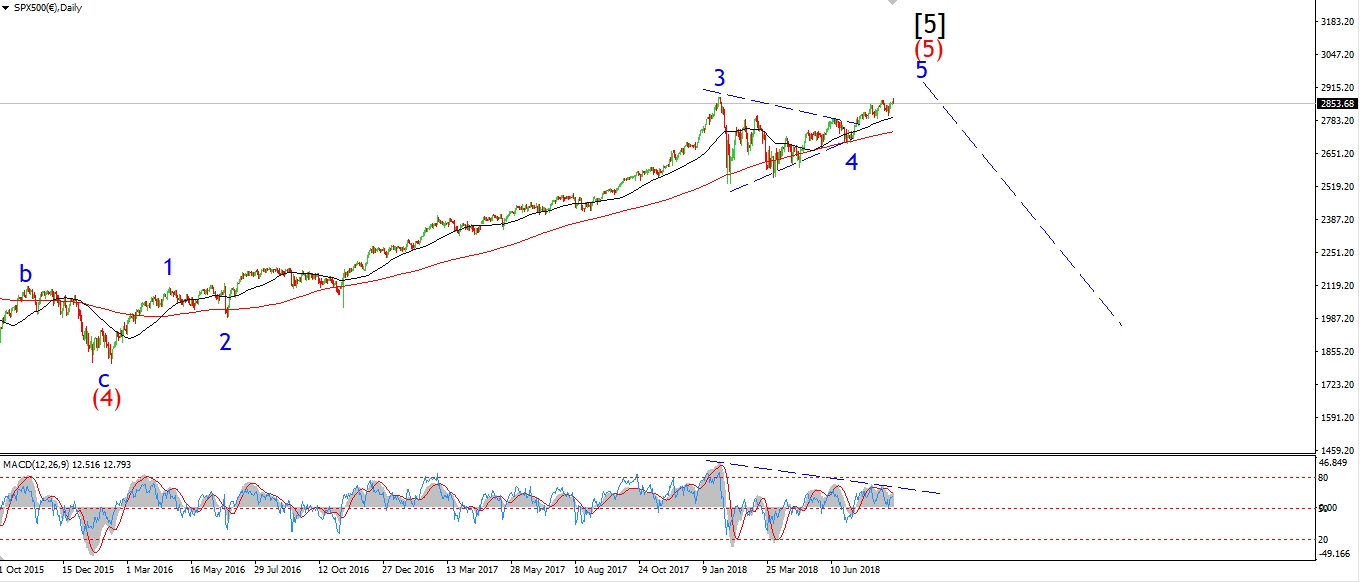 [/vc_column_text][/vc_column][/vc_row]
[vc_row][vc_column][vc_column_text]
The S&P has completed a three wave rally in a possible wave (ii) grey.
I suspect the market was expecting a burst higher from today’s apple launch.
Not so much!
Even apple is off by 1.3% today alone.
And the S&P as a whole is sitting at the 50% retracement level of the previous wave (i) down.
2863 remains my focus in the short term.
And a break of that level will confirm that wave (iii) down is underway.
Tomorrow;
Watch for 2894.50 to hold and a further decline to begin in wave ‘i’ of (iii).
[/vc_column_text][/vc_column][/vc_row]
[vc_row][vc_column][vc_column_text]
[/vc_column_text][/vc_column][/vc_row]
[vc_row][vc_column][vc_separator border_width=”5″][/vc_column][/vc_row]