How does the US trade deficit affect the US Dollar, Or does it even matter?
Trade Deficit definition:
A trade deficit is an economic measure of a negative balance of trade where a country's imports exceeds its exports. In essence, a trade deficit means an outflow of domestic currency from a country to pay for goods, and I terms of the US trade deficit, this means dollars are flowing out of the country and into the hands of others.
[vc_column][vc_custom_heading text="TOP ARTICLES!" font_container="tag:h2|text_align:center|color:%23dd3333" use_theme_fonts="yes"][vc_separator border_width="2"][vc_basic_grid post_type="post" max_items="8" element_width="2" gap="5" item="basicGrid_NoAnimation" grid_id="vc_gid:1489406338111-30fa07c6-e54a-7" taxonomies="19"][/vc_column]
In my last article I examined in relationship between the FED's interest rate decisions and the Dollar value, you can view that article The shocking truth about FED’s interest rate policy and Dollar’s value.
Now I want to focus on another pillar of conventional economic analysis, that is, the relationship between the US trade deficit and the value of the U.S currency.
The questions we want to answer are basic but fundamentally valuable in the long run. As traders we want to find useful information sources to base our trading decisions on.
So the questions we will ask are:
-
Do movements in the US trade deficit affect the value of the dollar?
-
Can we use this information in our trading decisions?
Read on and you will discover some interesting facts on this relationship.
The argument is a simple one, if a countries produce is demanded by the rest of the world they will have to purchase the local currency to buy the produce.
This creates a demand for the currency and should push the value of the currency higher relative to other currencies.
As in my previous article, the best way to examine the relationship is to look at the charts and see what they say to us.
Do movements in the trade deficit affect the value of the currency?
To answer this question I traveled once more into the bowels of the ST. LOUIS FED. To mine their information. I have to credit the FED for some excellent work in creating this database.
Everything else they do distorts the economy, destroys earning power of the middle class and transfers wealth from the population to the government.
But the database is fantastic!
Exhibit number one:
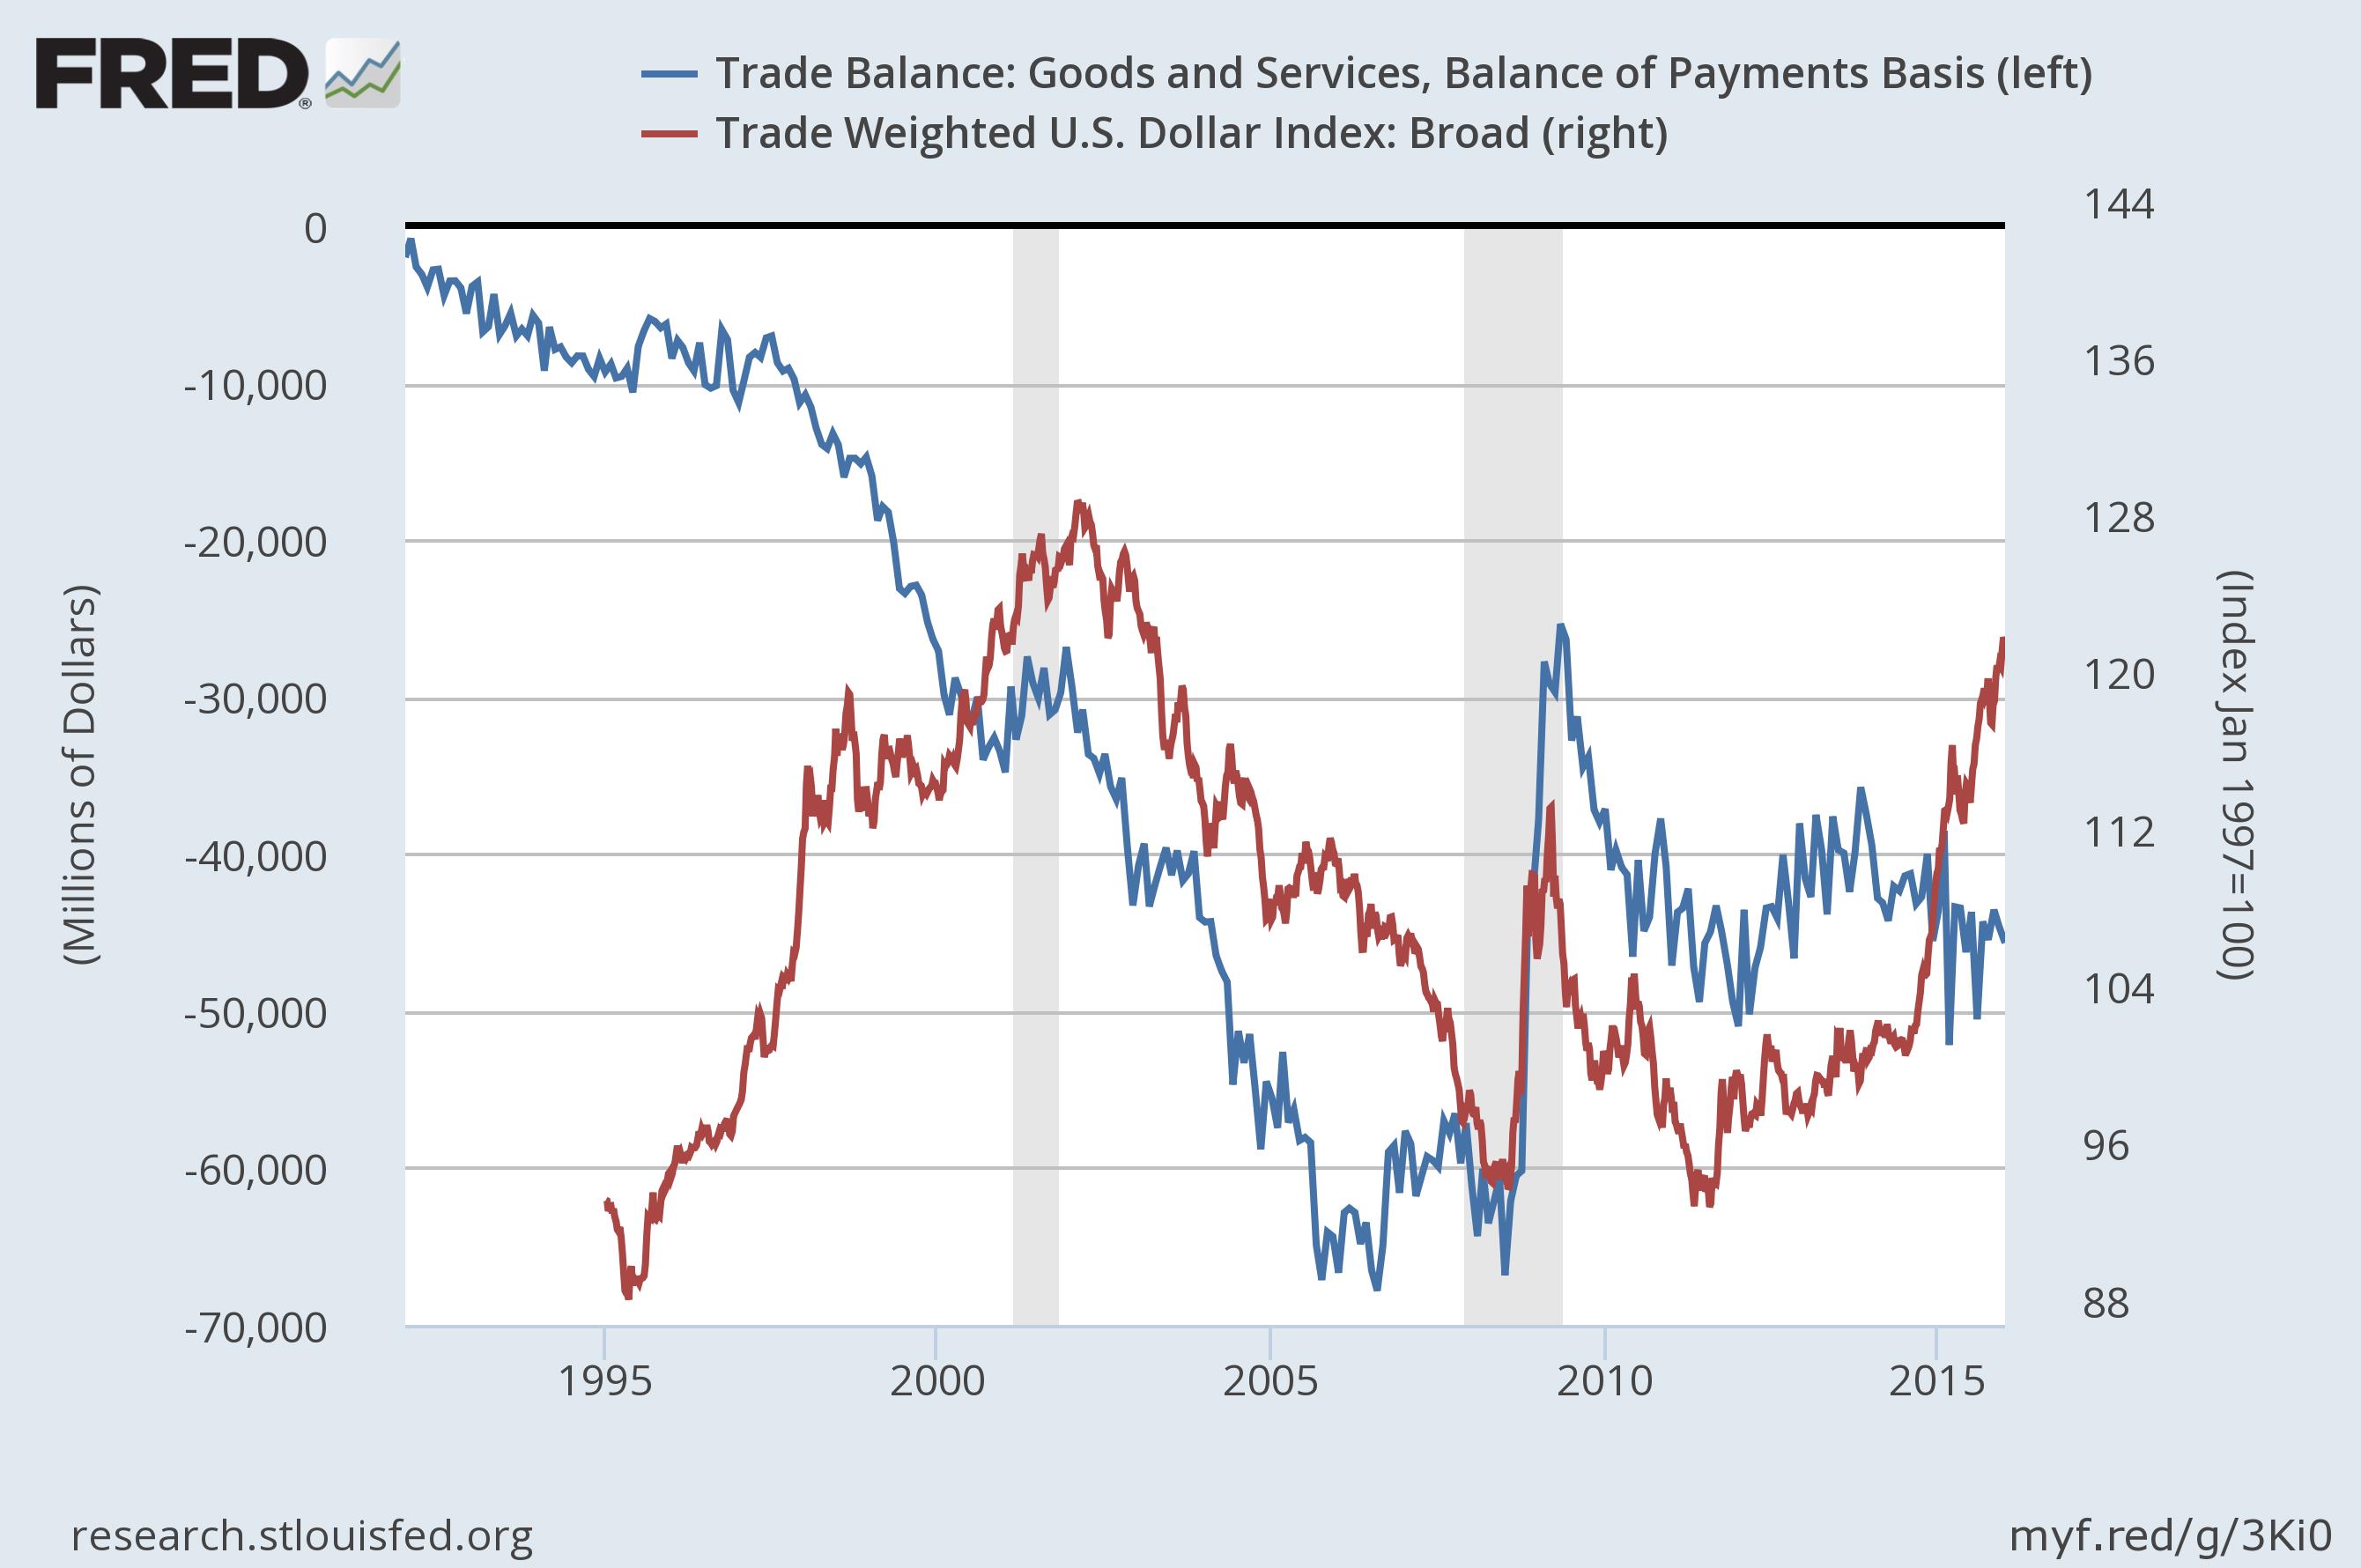
U.S trade balance plotted with the Dollar index 1995 to present. This information can be found here.
The first thing to notice before anything else is said is this, the U.S trade balance has been in negative territory since 1990! this is seriously unhealthy. Even those large spikes upwards denote nothing more than a slowing of the rate of decline.
Needless to say it is not a good state to be in.
So lets take it blow by blow, I will disect each period of major trend changes in the Dollars value and see what is happening with the trade balance at that time.
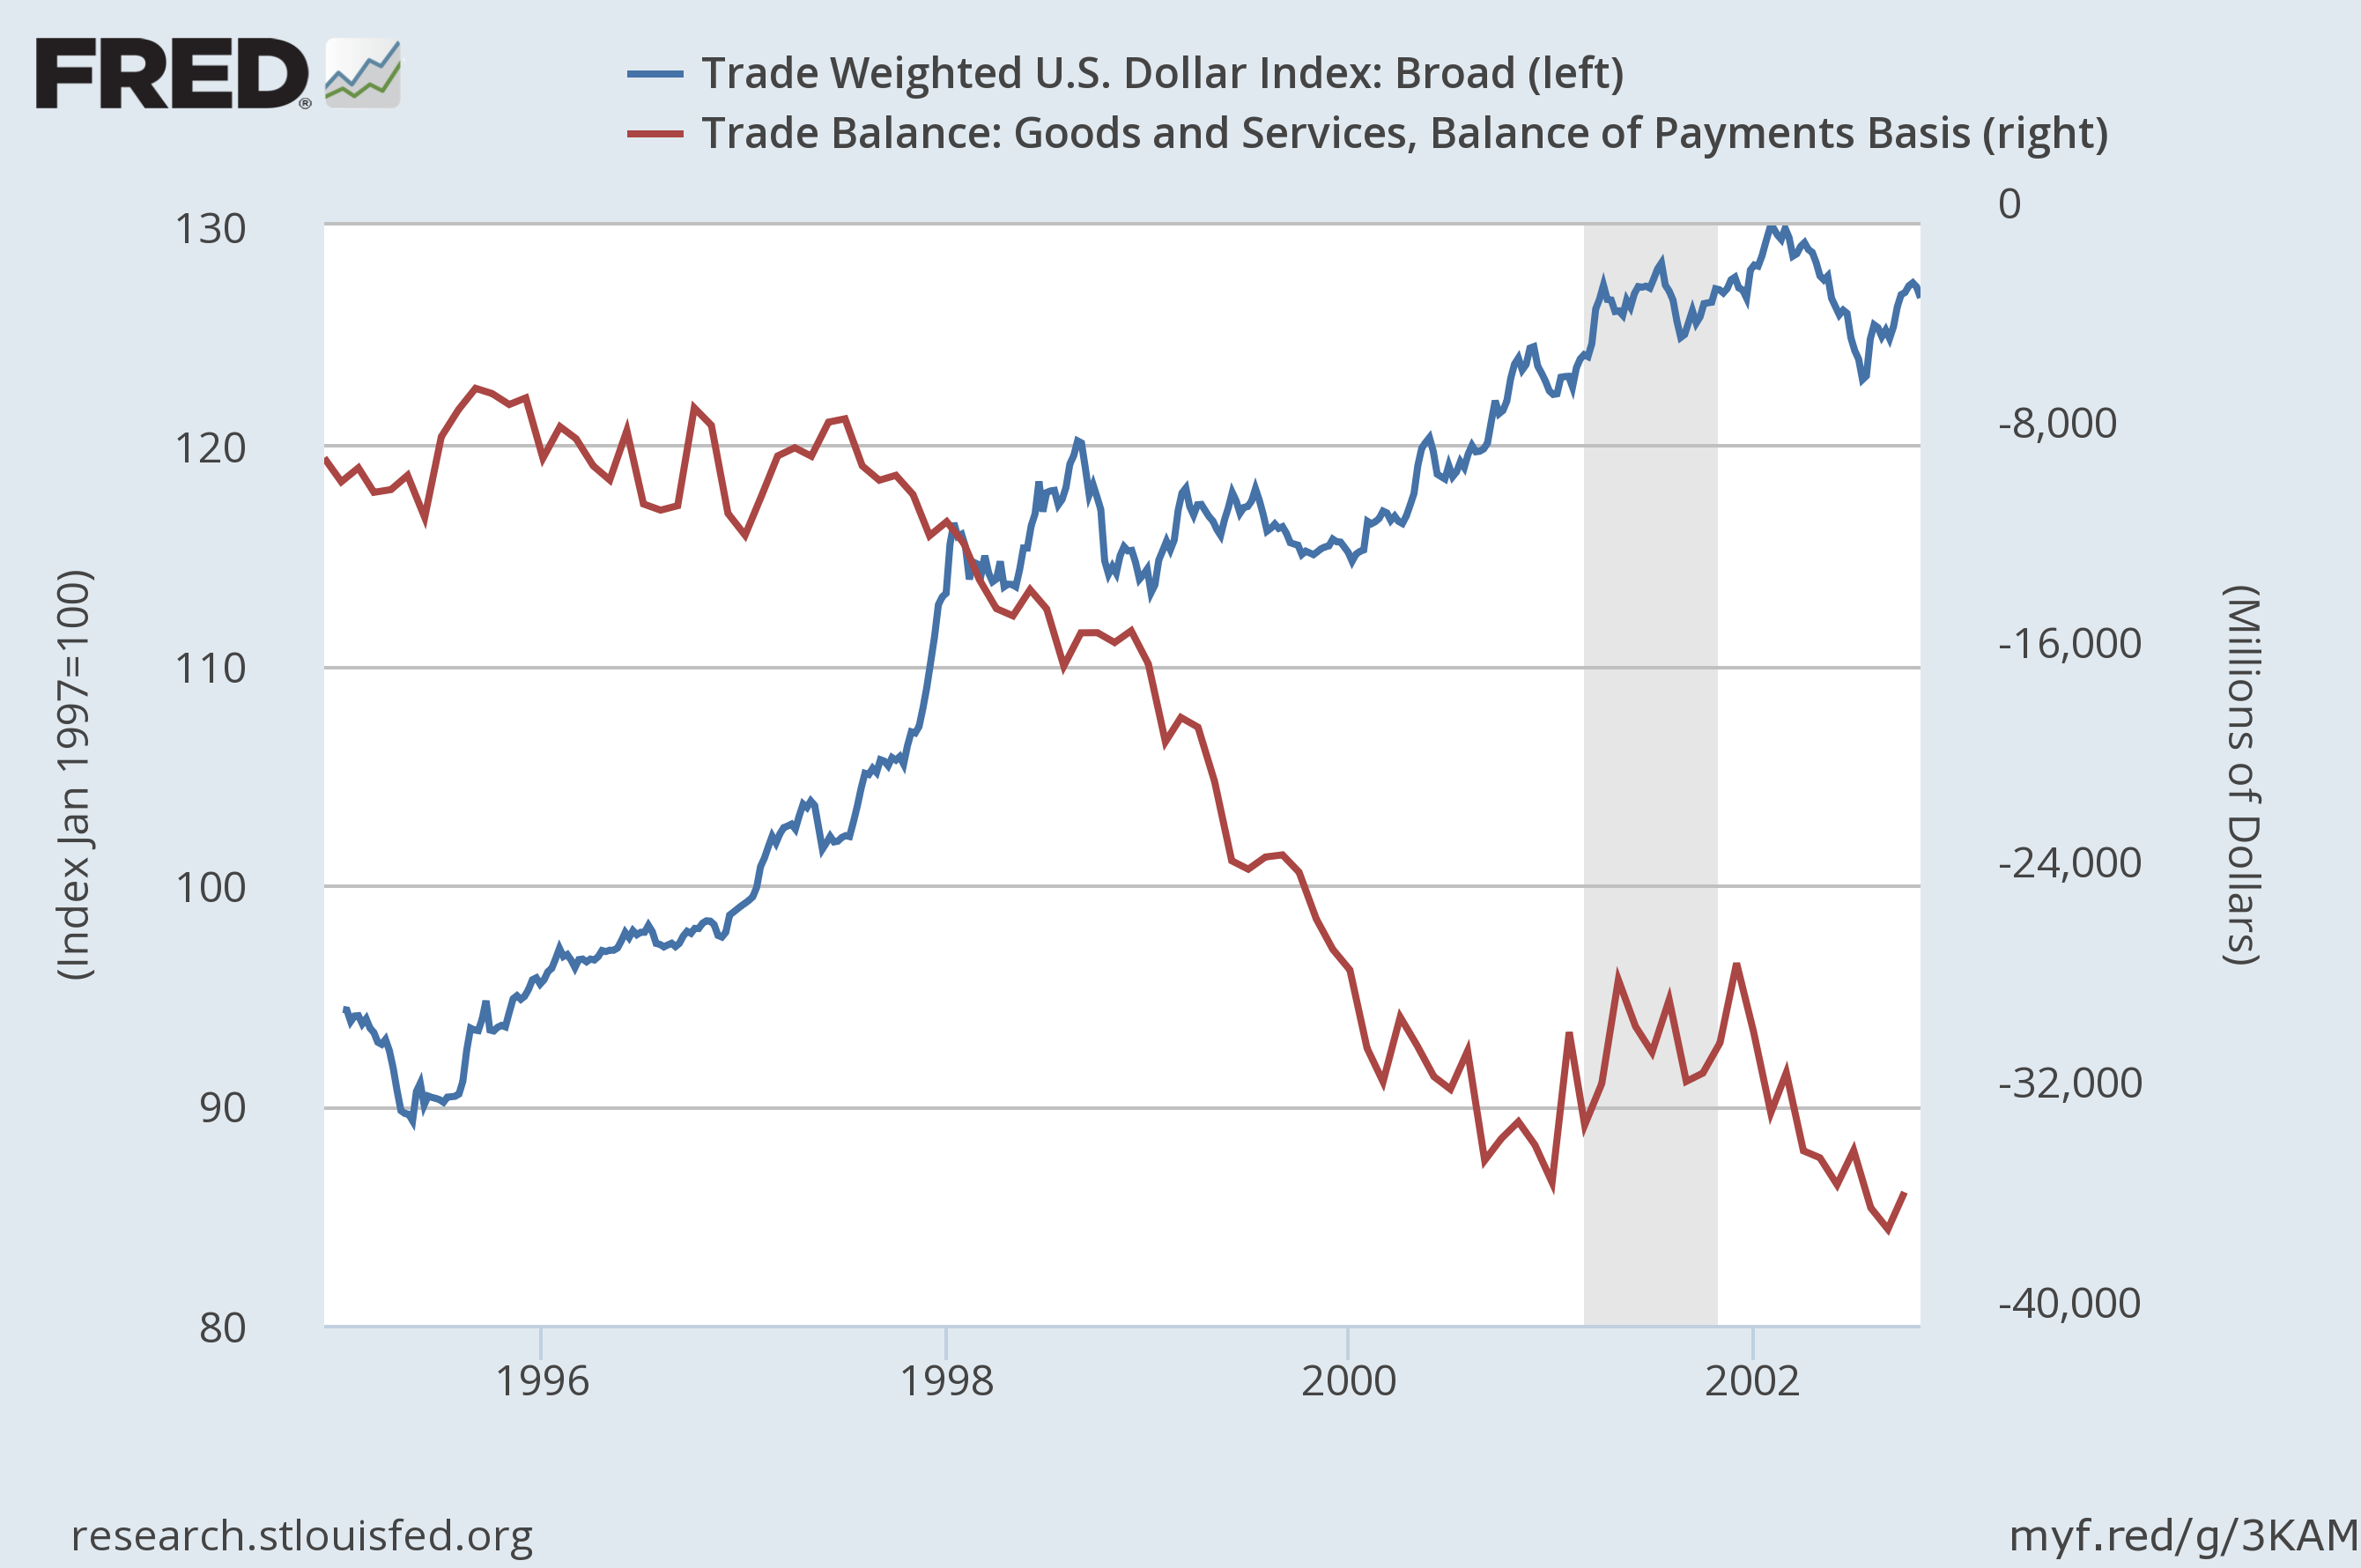
1995 – 2002.
Over this period U.S industry went from a trade balance of negative 10 billion to negative 30 billion dollars per month. That is marked worsening of the situation, don't you think.
You might have thought given the theory that the Dollar would be plunging during this period, but not so!
This was a period of relentless appreciation for the dollar, it started way down at approximately 89 and soared up to 130 in 2002.
That is about 4100 basis points or a 46% appreciation. It was a hell of a trade to be in!
So, to sum this period up, we can say that a worsening trade deficit is great for the Dollar!
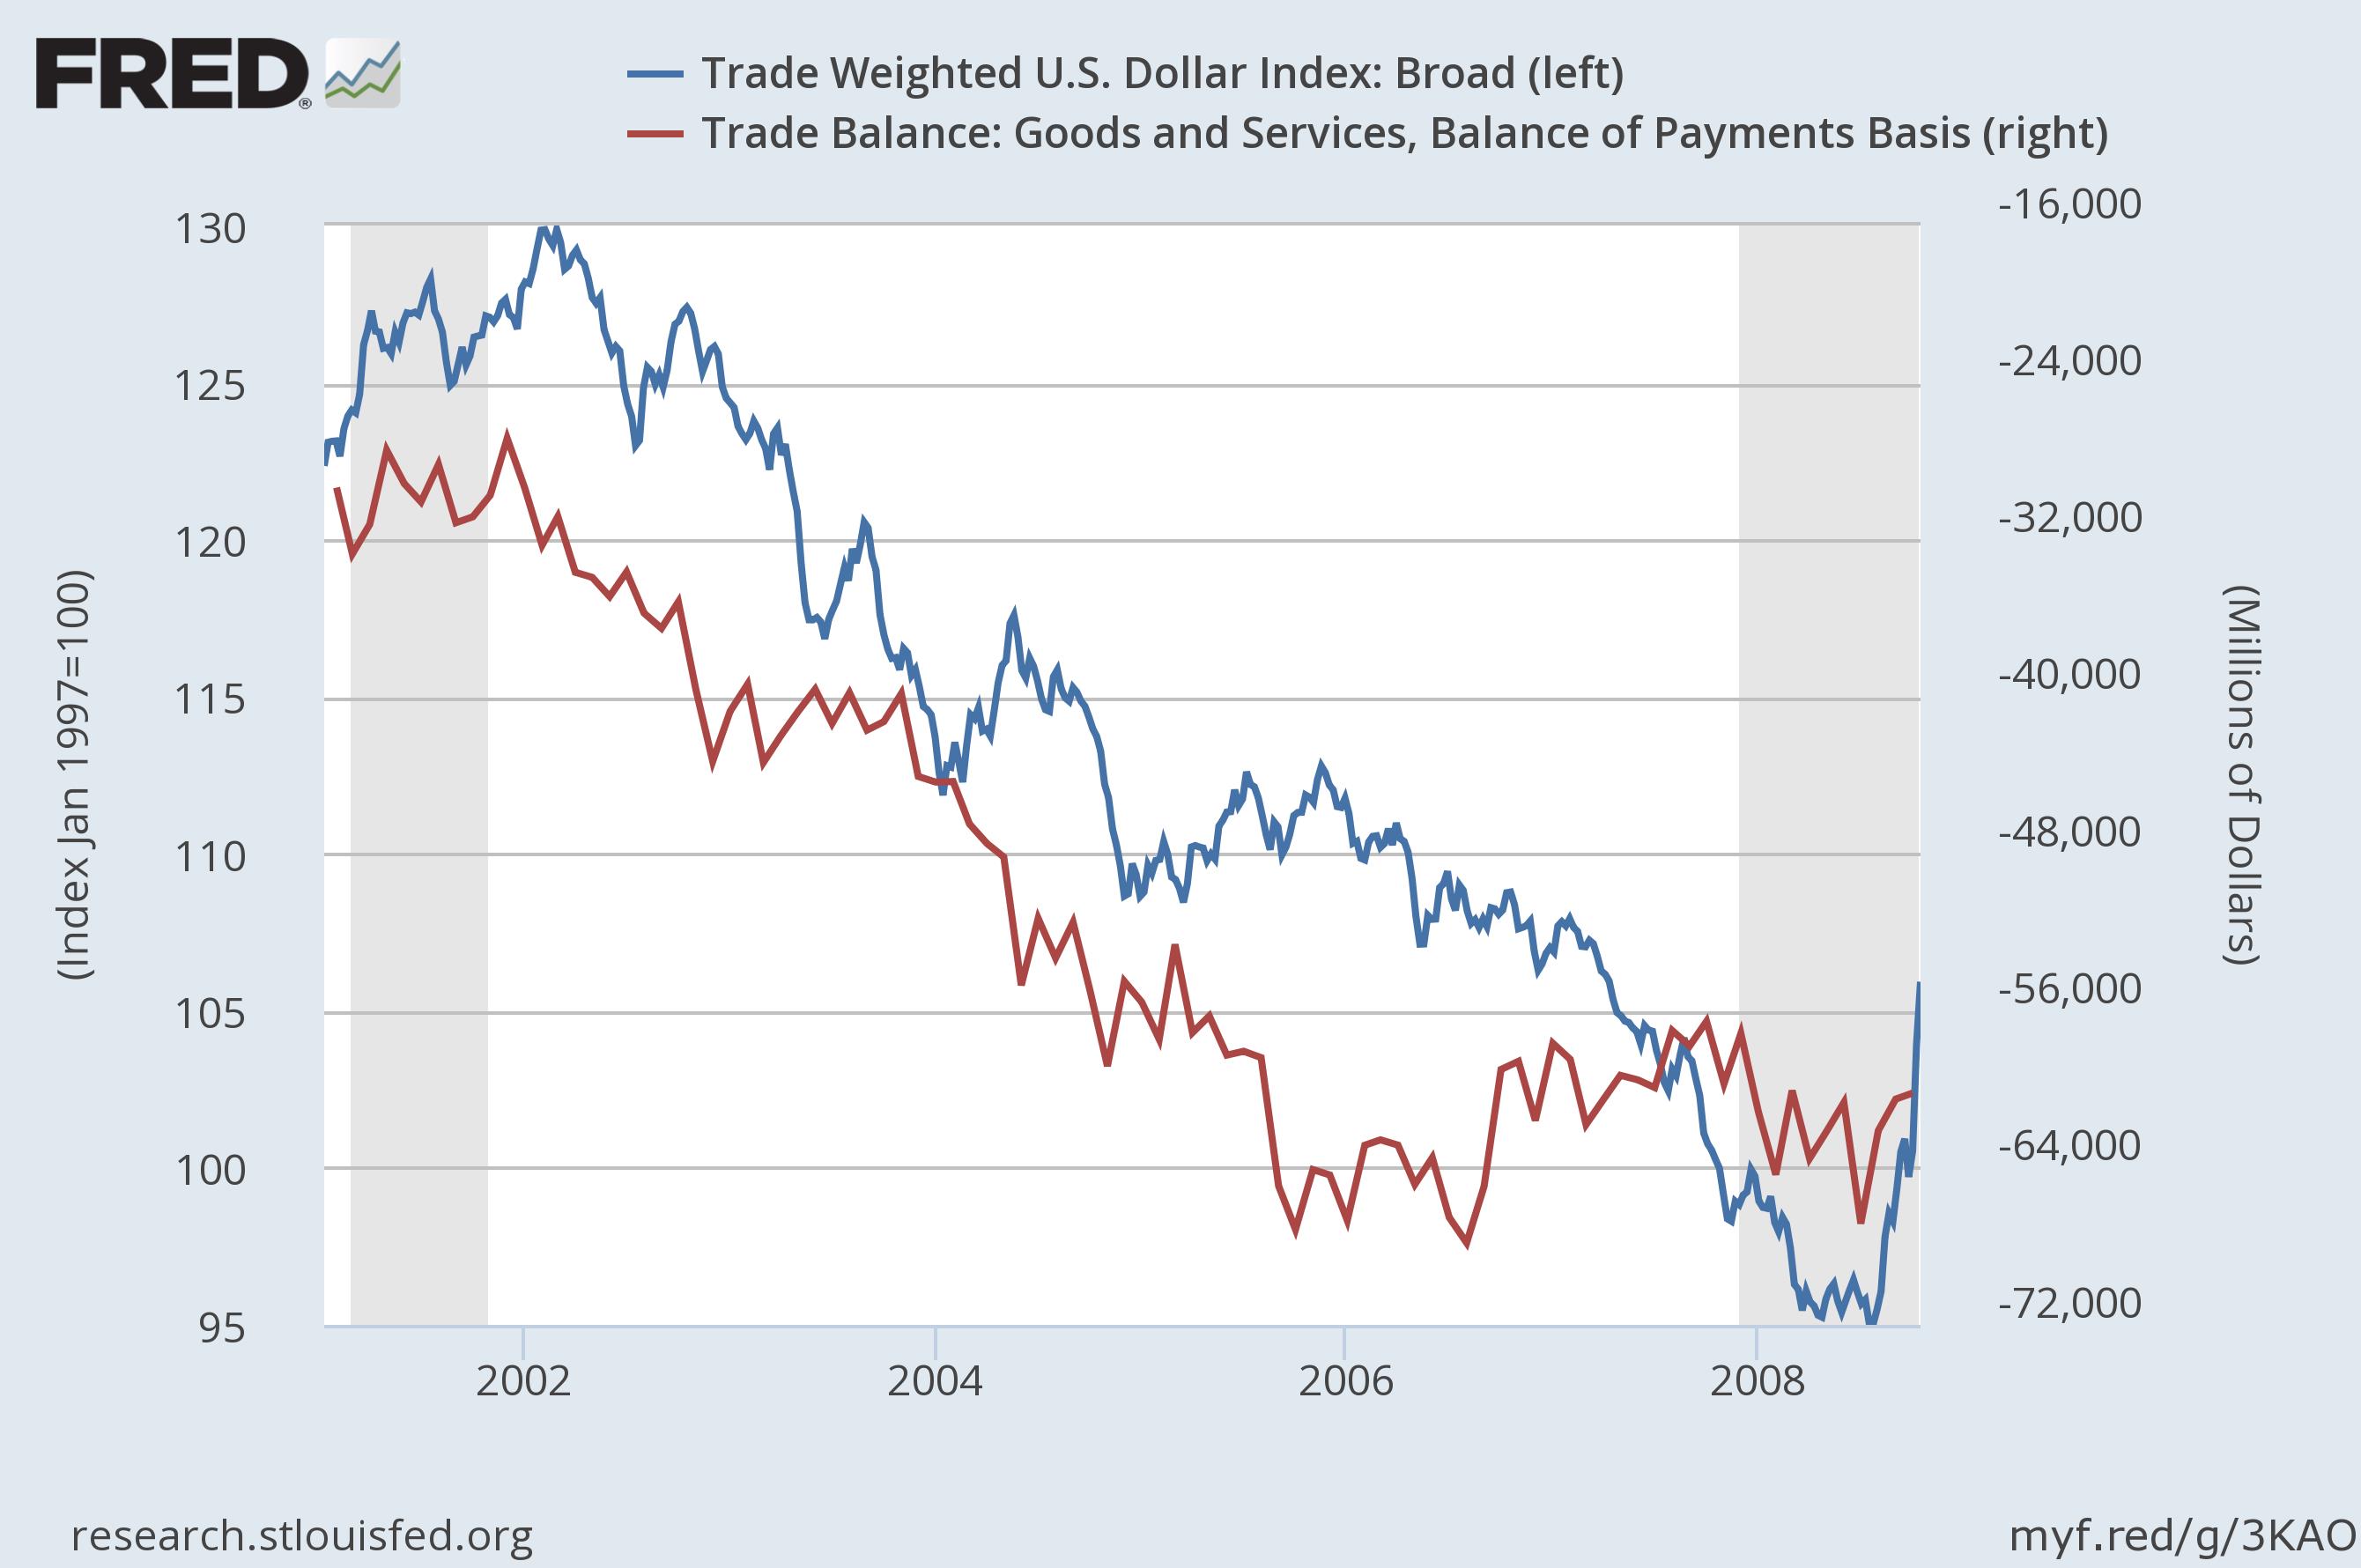
2002 – 2008
After a brief flattening out of the trade deficit in 2001 -2002 the plunge continued and dramatically worsened over the next five years, from a monthly deficit of 30 billion dollars to a deficit of around 64 billion in 2008.
this time the Dollar followed in the trade balance's footsteps. Going from a high of around 130 to a low of 95. In this time the Dollar wiped out most of the gains it made over the 90's.
We can surmise from this period that a trade balance that goes from bad to worse is bad for the currency. But you have to be able to pinpoint how bad is BAD in order to act on the information!
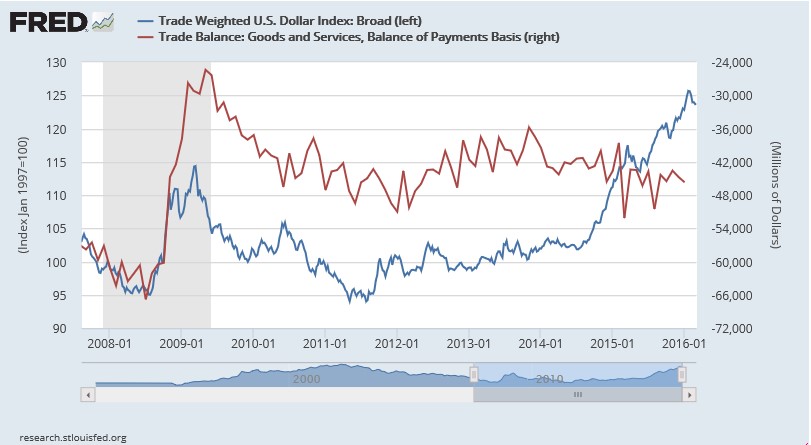
2008 – 2016
As we can see clearly indicated in the dramatic movements of the chart, 2008 was the beginning of the great recession, and in that period the american economy reduced its demand on foreign goods to the tune of 30 billion dollars per month, almost overnight!
The trade deficit started 2008 at negative 68 billion per month and finished 2008 at negative 28 billion per month. While still negative, it is a big improvement.
And as we can see, up until 2014 the dollar moved almost in Lockstep with the trade balance. A worsening trade balance led to a worsening dollar, and visa versa.
Then in 2014 something strange happened. The dollar began a 2400 basis point appreciation to where we stand today at around 125 on the Dollar index
Thats a 25% increase in 2 years!
All the while the trade balance has been steadily worsening, so now we have the two components of our chart going the oposit way again, which puts a dampener on the predictive value of the trade balance on the country's currency again.
The question remains:
Can we use this information in our trading decisions?
And the answer is.................... NOT REALLY!
While there have been periods of highly positive correlation between the two series. There has also been periods of highly negative correlation also, to the tune of almost -1!
It might even lead you to ask why is a trade deficit bad!
As we found with our previous look into the world of conventional wisdom, regarding the feds interest rate decisions and the dollar value, we cannot relay on the trade balance information to direct our trading decisions either.
Trade balance has its uses, just not in trading the FX markets! Best leave this 'wisdom' where it belongs, in the halls of academia.


