Back at the end of November GBPUSD was drifting along in a ranging sideways pattern for about a month in total.
The price never budged out of a 250 pip range and continued to tighten as time went by.
This action was typical of a pattern called a contracting triangle shown below.
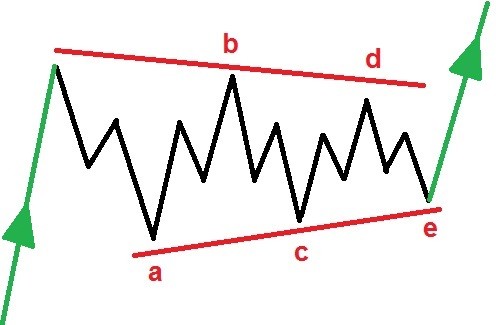
Here is the step by step run through how this pattern played out in real time and produced a big rally out of the triangle in a fifth wave.
On the evening of November 22nd I introduced the contracting triangle pattern in the wave count for GBPUSD.
The pattern suggested that we would see a few more days of sideways action in wave (iv), followed by a rally in wave (v).
Here’s the chart from November 22nd;

The price range continued to contract session after session, and followed the triangle wave pattern perfectly.
Wave ‘d’ and ‘e’ were left to complete the pattern in wave (iv) the next week, and then we were ready to rally again in wave (v).
Here’s the chart from the 25th of November;

On the following Monday, the price rose into wave ‘d’ to form another lower high as per the wave count.
Now we needed a final drop in wave ‘e’ to complete the larger wave (iv) and set us up for that rally in wave (v).
Here’s what I said that night;
Cable is holding steady in that triangle pattern today for wave (i).
The price rose today to begin a possible wave ‘d’ of (iv),
That level should continue to hold tomorrow as wave ‘d’ completes.
And wave ‘e’ should then drop back again.
Here’s the chart from the 26th of November;

That small drop in wave ‘e’ was the final part of the puzzle for a completed contracting triangle in wave (iv).
The next step was to confirm that wave (v) was underway with a impulsive break out of the trading range.
Here’s what I said that night;
if we see a rally up above 1.2912 again,
that will signal a rally in wave (v) has begun.
And wave (v) could carry us up to about the 1.32 level,
with a small chance of hitting 1.3380 at the next significant resistance level.
Here is the chart from the 27th;

Everything was lining up nicely for a rally in wave (v). the initial move out of the triangle looked impulsive in wave ‘i’ and ‘ii’.
So wave ‘iii’ of (v) was set to rally up towards the 1.33 level which was mid target range for wave (v).
Here’s what I was expecting that night;
If wave (v) has begun,
then we should see 1.2827 hold for the coming few days,
and a five wave rally out above 1.2983 at a minimum.
Price could possibly hit as high as 1.3200.Watch for wave ‘i’ of (v) to push up to initial resistance at 1.2983.
Here is the chart from December 3rd;

Wave ‘iii’ of (v) was underway with more expected to complete the pattern. The rally in wave (v) needed a clear internal five wave pattern itself so there was still good upside potential.
Here was the conclusion that night;
Watch for wave ‘ii’ to hold at 1.2878,
wave ‘iii’ up is set to rally into the 1.3300 handle before correcting in wave ‘iv’.
Heres is the chart from December 5th;

Wave ‘iii’ of (v) lifted the pattern well out of the previous trading range and opened up the possibility for a higher target in wave (v).
Wave ‘iv’ was expected to correct first, before the final high was reached.
Here was the nights analysis;
Wave ‘iii’ of (v) has pushed higher today,
but we should see wave ‘iv’ come in tomorrow
and price should correct off the high back below 1.3100 again in three waves.
Wave ‘v’ of (v) could push to the 1.3380 level at a stretch,
Here is the chart from December 6th;

Wave ‘iv’ of (v) has begun with a small three wave decline off the highs of wave ‘iii’.
Corrections can develop in many forms and this was true especially of this small fourth wave!
But the rally was still expected to carry on higher.
Cable has also dropped in three waves into the low of the session today.
This decline is viewed as wave ‘iv’ of (v).If we see a rally back up above 1.3167 again at wave ‘iii’,
that will signal wave ‘v’ of (v) has begun.
Here is the chart from December 10th;

Wave ‘iv’ looked like it was going to trace out an expanded flat correction.
So we needed one more low to complete a three wave correction before rallying in wave ‘v’ of (v) and reaching the target area.
Wave ‘iv’ is an expanded flat which explains this corrective high.
So we should see another drop back into 1.3050 to complete the pattern starting tomorrow.Tomorrow;
Watch for wave ‘iv’ to complete with a drop into 1.3050 again,
then we can look higher in wave ‘v’ of (v).
Here is the chart from December 12th;

Wave ‘iv’ completed with a spike lower early in the sessions and then wave ‘v’ began with a rally into the close.
Wave ‘iv’ turned out to be a bit wild, but in general, all was going to plan in wave (v).
The upside was still favored, and 1.3380 formed the next resistance level and that is where the target lay for wave ‘v’ of (v).
The sharp drop off last nights high is now viewed as the final leg of an expanded flat correction.
I have shown wave ‘iv’ of (v) complete at this evenings lows.
The price has rebounded well off the low and this should be the beginning of wave ‘v’ up.
Wave ‘v’ is set to carry up to resistance at 1.3380 to complete a larger expanded flat correction in wave [2].
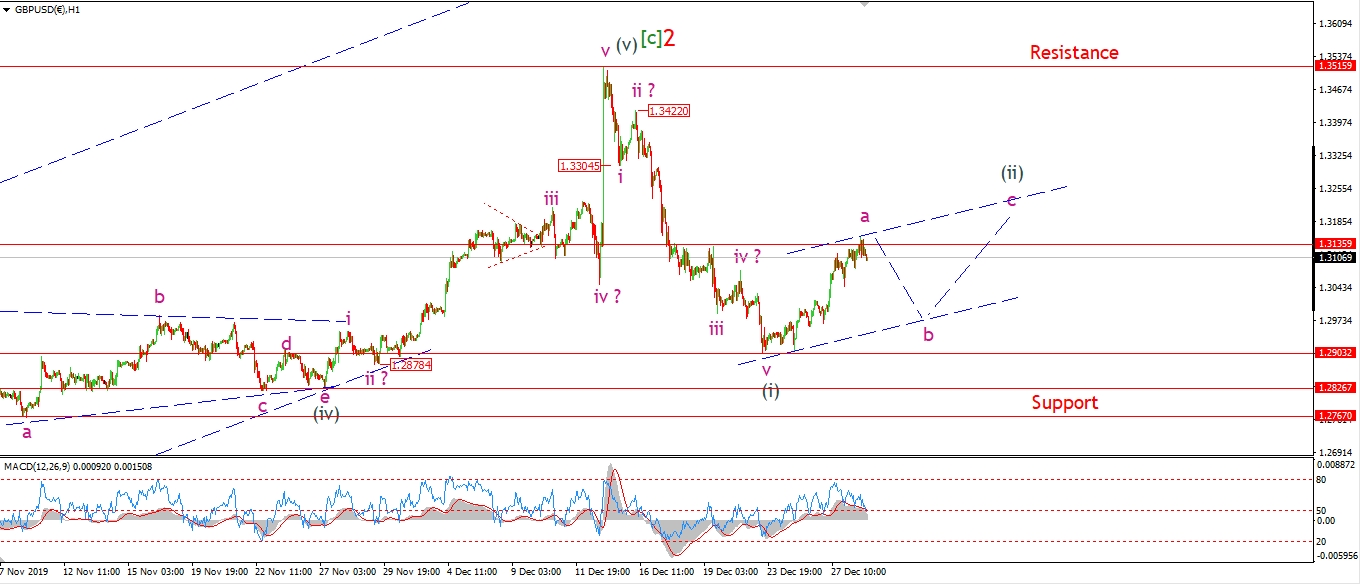
Here is the chart from December 16th;

Wave ‘v’ of (v) created a massive spike higher and reached 1.3515 at the high.
The target area was met and then some, and the pattern in wave (v) completed a perfect five wave pattern internally.
This pattern also completed a larger wave [c] and now the pattern was calling for a large decline to wipe out all the gains of the previous rally!
That is exactly what has happened so far, so where will GBPUSD go next?
Here is the latest chart for GBPUSD showing the whole pattern so far.