
Do you you find it hard to catch market turning points with Elliott wave.
I use the RSI reading along with an Elliott wave pattern to do just that.
Heres a quick chart showing the basics;

By keeping an eye on the RSI reading while a wave pattern is unfolding,
you can discern if the wave count:
– is just beginning,
– extending the internal structure,
– or about to end in a bang!
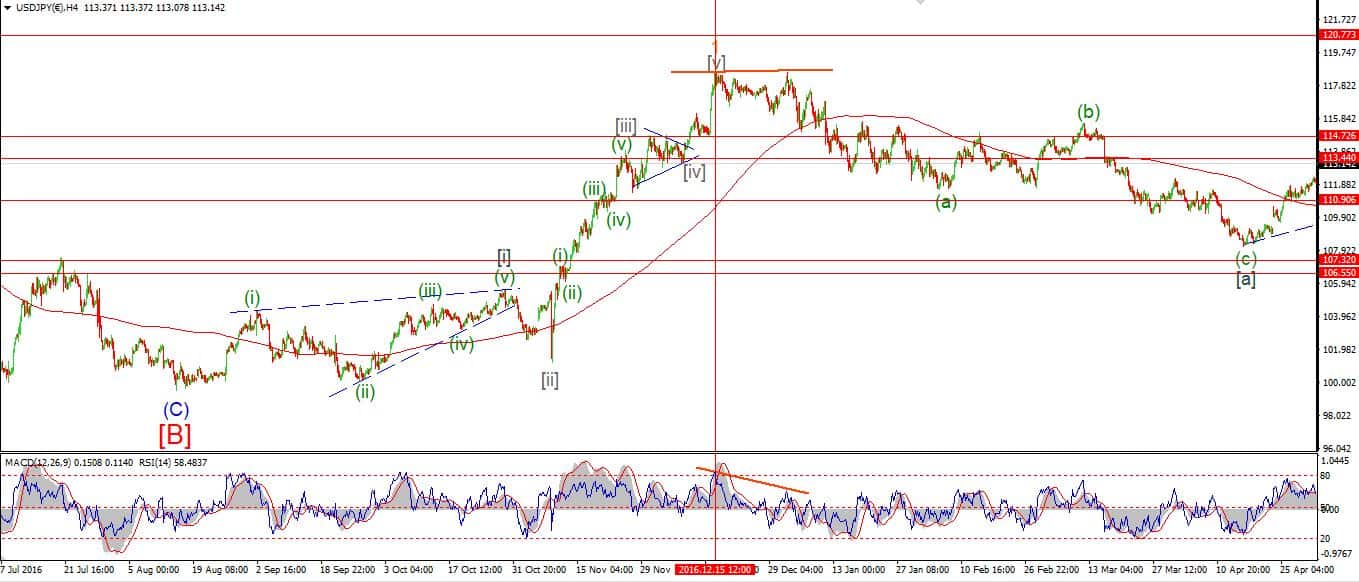
Here’s a good example in USDJPY:
Bullish Divergence at the bottom:

Bearish Divergence at the top:
There are three quick rules of thumb for using Elliott wave analysis along with the RSI indicator.
The beginning of the trend:
- RSI will diverge positively and create a bullish center line cross on the 4hr chart, while the price decline loses momentum, this will signal that the price is coming to the end of its decline and will likely turn up soon.
During the trend:
- when the trend takes hold during wave 3, RSI will usually remain above the 40 level until the top is reached.
The end of the trend:
- As the price approaches the end of the road and wave ‘5’ is under way, the 4hr RSI will diverge negatively and cross the center line in a bearish downside cross before the price tops out.
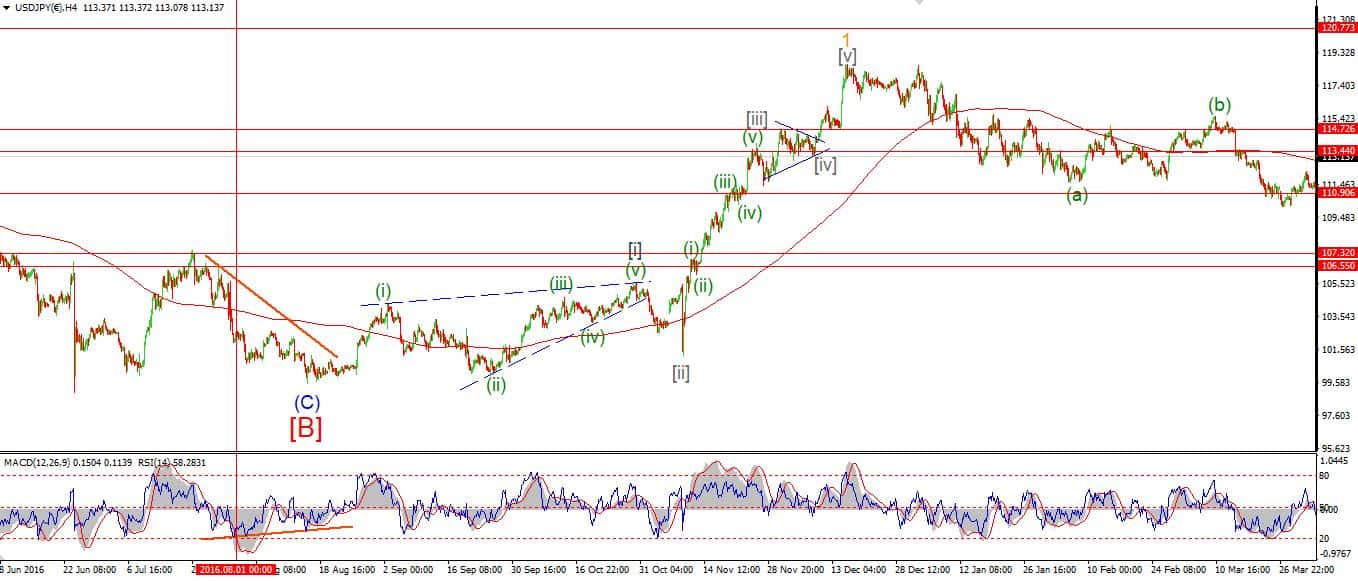
Here is an example of those RSI guidelines in action.
Bullish divergence at the low:
On a recent 4hr chart of USDJPY,
I was watching a significant bullish divergence to the upside on the 4hr chart, while the price continued to slide downwards at the end of a ‘C’ wave.
The price was loosing downside momentum at the end of a correction, and the RSI was indicating that a turn was on the cards.
RSI support in wave 3:
AS the third wave rallies higher, the RSI indicator in the 4hr timeframe tends to remain above the 40 level for the duration of the wave.
Third waves hold the power of a trend move, and as such, the momentum remains at its highest during that time.
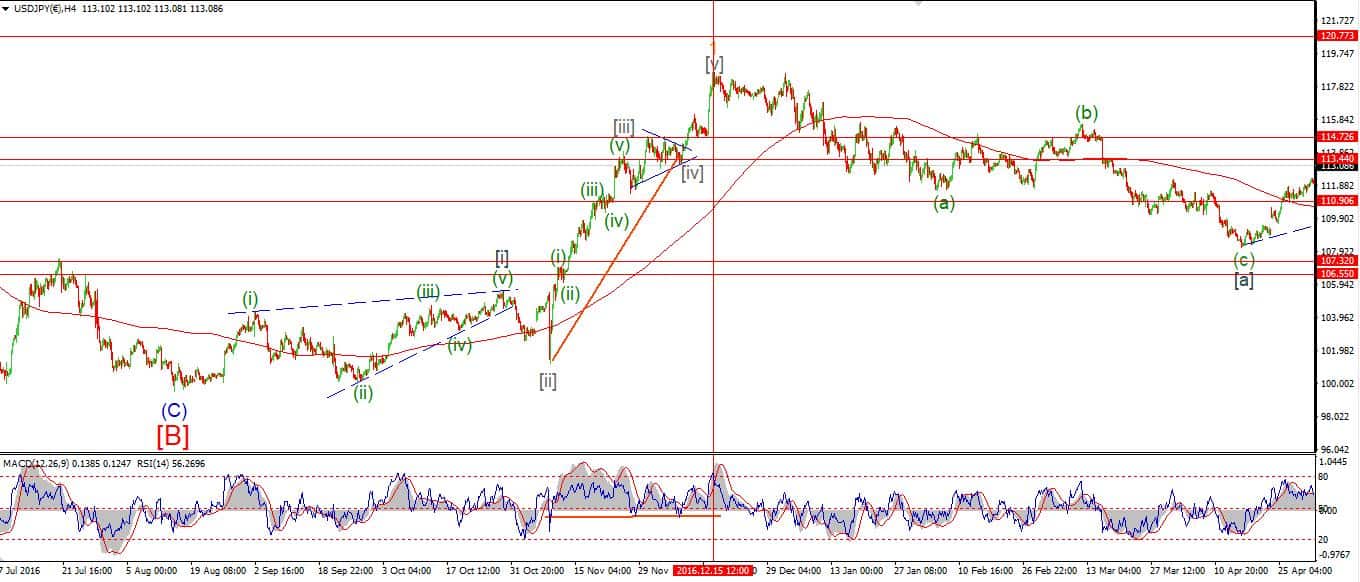
Bearish RSI divergence at the high:
AS the fifth wave tops out,
the RSI indicator in the 4hr timeframe tends to turn down in a bearish divergence before the top arrives.
The RSI will usually register a sell signal with a downside cross of the center line also at this time.

So;
As you can see from the above example, the RSI can guide your wave interpretation along with giving you a warning at potential highs and lows.
Now I will dive a bit deeper into the three rules of thumb.
what the heck what does it mean?
The RSI indicator is a smoother indicator than MACD, as it uses the exponential moving average, it tends to be more consistent.
So, in general, the RSI works as follows;
If the indicator is below 30, then the price action is considered oversold.
If it is reading above 70, then you are reaching an overbought situation.
Because the RSI is used as a tool to indicate extremes in price action, it is very tempting to use it to place contrarian trades,
If you buy into a market when the indicator crosses 30 to the upside, you are counting on the price trend reversing. And on the flip-side when the RSI crosses down below 70 towards the center line, you can use this a sign that the market is completing an uptrend, and so you enter short!
It is easy to gravitate to the RSI when trading for the first time, but as with all things in life, I wish it was that simple.
So, how should we use it then?
ELLIOTT WAVE AND RSI IN TRENDING MARKETS:
In the beginning I start with the Elliott wave count.
If I’m thinking about entering a trade, I want to see a completed wave structure on the chart.
When the wave structure is complete which calls for a turn in the market, I then look at the RSI add weight to my wave count.
The RSI is a great tool to show a shift in momentum in a market which can also be indicating a change of trend.
This is where we should sit up and take notice!
So I’m gonna take you through a few examples where combining RSI with Elliott wave analysis can really boost your analysis and in turn, your trading.
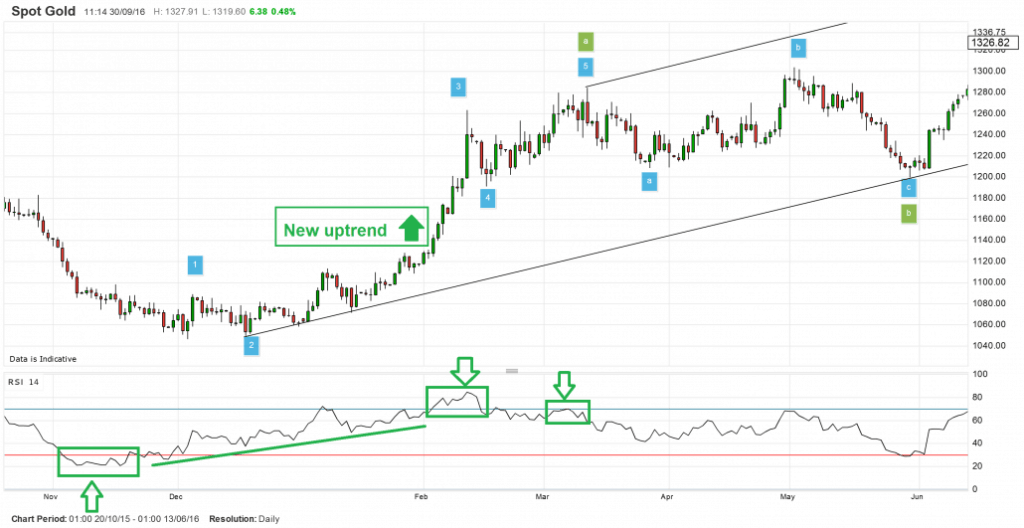
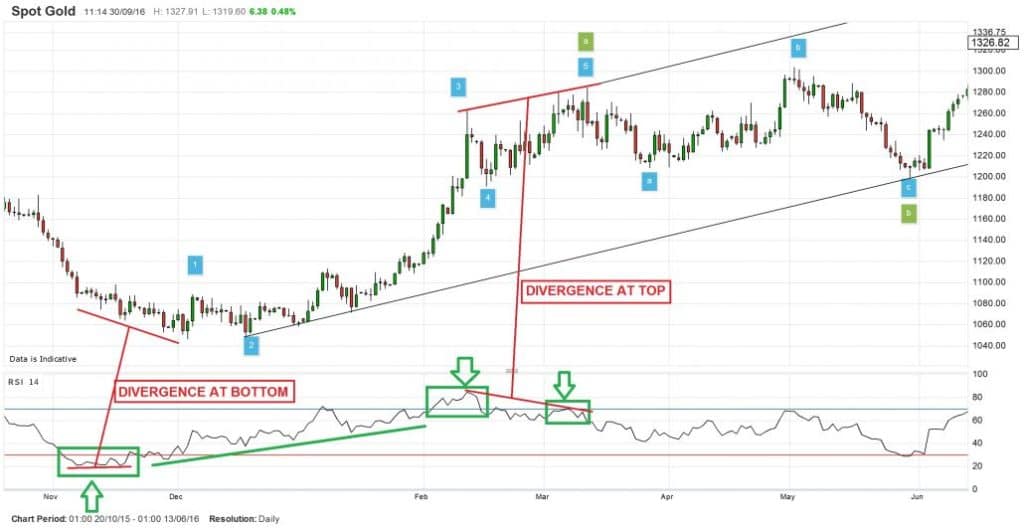
Below is a chart of the GOLD price off the recent lows at 1145.
This level was a major turning point in the trend and was marked first by a completed elliott wave correction to the downside.
The Elliott wave pattern completed while the RSI flattened and began to diverge away from the price.
The thing thing I looked for is an impulsive rally to a higher low off the extreme low.
The change in trend starts with a five wave pattern to the upside, followed by a three wave corrective decline.
This happened relatively quickly and I labelled the chart as wave ‘1’ to the upside, at this point both Elliott wave and RSI are indicating that a turn is on the cards.
The RSI then registered a bullish signal with a centreline cross.
All we needed then was a three wave correction in wave ‘2’ and the market was set for a powerful rally in wave ‘3’, the trade was now on.
A low risk strategy is to place a buy order at the wave ‘1’ high, with a stop at the low of wave ‘2’, wave ‘3’ should carry the price higher and into the money very quickly.
On this occasion, combining Elliott wave and the RSI indicator really worked out.
No method is fool-proof, but using Elliott wave with RSI most definitely helps to reduce your capital at risk.
ELLIOTT WAVE AND RSI DIVERGENCE AT TOPS AND BOTTOMS:
Looking back at that gold trade again.
As I mentioned above,
Bullish divergence can be seen developing as the price flatlined at the end of a long correction.
That is your first hint that the price is about to turn in your favor.
That divergence between the RSI and price heralded in the largest rally in the gold price in 9 months.
Again as the price approached the highs.
The RSI begins to diverge and create a lower high, the rally is faltering at this point and the Elliott wave pattern is also signalling that the rally is over for the moment.
At this point the trader should consider closing the position.
ELLIOTT WAVE AND RSI SUPPORT AND RESISTANCE ZONES:
Here is another rule of thumb to note:
- RSI resistance in a rally occurs between 50 and 60,
- and RSI support in a rally occurs between 40 and 50.
Lets see how that works out in trending markets.
Resistance in a downtrend.
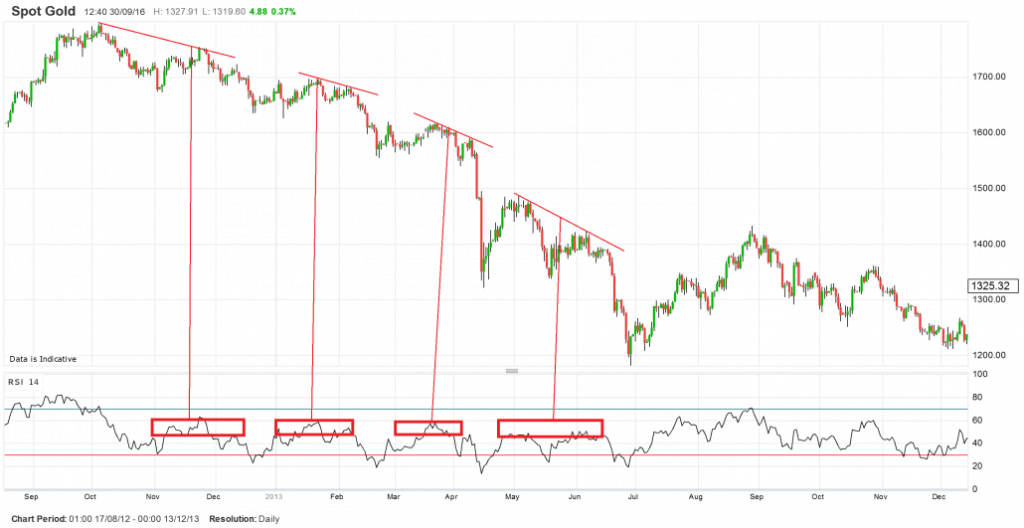
During the downtrend in the GOLD, the RSI never managed to get higher than 60.
And this zone of resistance held for 9 months.
When the RSI finally broke the 60 level, it was an indication that the trend was undergoing a change.
Support in an uptrend.
As the price begins to trend, RSI forms a type of support between the 40 and 50 levels.
This can been seen clearly in our GOLD example above.
Once the bullish center line cross is complete, the RSI never crosses below 40 as the rally continues.
In summary:
- RSI is useful to confirm your wave count.
- RSI can help to signal opportunities at turning points in the market.
- RSI can help identify the ending of an Elliott wave structure through divergence.
- And; RSI can be used an indication to close out positions.
Not so shabby eh!
Use this method correctly and you will improve your skill at identifying turning points in the market.
How to use Elliott wave signals in your trading.
